1 Introduction
This paper uses income replacement rates to assess whether a defined contribution (DC) system that allows partial utilization of mandatory savings for housing finance, can provide adequate retirement savings for young Singaporean entrant workers. The income replacement rate is defined as the ratio of retirement payouts to pre-retirement earnings. It indicates how much of one's pre-retirement earnings are replaced by payouts from his retirement savings. Pension economists often use replacement rates to assess and compare different social security systems. Replacement rates are also used as a rule of thumb to indicate retirement preparedness.
Calculations of replacement rates vary because there are different conceptual and measurement differences as to what should be included in the numerator and the denominator. While there is a consensus that the numerator of a replacement rate should consist of retirement income, there are many views on what constitutes a good measurement of pre-retirement earnings in the denominator. Biggs and Springstead (Reference Biggs and Springstead2008) provided a very comprehensive discussion on replacement rate measurements. They posited that whether a given replacement rate represents adequate retirement income depends on the appropriate choice of pre-retirement earnings. They used four different metrics for preretirement earnings: final earnings; the constant income payable from the present value of lifetime earnings; wage-indexed average of all earnings prior to claiming social security benefits; and the inflation-adjusted average of all earnings prior to claiming social security. Results from their micro simulation model showed that replacement rates could vary considerably depending on what pre-retirement earnings were used.
There are also diverse views on the target optimal replacement rate. Conventional wisdom suggested that workers should have resources to generate a fixed percentage of pre-retirement income to maintain their standard of living after retirement. Munnell and Soto (Reference Munnell and Soto2005) concluded that middle-income earners needed about 70–75% of their pre-retirement earnings to maintain their lifestyle. Replacement rate studies conducted by Schieber (Reference Schieber2004) and McGill et al. (Reference McGill, Brown, Haley and Schieber2005) also arrived at around 70%. The World Bank recommended a net replacement rate of between 53% and 78% for middle-income earners, where 53% is the rate to replace net final year wage and 78% to replace net average lifetime wage. (World Bank, 1994, p. 294).
Recently, several pension economists argued that conventional replacement rates studies failed to take into account how income, consumption and saving patterns vary over the workers’ life cycles.Footnote 1 In the calculation of replacement rates, Scholz and Seshadri (Reference Scholz and Seshadri2009) took into account variations in individual's socio-economic circumstances, such as marital status, children, market rates of returns and individual's retirement preferences. Based on an augmented life-cycle model of household behavior, they found that the optimal replacement rate was higher for married couples than individuals who remained single. The optimal target replacement rate was also higher for households with more children, compared with those with no children.
Indeed, the OECD report Pensions at a Glance, 2013 presented a broader perspective and a complete picture of retirement adequacy. Housing wealth, financial wealth, and the value of publicly provided services all affect retirement adequacy. The report also raised the issue on the nexus between housing and pension policies and the importance to take into consideration that many elderly are homeowners. It is a stylized fact that homeownership rises with age. For example, on average, in OECD, 77% of household heads of household aged 55 and over are homeowners, compared to 60% in the under-45 age group. In Chile, France, Greece, Iceland, Slovenia and the USA, home-ownership rates are between one-fourth and one-third higher for older age groups than younger age groups.Footnote 2
Focusing retirement adequacy on pensions or annuity incomes may detract from the full retirement adequacy picture, as homeowners do not pay rent and hence need less cash. Hence, ‘including imputed rents in disposable household income is a step towards a fuller and more accurate definition of material well-being’.Footnote 3 It is important to consider ‘imputed rent’ to quantify the homeowner's advantage over rent-paying tenants. Factoring imputed rents into income increase disposable income. The effects can be substantial, in the magnitude of between 20% and 29% with the impact being greatest among older female homeowners.Footnote 4 Furthermore, Calvo et al. (Reference Calvo, Sanchez and Cortinas2010) show that inclusion of imputed rents significantly lower poverty rates. The poverty rate is reduced by more than half for over-65s who live alone, with an even greater impact on elderly women living alone.
Singapore has very high homeownership with the presence of a nexus between retirement and housing policies. Singapore operates a DC social security scheme under the Central Provident Fund (CPF). The design of the CPF total contribution rates and allocation rates to various savings accounts, together with the utilization of CPF monies to finance housing nudge Singaporeans to become homeowners. CPF members have the flexibility to use part of the CPF savings for housing down payments, stamp duty, and monthly mortgage payments. Over 70% of flat owners service their housing loan solely with CPF savings, resulting in high homeownership rates of 91% nationally (DOS, 2014a). Consequently, home-owning retirees largely need not pay rents and would thus require less retirement income. Thus in evaluating retirement adequacy of the retirement system in Singapore, it is important to incorporate the tight link between housing and pension policies which led to high homeownership. To assess the retirement adequacy of Singapore using replacement rates, the choice of the income to be replaced should take into consideration the imputed rents. There is also a need to incorporate imputed rent in the numerator, as it would have augmented pension incomes. The level of replacement rate would then be different for homeowners and renters. Brady (Reference Brady2010) computed replacement rates incorporating imputed rent for owner-occupied housing, savings, and taxes, which would better represent consumption replacement and provide better metrics to assess retirement adequacy.
This paper adopts a wider perspective of retirement adequacy and includes net imputed rents in the calculation of replacement rates to gauge retirement adequacy. While housing wealth can be an asset in enhancing retirement income, it is also a consumption good. Homeowners have to spend money to maintain their homes. We thus also compute the net imputed rent to account for the cost of homeownership, such as maintenance and mortgage costs. This perspective is relevant not only in assessing the adequacy of the retirement system in Singapore but also elsewhere, where there is high home ownership among retirees.
This paper also seeks to fill the gaps in previous studies of Singapore's pension income replacement rates. Computations of replacement rates were for new entrant workers; and included major institutional details of the CPF system, that is, the prevailing CPF parameters and rules. The simulation model uses CPF administrative data and data from the Labour Force Survey, which were previously unavailable to researchers. The simulation results demonstrate that replacement rates depend on the worker's choice of housing consumption. Housing choice determines the amount of CPF monies withdrawn. There is thus a trade-off between retirement adequacy and housing consumption. During the payout phase, annuity payouts are determined by CPF accumulation net of savings withdrawn for housing finance.
We also consider the concept and measurement of the income that needed to be replaced. Some authors, for example, Hui (Reference Hui2012) uses the income at age 65 in his calculations. To better assess retirement adequacy, instead of replacing income in a particular age, following Brady (Reference Brady2010), we use average lifetime earnings. Given the prevalence of home-owning retirees, we carefully calibrate the net imputed rents. When the replacement rates calculation includes net imputed rent, a median male worker is able to replace 65% of his average real lifetime net earnings, compared with of 53% when net imputed rent is not included. For a median female worker, the average net income replacement rates are, respectively, 64% and 49% with and without net imputed rent. Thus, including net imputed rent boosts the replacement rates by 12 percentage points for male workers and by 15 percentage points for female workers.
The rest of this paper is organized as follows. Section 2 describes briefly the CPF system, the model structure, and the parameter assumptions. Section 3 presents the baseline results on replacement rates. Section 4 shows the sensitivity of the baseline results to types of housing consumption, financing of housing mortgages, and cost of living adjustment. Section 5 concludes with some policy recommendations.
2 Model structure and parameter assumptions
This paper assesses the adequacy of the retirement payouts for young entrant workers in Singapore under the CPF system. The CPF is a fully funded mandatory DC system administered and managed by the CPF Board. Working Singaporeans and their employers make monthly contributions to the CPF. Such contributions are channeled into three individual saving accounts for different purposes. Savings in the special account (SA) and medisave account (MA) are earmarked for retirement and healthcare expenses, respectively. Savings in the ordinary account (OA) can be withdrawn before retirement for investment in housing and financial assets.
One main advantage of a DC system is that it is fiscally sustainable. The policy concern is whether such an employment-based system could deliver adequate retirement savings.Footnote 5 How much CPF savings could replace pre-retirement earnings would depend on the accumulation phase. This, in turn, depends on workers’ characteristics such as their initial wage level, earnings growth path, the length of the contribution period and contribution density. It also depends on CPF policy parameters such as contribution rates, allocations to the different accounts and returns to CPF savings. By allowing pre-retirement withdrawals for housing finance, it is necessary to take into account these details when assessing the retirement adequacy of the CPF system.
There have been some recent computations of income replacement rates for Singapore. Hui (Reference Hui2012), in evaluating the retirement adequacy of CPF, used 66% as the target gross income replacement rate. The gross replacement rates were calculated relative to earnings at age 65. The gross replacement rates are then evaluated against the target rates for workers with different education levels. Findings from his base case model (which did not include home purchase) showed that only workers with secondary education could achieve the target replacement rate upon retirement at age 65. Workers with post-secondary and tertiary education would have replacement rates below the targeted 66%.
Computations of replacement rates for Singapore by some international agencies indicated much lower rates. For example, in the compilation of a global pension index, Melbourne Mercer (2012) reported that the net replacement rate for a median income earner in Singapore was below 20%. Similarly, the OECD's Pensions at a Glance in 2012 reported that the gross replacement rate for Singapore was 13% for a working career of 40 years and 9.3% for a shorter career of 30 years. See OECD (2012, p. 36). These international figures are low because the methodologies used in these reports are not designed for evaluating the CPF system, which differs in important respects from the pension systems in most OECD countries. For example, only savings in the SA earmarked for retirement are included in the computation, while savings in the OA are largely excluded.Footnote 6 Indeed, OECD (2012) qualified that Singapore's replacement rate would be 82% if all CPF savings, both in the OA and SAs are put towards retirement-income provision, without any pre-retirement withdrawals for housing.Footnote 7
We compute income replacement rates for lower-middle, median and upper-middle income young entrant workers in 2012, proxied by workers at the 30th, 50th, and 70th income percentiles, respectively. To compute income replacement rates when these entrant workers retire at age 65, we project CPF accumulations in their OA and SAs. The accumulation account varies with different age-earnings profiles, for example, initial wage and real wage growth; employment density returns to CPF savings and amount withdrawn to finance housing. In what follows, we highlight the model structure and the assumptions used in the model, which are largely based on empirical data.
2.1 Earnings paths
In the base model, we assume that male workers enter the workforce at age 25 and female workers at age 23; and they retire at age 65. The starting wages and starting CPF balances are based on CPF administrative data of workers at that age. Table 1 reports the starting wages of male and female workers, which are used to anchor the lifetime earnings path for different income percentiles.
Starting wages of male and female workers (in 2012 dollars)

Source: CPF administrative data.
With regards to wage growth rates, both OECD (2012) and Hui (Reference Hui2012) assumed constant annual growth rates. We use data from the Ministry of Manpower (MOM) Labour Force Survey from 2001 to 2011 to simulate real wage growth paths for individuals since wage growth is a key factor in determining how much CPF savings are accumulated.
As an illustration, for each income percentile level, to calculate the real wage growth of a worker aged 30–34, we first rebase the wage series to the same reference year before computing the annualized real wage growth for: (i) workers who moved from age 25–29 (in 2001) to age 30–34 (in 2006) and (ii) workers who moved from age 30–34 (in 2001) to age 35–39 (in 2006). The real growth rates from (i) and (ii) are then averaged to avoid under/overestimation of the real wage growth. The same procedure is repeated using data from 2006 to 2011. To account for cyclical effects, we take the average of the annualized real wage growths over the two 5-year periods (i.e.2001–2006 and 2006–2011) to obtain the real wage growth for workers aged 30–34. The same process is repeated to calibrate the real wage growth of workers in other 5-year age bands.
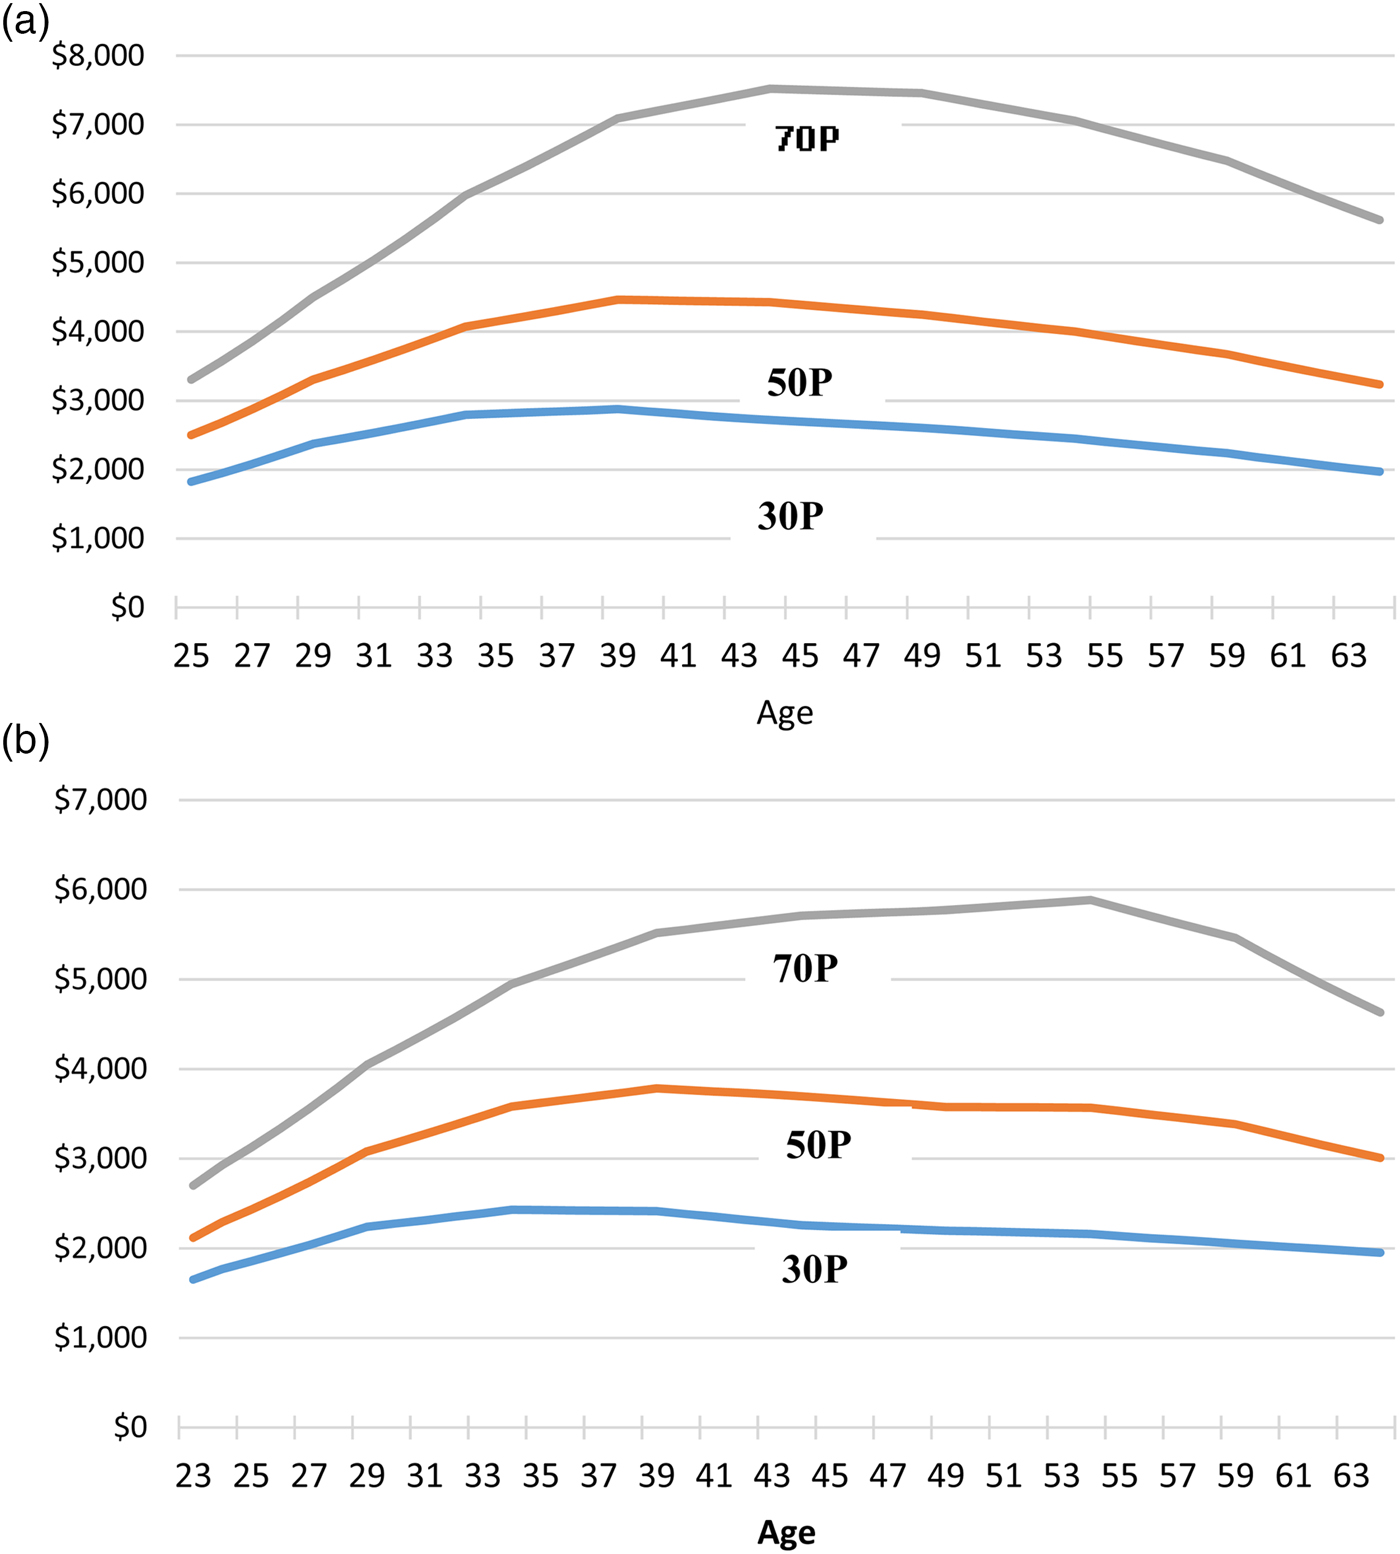
With detailed empirical data from the Labor Force Survey, we map out the age-earnings profile of workers over their working life for each income percentile, thereby providing more realistic wage growth data for the model. Figures 1a and 1b show the resulting empirical age-earnings profile for workers at different income percentiles.Footnote 8 It is a hump-shaped distribution of earnings by age where wage growth is faster when the worker is young and tapers off as he gets older. This profile could be attributed to the effects of human capital. In the initial years of work, average earnings rise as workers accumulate human capital (skills and experience). It falls around age 45–50 possibly due to changes in labor-leisure preferences as workers reduce their work hours and phase into retirement.Footnote 9
(Colour online) (a) Empirical age-earnings profile (male workers). (b) Empirical age-earnings profile (female workers). Source: Authors’ calculations.

Savings accumulation depends on the earnings profile. The hump-shaped age-earnings profile may be indicative that seniority-based wage structure is no longer a norm in Singapore. A hump-shaped profile also implies that workers will save more during the early work cycle, and the savings will be compounded for a longer period. We also assume that workers remain in their respective income percentiles throughout their working life. Workers, in reality, can possibly move across income percentiles through their working careers. For sensitivity study, we allow workers to move to higher income percentiles.
2.2 CPF policy parameters
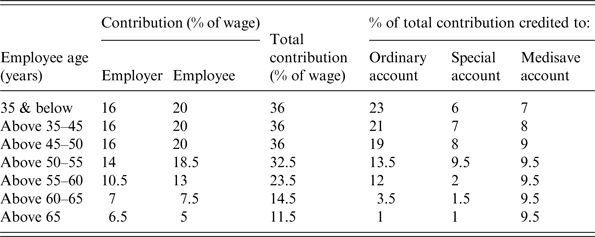
The CPF parameters used in the simulation model are based on policies in September 2012. The contribution rates and the allocation of contributions into the different accounts are tabulated in Table 2.
Rates of contribution and allocation as of 1 September 2012

Source: CPF website at http://www.cpf.gov.sg.
Notes: All figures are in percent of wage. Figures above are for monthly wages of $1,500 and above.
Interest rates for the OA are at the statutory minimum of 2.5% per annum. Returns to savings in the SA, MA, and the Retirement Account (RA) are at the floor rate of 4%. For simplicity, we use these rates to project accumulated CPF savings over the work cycle. Furthermore, we assume that the CPF Board will continue to give an extra 1% interest on the first $60,000 of CPF savings including up to $20,000 in the OA. These assumed long-run rates are equivalent to a real interest rate of 0.7% per annum for the OA and 2.2% for the SA and RAs, if we factor in a long-run inflation rate of 1.8%, which is the 20-year annualized inflation rate using the consumer price index for the period 1991 to 2011. These assumed rates are lower than the historical real rate of return for these accounts.Footnote 10
Contributions to CPF are subject to a salary cap. The salary ceiling was $5,000 in 2012. However, in anticipation that CPF will adopt the recommendation by the Economic Review Committee 2003 to peg salary ceiling to the income of the 80th percentileFootnote 11, we set the salary ceiling to the wage growth of the 80th income percentile, i.e. at a constant real rate of 1.6% (MTI, 2003). The growth rate is based on the historical compounded annual growth rate of the 80th percentile gross monthly income from work among full-time workers from 2001 to 2011. The data were provided by the MOM.
2.3 Housing consumption
About 85% of Singaporeans live in subsidized public housing built by the Singapore Housing Development Board (HDB). To encourage home ownership, HDB homebuyers enjoy explicit subsidies and these flats are priced affordably. There is a range of HDB flats in terms of size, quality, and finishing to meet different housing needs and aspirations.Footnote 12 HDB flat types are categorized by the number of rooms.Footnote 13
We assume that married couples purchase HDB flats directly from the HDB under the build to order (BTO) scheme.Footnote 14 The marriage age of male workers are set at 30. His spouse, who belongs to the same income percentile, is aged 28.Footnote 15 We assume that they buy a flat type within their financial means. The 30th income percentile (30P) buys a three-room flat; 50th income percentile (50P) buys a four-room flat and 70th income percentile (70P) buys a five-room flat. Eligible grants are included in the study to compute the effective home mortgage loans.
Besides market price subsidies, the government also provides CPF Housing Grant to all eligible HDB homebuyers. These grants are in terms of CPF monies. The grants are credited to the buyer's CPF OA and can be used to pay for the CPF portion of the initial down payment. The balance, if any, must be used to reduce the mortgage loan. Grants are tiered according to the socio-economic characteristics of HDB buyers (earned incomes, singles, couple, or singles/couples with parents staying them) and according to the types of flats purchased (new flats purchased directly from HDB, flats from the resale secondary market or premium flats purchased from private developers). Higher grants reduce the effective housing loans and thus lead to smaller withdrawals from the OA to pay for the reduced mortgage payments.
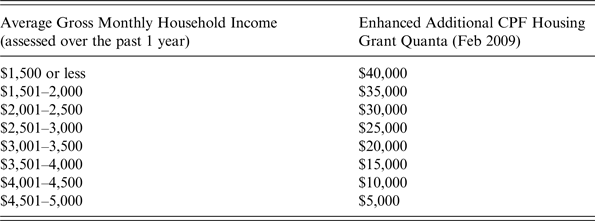
In addition to the CPF Housing Grant, there are additional housing subsidies for low- and middle-income families to buy subsidized HDB flats. These include the Additional CPF Housing Grant (AHG) and Special CPF Housing Grant (SHG). AHG was introduced in 2006 and SHG was introduced in 2011. Under AHG, first-time homebuyers in Singapore with a monthly household income below $5,000 are eligible for additional housing grants.Footnote 16 The AHG amount ranges from $5,000 to 40,000 depending on the buyers’ average gross monthly household income. As can be gleaned from Table 3, low-income households with $1,500 or less can get an AHG of $40,000. AHGs are included in the calibration of the effective housing loans.
Additional CPF housing grant

Source: CPF website.
Special CPF Housing Grant (SHG) targets low-income families, with average household income below $2,250, to help them buy new HDB flats. They are however limited to buying smaller (two-room or three-room) standard flats in non-mature estates. SHG, which ranges from $5,000 to 20,000, is given on top of AHG. In this study, only 30P workers buying HDB are eligible to receive both SHG and AHG.
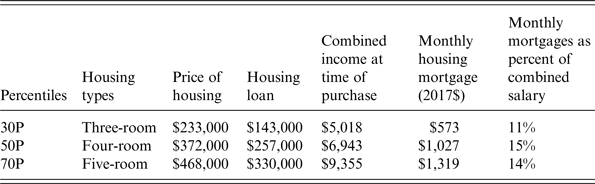
Table 4 summarizes the HDB types bought by the different income percentiles, the housing price, housing loan, and mortgage. The computed monthly mortgage payment is based on the effective housing loan. This is the flat price net of the housing grants and initial down payment. The HDB flat prices used are the median BTO selling price by flat type in 2011. The prices used are $233,000 for three-room flat, $372,000 for four-room flat and $468,000 for five-room flat.
Housing consumption and financing

Source: Authors’ calculations.
Note: The effective housing loan is net of housing grant and house down-payment.
Since we assume that an entrant male worker at age 25 will buy a BTO flat when he turns 30, the BTO housing prices in 2011 dollars need to be adjusted to account for housing appreciation over 5 years. Based on the sale price of new flats reported in HDB Annual Reports, the real annualized growth rate of new flat prices between 2008/09 and 2010/11 is about 3%. However, we choose to use a lower real housing appreciation rate of 2%. This is because the government has articulated its housing policy to moderate the price increase of new flats to make public housing affordable. To achieve this policy objective, HDB has also increased the supply of BTO flats.
We assume that the couple will fully utilize their accumulated CPF savings in the OA for down payments, which is a requirement set by the HDB. The remaining outstanding amount, net of housing grants, is financed using HDB loans, up to a maximum of 90% of the purchase price. The HDB mortgage-financing rate is at 2.6% per annum and mortgage duration is up to 30 years. The monthly mortgage will be paid from monthly mandatory contributions to the CPF OA. CPF monies, however, cannot be used to pay for house-related expenses such as property tax, maintenance fees, and home improvement. In our base case, we assume joint financing. The monthly housing mortgage payment is shared equally between the couple and is paid out from their CPF monies in their OAs.
The computed monthly mortgage payments for the different percentiles are presented in Table 4. The last column shows the ratio of the monthly mortgage payment as a percentage of salary at the time of house purchase. The monthly mortgage cost for Singaporean household buying subsidized public housing is <15% of household income. Housing cost burden is much lower than most OECD countries. In the USA, housing costs were 20% of household incomes for above-median households and 32% for moderate-income households (Haas et al., Reference Haas, Hickey, Lubell and Morse2012). Not only is the housing cost burden lower in Singapore, there is a financing mechanism set in place to pay for the housing mortgage. Homebuyers can use their monthly contributions to pay for the monthly housing mortgage. The ratio is smaller than the mandated total contributions into the OA. For example, for workers under 35 years old, CPF contributions from both employer and employee amounted to 36% of the monthly salary. Out of this 36%, 23% is credited to the OA (see Table 2). This means that the monthly CPF contributions in the OA can meet the entire monthly mortgage payments. Unutilized savings in the OA will accumulate as retirement saving. As income increases over the work-cycle, excess savings in the OA net of mortgage payments will also grow.
2.4 Retirement income
The model also incorporates the features of the CPF payout phase.Footnote 17 Although CPF members can withdraw part of their savings at age 55 by pledging their property, they cannot cash out the entire amount of savings. They have to set aside a decreed retirement amount in their RA. This account is created when a member reaches 55. The decreed sum is cohort-specific, set by the CPF Board. Since 2009, CPF members have to annuitize the monies in their RA under the national annuity scheme known as the CPF LIFE (CPF Lifelong Income for the Elderly). There are two CPF LIFE plans – the Standard and Basic Plans. Both plans allow for a bequest. The Standard Plan, which is also the default plan, annuitizes a larger proportion of accumulated savings, provides higher monthly payouts but leaves less as a bequest.Footnote 18 The Standard Plan, annuitizes a smaller proportion of accumulated savings and gives smaller monthly payouts, in return for a higher bequest.
In the benchmark model, we assume that the entire accumulated CPF savings in the SA and OAs net of withdrawals for housing are fully annuitized. Premiums for CPF LIFE are assumed to be paid in two tranches. The first tranche is paid at age 55, when the net accumulated savings up to the full retirement sum is committed to buying the CPF LIFE product. Amounts above the full retirement sum, if any, will remain in the OA and SAs. This amount with interest accrued, together with new CPF contributions from work at age 55 to age 64, will be used to pay the second tranche of CPF LIFE premiums at age 65.
The first monthly payout begins at the drawdown age of 65. Monthly payouts from the simulated CPF balances are provided by the CPF Board. The formulae used to calculate the payouts are not publicly accessible. The payouts are different for males and females as females have a longer life expectancy. No income tax is imposed on CPF payouts.
Although CPF LIFE redresses longevity risks, it does not address inflation risk. CPF LIFE monthly payouts are fixed; without cost of living adjustments and not linked to the consumer price index. Thus, the replacement rate computed using annuity payout at the drawdown age of 65 for the first year of retirement ( $y_{65}^g $) does not reflect retirement adequacy for subsequent years. We, therefore, indexed the CPF LIFE payouts to inflation to reflect ‘real annuity, which is more consistent with the goal of smoothening real consumption during retirement.’ (Brady, Reference Brady2010, p. 242). Following Brady, we compute the average retirement consumptions, weighted by survival probabilities, so that retirement income received in the earlier year of retirement is given greater weight.
The expected real annual retirement income at age t is given by ( $Y_t^g $) and defined as follows:
 $$Y_t^g = \displaystyle{{y_{65}^g} \over {(1 + \pi )^{t - 65}}} \times {}_t^g p_{65}, $$
where  $y_{65}^g $ is the nominal annuity payouts starting at age 65 and g indicates the gender.
 ${}_t^g P_{65} $ denotes the probability of survival of an individual at age 65 up to time t. The time t indexes the age of the individual. The maximum age is 100.Footnote 19 To obtain the real value of the retirement income, the CPF LIFE payouts are discounted using core inflation. Compared with headline inflation, core inflation, which excludes private transport and housing rentals, is a better measurement of the cost of living adjustment since the majority of Singaporeans are homeowners and use public transport. Using the core inflation data series from 1990 to 2013 published by the Monetary Authority of Singapore (MAS), we set the average core inflation to 1.8%.Footnote 20
The average real annual payouts for different genders (AY g) is defined as:
 $$AY^g = \; \; \; \; \displaystyle{{\mathop \sum \nolimits_{t = 65}^{100} Y_t^g} \over {\mathop \sum \nolimits_{t = 65}^{100} {}_t^g p_{65}}}. $$
3 Net income replacement rates under the base case
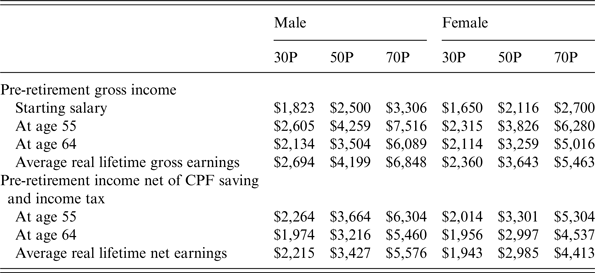
In this section, we assess the retirement adequacy of the Singapore pension system using income replacement rates. The average retirement income in the numerator is the monthly real payouts from CPF LIFE given in equation (2). For the denominator, because of a hump-shaped age-earning profile, using earnings just prior to retirement implies lower pre-retirement earnings and higher replacement rates. On the other hand, using peak or near-peak earnings at age 55 will yield lower replacement rates. We thus do not assess retirement adequacy based on replacing income for a particular single year. Instead, we use average lifetime income in the denominator.Footnote 21 Generally, Singapore men enter the labor force 2 years after females because of mandatory military service. The average lifetime earnings for male are computed from age 25 to 64 and that of females from age 23 to 64. We assume workers to have uninterrupted working careers. An annual bonus locally referred to as the 13th-month payment, is included in the annual earnings. It is a common practice in Singapore for workers to receive an annual bonus which is equivalent to at least one month's salary. Based on the empirical real wage growth in Figures 1a and 1b, we compute the average lifetime gross incomes for different income percentiles. Table 5 tabulates the gross and net earnings at ages 55 and 64; and the average gross and net lifetime earnings.
Monthly earnings of male and female workers (2012$)

Source: Authors’ calculations.
The OECD used both gross and net replacement rates to compare pension systems around the world. Gross replacement rate is the ratio of gross pension entitlements to gross pre-retirement earnings. Several authors, for examples, Brady (Reference Brady2010), MacDonald and Moore (Reference MacDonald and Moore2011), and Purcell (Reference Purcell2012) wrote that in assessing what is an adequate replacement ratio, one ought to be mindful that retirement income needs not replace the entire or gross pre-retirement earnings. This is because retirees need not pay taxes and need not contribute to social security. Assessing how much pension income can replace net pre-retirement disposable income, rather than gross income, is thus a better gauge on adequacy since it proxies pre-retirement levels of consumption better. We thus focus only on net replacement rates in the result analyses.
To calculate pre-retirement net earnings, we deduct workers’ personal income taxes and CPF contributions from their pre-retirement gross earnings. To calibrate the income tax payable, we use the current tax rules to assess taxable income and assume that the income tax schedule remains unchanged.Footnote 22 The average net lifetime earnings for male and female workers are given in the last row in Table 5. Replacement rates are calculated by taking the ratio of average real payouts from CPF LIFE annuities (which are not taxable) relative to the average real lifetime net earnings.
Target replacement rates for retirement preparedness need not be 100%. This is consistent with studies by pension experts and economists, for example, Scholz and Seshadri (Reference Scholz and Seshadri2009). They opined that once changes in consumption pattern over the lifecycle are considered, the amount that needs to be replaced is smaller than conventional wisdom. Retirees, for example, need not incur the expense of raising children, and they need not incur work-related expenses.
This is also observed in the data from the household expenditure survey. Retiree households in Singapore also spend less on educational services, clothing and footwear, transport, and communications. See DOS (2014c). While non-retiree households spent 5.4% of their total expenditure on educational services, this is negligible for retiree households. Work-related expenditure such as transport cost accounts for 14.1% of total expenditure for non-retiree households, but 5% for retiree households. The proportion spent on clothing and footwear for retiree household is 1.2% as compared with 2.7% for non-retiree households. There was a shift to more home cooked meals and a fall in food servicing services which included restaurant meals and meals bought from the food court and hawker centers. Food servicing services constituted 7.1% of the total retiree household expenditure, compared with 13.2% for non-retiree households. Assuming that future retirees would have similar consumption pattern as current retirees, the optimal consumption replacement rate would be below 100% for retirement adequacy.
3.1 Retirement adequacy of workers under base case scenario
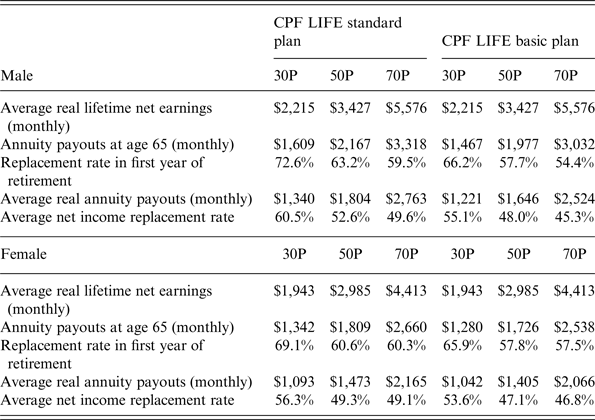
We examine the retirement adequacy of lower-middle (30P), median (50P) and upper-middle income (70P) male workers at age 65. Table 6 summarizes the average lifetime earnings, retirement incomes and the net replacement rates under the base case scenario. Net replacement rate in the first year of retirement is the ratio of CPF LIFE annuity payouts at age 65 to average lifetime income. The net replacement rates under the Standard Plan for lower-middle, median, and upper-middle income male workers are 72.6%, 63.2%, and 59.5%, respectively. See Table 6. The net replacement rates for lower-middle, median, and upper-middle income female workers are higher, at 69.1%, 60.6%, and 60.3%, respectively. The corresponding replacement rates under the Basic Plan for male and female workers are relatively lower by about 4–6 percentage points.
Average lifetime earnings, annuity payouts, and net replacement rates under base case

Source: Authors’ calculations.
The net replacement rates in the first year of retirement are comparable with the OECD for full career workers entering the labor market in 2012. The net replacement rate for median earners in Singapore is lower than the net pension replacement rates for median earner in some OECD countries, for example, Australia (75.6%), Austria (89.9%), Canada (64.4%), and Switzerland (77.8%). It is comparable with Belgium (63.9%) and Norway (63.8%). It is higher than some OECD countries, for example, Germany (57.8%), Japan (49.1%), Korea (49.1%), Sweden (55.3%), the UK (48%), and the USA (49.9%). The net replacement rate for median income earners in the OECD countries is 69%. See OECD (2013b, p.143).
Table 6 also presents the average real annuity monthly payouts, calculated by using equation (2), using a core inflation rate of 1.8% per annum. The average net income replacement rate uses average real annuity payouts in the numerator and average real lifetime net earnings in the denominator. Accounting for inflation, the average net replacement rates are lower than replacement rates in the first year of retirement. Under the Standard Plan, average replacement rates are 52.6% and 49.3% for median male and female workers, respectively. The simulation results show that average net replacement rates for median male and female workers would be 10.6 and 11.3 percentage points lower if CPF LIFE annuity payouts are not inflation indexed. Replacement rates without inflation adjustments are lower than the OECD average, but are comparable with Germany, Japan, Sweden, the UK, and the USA. Our findings indicate that if CPF LIFE annuity payouts were inflation-indexed, then the CPF system would deliver better retirement support than some OECD countries.Footnote 23
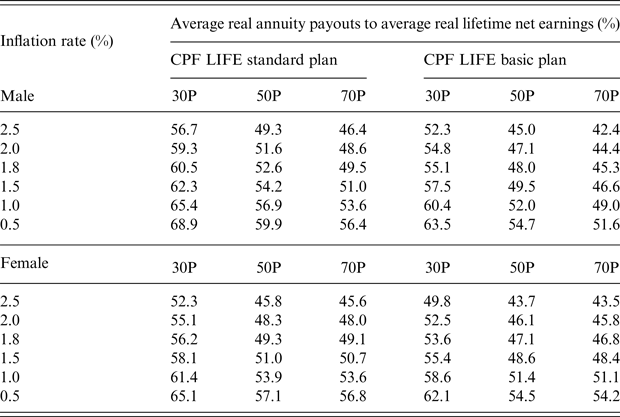
Next, we perform sensitivity analyses of the average replacement rates using different core inflation rates. The core inflation rates used are 0.5%, 1.0%, 1.5%, 2.0%, and 2.5%, whereas 1.8% is used in the base case scenario. Table 7 displays the computed average replacement rates for various core inflation rates under the Standard and Basic Plans.
Sensitivity of average net replacement rate to inflation

Source: Authors’ calculations.
Table 7 shows that there is a negative relationship between average replacement rate and core inflation across different income percentiles. For example under the Standard Plan, the average replacement rate for median male workers decreases from 52.6% to 49.3% as the core inflation increases from 1.8% to 2.5%, which further increases to 59.9% when the core inflation drops to 0.5%.
3.2 Average net replacement rate with imputed rent
The homeownership rate in Singapore is about 90.5%. Since the mid-1980s, home ownership in most OECD regions has increased. OECD (2013b) opined that the upward trend in home ownership could be attributed, in part, to population aging as older people are generally more likely to be homeowners. Andrews et al. (Reference Andrews, Caldera Sánchez and Johansson2011) found that up to 1 percentage point of the growth in owner-occupancy homes is due to aging. The effect is most pronounced in Canada, Denmark, Germany, and Switzerland. With high elderly homeownership, it is imperative to include imputed rents in the replacement rates calculations to better reflect the state of retirement adequacy among home-owning pensioners. Even if they do not monetize their housing assets because of strong bequest motive and/or strong aging-in-place preference, being homeowners can make a big difference to retirees as they need not pay rents and thus have more resources available for consumption. For Singapore, rental costs would have been the largest expenditure item for most healthy retirees if they were renters. Imputed rental would come out to about 37% of the household budget. See DOS (2014c, Table 46).
According to Munnell and Soto (Reference Munnell and Soto2005), imputed rent is the amount that the owner would have to pay to rent an equivalent dwelling and is treated as an amount that the homeowners pay to themselves. It is included in both the numerator and denominator of replacement ratio. Imputed rent is included in the numerator because it is considered as part of the retirement income, which supports housing consumption during retirement. It is also included in the denominator as worker receives imputed rent as part of his income before retirement.
Incorporating imputed rent into the replacement rate formula is particularly challenging as there are various measurements for imputed rent. We perform two separate sets of income replacement calculations that factor in imputed rent. We will first report replacement rates, using imputed rent for the retiree households published in Department of Statistics (DOS, 2014c, Table 46). This uses the rental equivalent approach based on the housing asset. This approach, however, did not consider the asset cost burden and the tight link between housing and retirement policies. Section 3.3 will study these considerations in details.
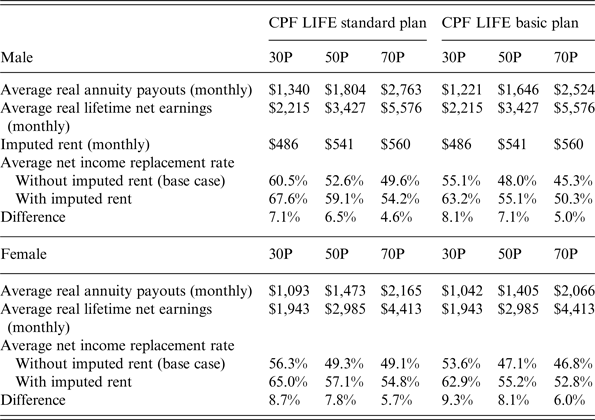
In benchmarking the imputed rent, DOS uses the estimated market rent of the flat if it is rented out an unfurnished net of maintenance cost. DOS's estimation of imputed rent is based on the AAV (annual assessed values that the Inland Revenue Authority of Singapore (IRAS) uses to compute the property tax payable. The imputed rents per retiree household member are $486, $541, and $560 for three-room, four-room, and five-room HDB flats, respectively. In computing replacement rates to account for homeownership, we added imputed rents to both the numerator and denominator since mortgage payments are paid from the CPF OA.
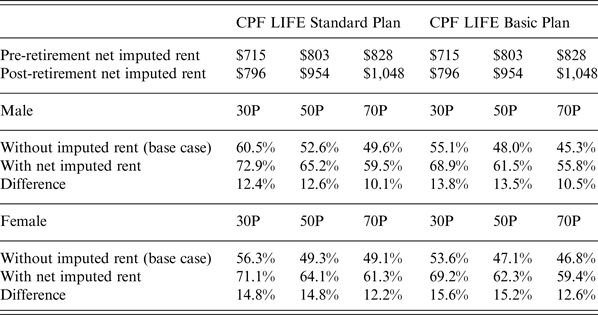
Table 8 compares the average net replacement rates in the base case with and without imputed rent. Including imputed rent would augment the replacement rates by percentage points ranging from 4.6 to 8.1 for male workers, and from 5.7 to 9.3 for female workers, depending on the annuity plans and the income percentiles.
Average net replacement rates with and without imputed rent, using published data from DOS

Source: Authors’ calculations.
3.3 Pre- and post-retirement net imputed rent
Because of the asset cost burden and the tight link between housing and retirement policies, there are differences in the net imputed rent before and after retirement.Footnote 24 According to Cronin (Reference Cronin1999, p. 12), net imputed rent is gross rent minus the costs of homeownership. Homeownership costs include mortgage interest payments, property taxes, depreciation, maintenance, and repairs. DOS's computation of net imputed rent considered only maintenance costs but not mortgage interest payments. Furthermore, the imputed rent concept did not account for maximum house tenure allowable under housing loans. The loan tenure rule is to ensure that most homeowners no longer need to make mortgage payments by the time they retire. This implies that the amount of imputed rent added to the numerator (post-retirement) should not be the same as that in the denominator (prior retirement).
We adopt Cronin's approach to compute the pre- and post-retirement net imputed rents. The median rental rates for different flat types for the period 2007Q3 to 2012Q2 are culled from the HDB website. The subletting rental values are then re-based to 2012 dollars before averaging across the period. Column 2 of Table 9 shows the subletting HDB rental rates for different flat types. In addition, property tax rates are based on the IRAS's property tax schedule. The first $8,000 of the assessed value is zero-rated. The remaining assessed value up to $59,000 is taxed at 4%. Based on the subletting rate in the HDB rental market for 2010 to 2012, the assessed value of the flats do not exceed $59,000 and are therefore taxed at 4%. The calculated average monthly property taxes are $42, $57, and $66 for three-room, four-room, and five-room, respectively.Footnote 25 Moreover, data on house maintenance monthly expenditure for different housing types and for different household types including general and retirees are obtained from DOS (2014c). We use this data to proxy the home maintenance expense prior retirement and during retirement. These expenses are given in columns 5 and 6 in Table 9.
Net imputed rent pre- and post- retirements by flat type (in 2012 dollars)

Source: Authors’ calculations.
Note: 1Assuming a two-person household.
Mortgage payments consist of the principal and interest payments. The principal is considered as savings and is excluded from net imputed rent. Interest payment is part of the cost of homeownership. However, since interest payments stop when the mortgage is paid off, these are not expenses that need to be funded in retirement. In the base model, the interest payments are amortized over 30 years using a housing mortgage rate of 2.6%. We discount the present value of all interest payments at the time of home purchase at age 30 and then compute the average payments over the loan period. Finally, we convert the average interest payments to 2012 dollars, the time when the workers enter the workforce. As reported in column 4 of Table 9, the computed present values of the average monthly interest payments under the base case housing consumption are $134, $241, and $308 for 30P, 50P, and 70P, respectively.
Pre- and post-retirement net imputed rents are tabulated in the last two columns of Table 9. Pre-retirement net imputed rent is obtained by deducting property tax, house maintenance, and interest mortgage payment from gross rent. For post-retirement imputed net rent we deduct property tax, home maintenance but not interest mortgage expenses. Hence, net imputed rent prior to retirement is smaller than post-retirement net imputed rent. The average net replacement rate is obtained by adding post-retirement net imputed rents to the average annuity payouts in the numerator, and adding pre-retirement net imputed rent to the average net lifetime income in the denominator. Table 10 reports the adjusted average net replacement rates using pre- and post-retirement net imputed rents under the Standard and Basic Plans for male and female workers. As can be observed, including net imputed rent in the calculation raises the average net replacement rate under both plans. For example, under the Standard Plan, the increases of average net replacement rates are 12.4, 12.6, and 10.1 percentage points for male workers in 30P, 50P, and 70P; and the increases are 14.8, 14.8, and 12.2 percentage points for female workers in 30P, 50P, and 70P, respectively.
Average net replacement rates using pre- and post-retirement net imputed rent

Source: Authors’ calculations.
4 Sensitivity analysis
With the tight link between housing and retirement policies, trade-offs are inevitable. We conduct two sensitivity analyses to illustrate the trade-offs. First, retirement adequacy depends on housing choice. When a CPF member buys a housing type beyond what he can afford, it would trade-off retirement savings. Second, the amount withdrawn for housing finance will be larger if there is only one breadwinner. In the benchmark scenario, we assume both spouses use their CPF monies to pay the housing mortgage. The lower net accumulation during the work-cycle due to housing finance will impact the payout phase. Average net replacement rates are computed for workers in the 30P, 50P, and 70P under CPF LIFE Standard and Basic Plans.
4.1 Housing consumption
In the base case model, we assume that workers buy an HDB housing type within their financial means. Consuming bigger and more expensive house type would mean utilizing more CPF monies to pay for higher housing mortgages; thus leaving less CPF savings for retirement. For sensitivity analysis, we consider the case when workers upsize their housing consumption and buy a flat type one size larger than in the base case. We also consider the situation when workers downsize to smaller flats.
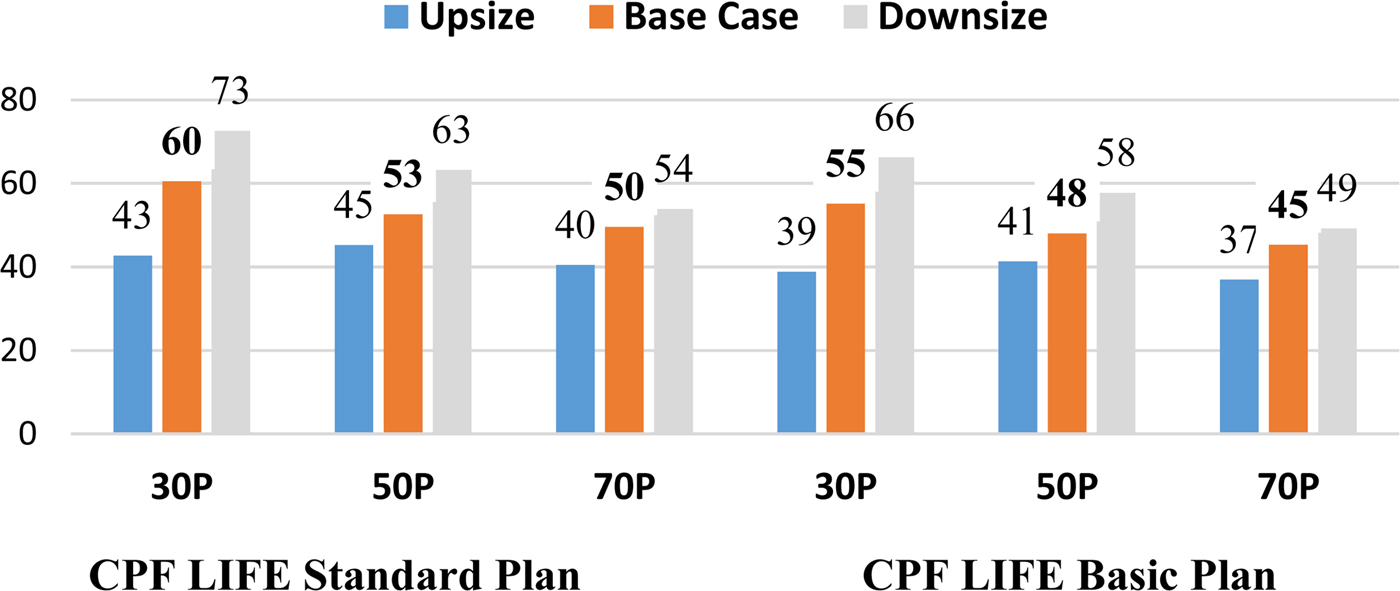
The average net replacement rates using payouts from the Standard Plan for the male worker are presented in Figure 2.Footnote 26 There is a tradeoff between housing consumption and retirement adequacy. Net replacement rates fall when workers upsize their flat type. The fall in replacement rates is more pronounced for lower income groups than for higher income groups. For example, housing loan quantum increases by about $100,000 when a median worker buys a five-room instead of a four-room HDB. With a larger loan, he would have to use the entire monthly contribution in his OA and possibly out-of-pocket cash to pay the monthly mortgage payment. There will be no accumulation in the OA and retirement savings accumulate entirely from CPF contributions in the SA. Annuitizing will then replace about 37–45% of the pre-retirement average lifetime income, depending on the types of annuity products.
(Colour online) Replacement rates with different housing consumption for male workers. Source: Authors’ calculations. Notes: 1. Under downsizing, 30P buys a two-room, 50P buys three-room, and 70P buys four-room. 2. Under upsizing, 30P buys four-room, 50P buys five-room, and 70P buys more epensive BTO flat which costs $550,000 (in 2012 dollars).

On the other hand, replacement rates would be higher when households buy a flat which is one size smaller. For example, under the Standard Plan, the replacement rate for male median workers increases by about 10 percentage points from 53% in the benchmark to 63% by downsizing, which is comparable with several OECD countries’ replacement rate for median earner. This implies that higher replacement rates can be achieved by lowering household's spending on housing by tweaking housing policies such as lowering housing prices or by giving larger housing grant/subsidy.
4.2 Single income earner and sole financing of housing mortgage
In the base case, we assume households to be dual wage earners. The accumulated CPF savings of both husband and wife from the time they enter the labor force are used for down-payment of the flat. Monthly mortgage payments are shared equally between the couple and are paid out from their respective CPF OAs. For sensitivity analysis, we examine the case when only the male (or female) is the sole earner. Since only his CPF savings in the OA are used for down-payment and the monthly mortgage payments, more CPF monies are utilized for housing and less savings for retirement. We run simulations assuming two different types of housing consumption. First, sole-financing but keeping the same amount of housing consumption as specified in the base case. Second, sole-financing but buying a smaller flat, which reduces housing cost by about $100,000. We assume 30P households downsize from three-room to two-room, 50P households from four room to three-room and 70P households from five-room to four-room, respectively.
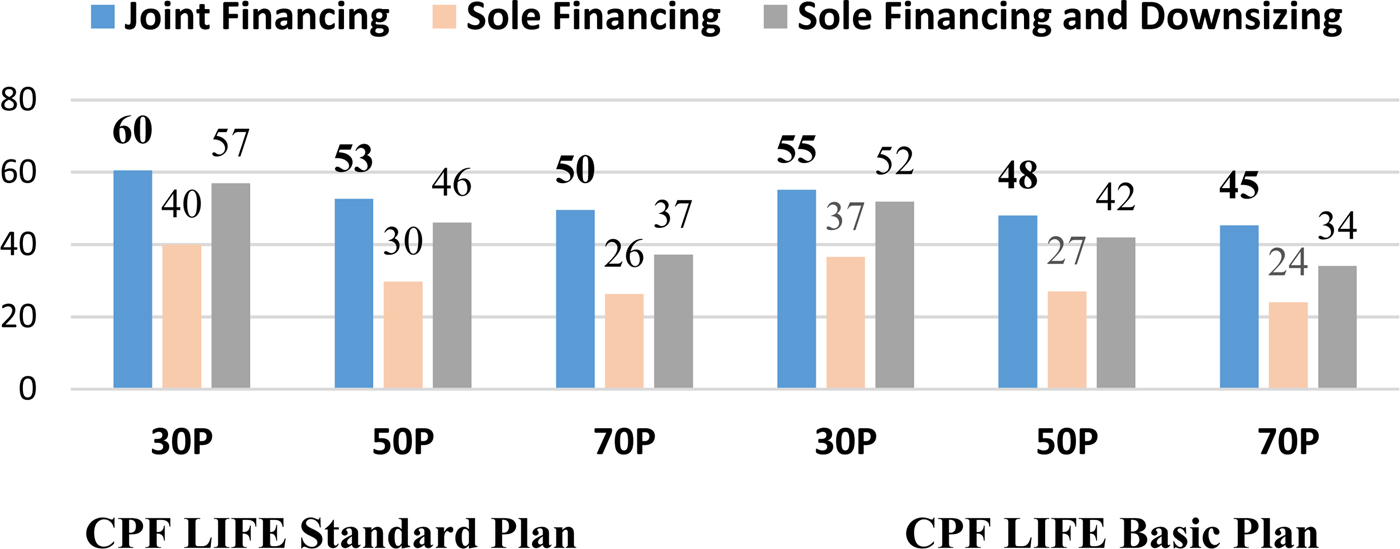
Under the housing grant scheme, lower-income households will receive higher housing grants. A 30P earner, being the sole earner would have lower total income, will be eligible for higher housing grants. The larger housing subsidy and lower housing cost lead to smaller mortgage payments and higher CPF accumulation in the OA and hence higher payouts at retirement. The replacement rate is slightly lower for sole-financing with downsizing. Under the Standard Plan, the replacement rate is 57% compared with 60% under the base case with joint-financing. However, if the sole earner household does not downsize and buys the same flat type as in the base case, the replacement rate will fall to 40% under the Standard Plan as shown in Figure 3.
(Colour online) Replacement rates for male workers with joint-financing versus sole-financing of housing mortgage. Source: Authors’ calculations. Note: Under the downsizing scenario, 30P buys a two-room, 50P buys three-room, and 70P buys four-room.

As can be gleaned from Figure 3, similar patterns are observed for the 50P and 70P households. Single income earner household, even with downsizing, would have lower replacement rates. The fall in replacement rates are respectively, 16 and 11 percentage points for sole earners in the 50P and 70P households under the Standard Plan. The 70P worker would have to use the entire amount of the CPF savings to pay the monthly housing mortgage and hence have smaller accumulation.
Our findings show that single income families have to be more prudent in making their housing consumption decisions. However, if they wish to accumulate more housing wealth, they could consider other available monetizing options to unlock the housing wealth when they retire to enhance their retirement income. They could, for instance, sublet a room or downgrade to a studio apartment to unlock housing equity. In a survey on HDB residents’ housing aspirations and intention to move within the next 5 years, younger residents or those living in smaller flat types had greater intention to upgrade to a bigger flat. In contrast, a lower proportion of older residents had the intention to move, reflecting a greater desire to age in place. (HDB, 2014, p. 131). About 80% of elderly households indicated that they would want to live in their existing flat. The survey also shows that if older households have the intention to move, about 26% of these ones planned to either rent a room/housing unit or live in family members’/friends’ place. Presumably, these households could then monetize their flats for retirement needs and pay reduced rents or have free accommodation.
5 Conclusion
We have employed a simulation model to assess the retirement adequacy of the current cohort of young entrant workers in terms of income replacement rates. The simulations are partially based on administration data previously unavailable to researchers. We have incorporated institutional features which are unique in Singapore. These include the high ownership of HDB housing, the government's housing grant schemes and the CPF DC system which allows utilization of savings from CPF OA to finance housing. Housing policies and retirement policies are closely intertwined in Singapore and trade-offs are present.
Our findings strongly suggest that whether a DC system, which allows utilization of retirement savings for housing, can ensure retirement adequacy crucially depends on the earnings profile of workers, individual housing consumption choices, and CPF policy rules. Additionally, replacement rates vary according to the definition of retirement incomes, pre-retirement income, and measurements of imputed rents. Using CPF annuity real payouts as a proportion of average lifetime earnings yield replacement rates that are below the typical adequacy threshold. However, using payouts at the first year of retirement relative to average lifetime net earnings will generate replacement rates that are comparable with many OECD countries.
Financing housing through CPF monies has enabled Singapore to achieve high homeownership. As homeowners, retirees in Singapore need not spend their retirement incomes on rents. Because of the prevalence of owner-occupied housing and the use of CPF monies for housing, it is apt to use replacement rates that include imputed rent. We have explored alternative ways to incorporate imputed rents into the replacement rate calculations and find that both methods yield consistent results. Including net imputed rents to the replacement rate calculation will augment the rates by 10.1–12.6 percentage points for males under the Standard Plan. The replacement rates increase by 12.2–14.8 percentage points for females.
We also consider other deviations from the baseline model in terms of utilization of CPF monies for housing. These include assuming single income earners and varying housing consumptions. These analyses highlight the trade-offs between pre-retirement withdrawals for housing finance and retirement adequacy. Consuming a flat type that is one size larger than in the base case entails using more CPF savings and results in lower replacement rates. The fall in the replacement rate is more pronounced for lower income than higher income percentiles. With higher mortgage payments, almost all if not all savings in the OA will be used for housing and less will be saved for retirement. The CPF accumulations are in the SA which cannot be withdrawn before retirement. The median worker can expect to replace only 35% of his average lifetime income if there is accumulation is in the SA only and no accumulation in the OA. The sensitivity analysis on single income and dual income earners demonstrates that single income families should exercise prudence in their choice of flat type as it affects retirement adequacy.
This paper also yields insights on evaluating pension system using the income replacement rates for countries with high homeownership. The ability to use retirement savings to finance housing in Singapore has reduced the burden of acquiring a housing asset and made Singapore a home-owning nation. However, many developed countries also witness the rise in homeownership with age. Focusing replacement rate calculation on pensions or annuity incomes may detract from the full retirement adequacy picture, as homeowners do not pay rent and hence need less cash. While factoring imputed rents into income increases disposable income, it is also important to quantify net imputed rents before and after retirement. Net imputed rents depend on whether homebuyers are still repaying a mortgage during the work cycle or are outright owner upon retirement.