
1. Introduction
The unsteady aerodynamics of airfoils and their wakes have received considerable attention due to the relevance to gust loads on aircraft and the aeroelasticity of aircraft wings and rotorcraft blades (Theodorsen Reference Theodorsen1935; Garrick Reference Garrick1936; von Kármán & Sears Reference Von Karman and Sears1938; Sears Reference Sears1941; McCroskey Reference Mccroskey1982; Ekaterinaris & Platzer Reference Ekaterinaris and Platzer1998), buffeting, propulsion of swimming animals (Smits Reference Smits2019) and flapping-wing propulsion of micro-air vehicles (Shyy et al. Reference Shyy, Aono, Chimakurthi, Trizila, Kang, Cesnik and Liu2010). The unsteady forces on an unsteady airfoil are affected by the vorticity shed from the airfoil and the resulting unsteady wake. Early unsteady aerodynamics models were developed in the 1930s based on the attached potential flow assumption (Theodorsen Reference Theodorsen1935; Garrick Reference Garrick1936; von Kármán & Sears Reference Von Karman and Sears1938; Sears Reference Sears1941). An important aspect of the assumptions is the two-dimensionality of the vortex sheet shed from the trailing edge to satisfy the unsteady Kutta condition. However, even if flow separation is fixed at a sharp trailing edge, it is unlikely that the vorticity shed will remain two-dimensional.
While combined pitching and plunging (heaving) motions have more kinematic parameters, resulting in complex vortex–vortex and vortex–wing interactions, pure plunging motion exhibits all the essential features of oscillating airfoils: vorticity shedding from the trailing edge, roll-up and formation of concentrated vortices, their convection downstream as well as flow separation at the leading edge and formation of leading-edge vortices for sufficiently high frequency and amplitude of the motion. Pure plunging motion is a simpler, yet fundamental, model of thrust generation of oscillating airfoils while the geometric angle of attack remains constant.
1.1. Main parameters
There are two main parameters for plunging airfoils: the Strouhal number and reduced frequency. The Strouhal number based on amplitude is
 \begin{equation}St = fA/{U_\infty },\end{equation}
where A = 2a is the peak-to-peak amplitude of the trailing edge, a is the amplitude of the trailing edge, f is the oscillation frequency and U∞ is the free-stream velocity. The Strouhal number is the ratio of the maximum plunge velocity to the free-stream velocity. It is also related to the maximum effective angle of attack
 \begin{equation}{\alpha _{eff,max}} = {\tan ^{ - 1}}\frac{{{\rm \pi} fA}}{{{U_\infty }}} = {\tan ^{ - 1}}{\rm \pi} St,\end{equation}
if the mean angle of attack is zero. As the maximum effective angle of attack increases with increasing Strouhal number St and exceeds a critical value, leading-edge separation and vortex formation may occur. The second parameter, the reduced frequency, is
 \begin{equation}k = {\rm \pi}fc/{U_\infty },\end{equation}
where c is the chord length of the airfoil. The reduced frequency k can be considered as the ratio of the time scale of the motion to the convective time scale. Convective motion appears in the wake as the vorticity sheds from the trailing edge (and also from the leading edge if there is flow separation) and moves downstream while affecting the flow around the airfoil.
It is widely believed that the Strouhal number St is the main parameter that characterises the unsteady wake for the pure plunging motion (Gursul & Cleavers Reference Gursul and Cleavers2019), although it is also known that two cases with the same St but different k do not necessarily produce similar flow fields. Both parameters (St, k) appear in the small-amplitude potential flow theory (Garrick Reference Garrick1936). According to Garrick (Reference Garrick1936), the time-averaged thrust coefficient varies as St 2, although there is a significant effect of the reduced frequency k (which is often overlooked)
 \begin{equation}{C_T} = {\pi ^3}S{t^2}({F^2} + {G^2}),\end{equation}
where F(k) and G(k) are the real and imaginary parts of the Theodorsen function. The term  $({F^2} + {G^2}) = 1$ at k = 0,
 $({F^2} + {G^2}) \approx 0.3$ at k = 1 and tends to 0.25 for larger k. Therefore, for k ≤ 1, it is not clear which parameter, if any, may be dominant in the experiments, not only for the time-averaged quantities, but also for the unsteady characteristics, including the coherence (two-dimensionality) of the oscillating wake.
1.2. Streamwise flow
At low frequencies, a vortex sheet is shed from the trailing edge with alternating signs (see for example, Cleaver et al. Reference Cleaver, Calderon, Wang and Gursul2013). One can view this as a ‘time-dependent mixing layer’ that starts from the oscillating trailing edge and has a periodically varying velocity differential. A wave-like motion of the wake in the mid-span plane of a high-aspect-ratio wing was also reported by Turhan, Wang & Gursul (Reference Turhan, Wang and Gursul2020). The amplitude of the vortex sheet in the near wake (at x/c = 5) increases and can be as high as one order of magnitude larger than the amplitude of the trailing edge. The coherence of oscillating wakes at low frequencies has not received much attention so far. At higher frequencies, the vortex sheet rolls into the concentrated vortices, and the cross-stream distance between the vortices is roughly the same order of magnitude as the peak-to-peak amplitude of the trailing edge. Intuitively, one may expect improved two-dimensionality and increased coherence of oscillating wakes with increasing frequency. This is based on the observations of the faster roll-up of vorticity into concentrated vortices in experiments and simulations. On the other hand, the possibility of finding spanwise instabilities also increases once the vortices are fully developed.
Various physical mechanisms may cause three-dimensionality of the oscillating wakes. Separated shear layers, shed from leading edge or trailing edge, may exhibit transition. High-fidelity simulations revealed that early signs of the onset of the three-dimensionality of leading-edge vortices can be found at a chord Reynolds number of Re = 10 000 (Visbal Reference Visbal2009). Even an abrupt breakdown of the leading-edge vortex due to the onset of small-scale spanwise instabilities is possible at Re = 40 000. These instabilities may have some similarities to those observed in mixing layers (Bernal & Roshko Reference Bernal and Roshko1986) and wakes (Williamson Reference Williamson1996). At high frequencies concentrated vortices are fully formed quickly, and as the recent experiments on high-aspect-ratio wings suggest, spanwise waves with a wavelength of the order of the chord length may appear on the leading-edge vortices (Chiereghin et al. Reference Chiereghin, Bull, Cleaver and Gursul2020; Gao, Sherwin & Cantwell Reference Gao, Sherwin and Cantwell2020; Son, Wang & Gursul Reference Son, Wang and Gursul2020, Reference Son, Wang and Gursul2021; Son et al. Reference Son, Gao, Gursul, Sherwin, Wang and Cantwell2022).
Another physical mechanism that might affect the coherence of the oscillating wake is related to the natural wake instability, that leads to vortex shedding from the airfoil. This is well known in bluff body aerodynamics (Bearman Reference Bearman1984). When excited at the natural shedding frequency (and its harmonics or subharmonics), the wake becomes more ordered and synchronised as the vortices lock-in for oscillating cylinders. There are measurements of cross-correlation of the base pressure as a function of spanwise separation distance, but this has not been considered for the flow in the near wake. Data for the wake of oscillating airfoils are not available to the best knowledge of the authors. The only exception is the measurements of cross-correlation in the wake of an oscillating airfoil set at a post-stall angle of attack of 15° (Cleaver et al. Reference Cleaver, Wang, Gursul and Visbal2011). It was shown that the cross-correlation coefficient for a stationary airfoil at Re = 10 000 and for a spanwise separation distance of 1.3c about the mid-span, at x/c = 1, is less than 0.1, but can reach peak values 0.5 to 0.7 when oscillated at the fundamental, subharmonic and first harmonic of the natural vortex shedding in the wake for A/c = 0.05, resulting in local maxima in the lift coefficient. The vortex lock-in phenomenon in the wake of a plunging airfoil set at zero angle of attack was studied by Young & Lai (Reference Young and Lai2007). In this case, the natural vortex shedding frequency in the wake was near k ≈ 9.4 for the NACA0012 airfoil at Re = 20 000. The vortex shedding frequency at this high value of the reduced frequency k at zero angle of attack is beyond the maximum reduced frequency investigated in our experiments (k ≤ π).
As a consequence of the onset of the three-dimensionality of the flow, one may expect a streamwise decay of the vortical structures. Bohl & Koochesfahani (Reference Bohl and Koochesfahani2009) experimentally investigated the downstream development of a pitching airfoil for x/c ≤ 1.1 at a Reynolds number of Re =12 600, and suggested that the three-dimensionality of the vortices causes faster diffusion of the peak vorticity in the streamwise direction for k > 5. Even very small levels of axial velocity along the core of the spanwise vortices can contribute to the decay of the peak vorticity in the streamwise direction. In addition, the turbulent diffusion due to the small-scale motion is likely to reduce the coherence of the vortical flow in the streamwise direction, even if the flow separation at a sharp trailing edge is two-dimensional.
1.3. Spanwise length scale
In the limiting case of a stationary airfoil set at zero angle of attack, the spanwise correlation length of the near wake has not received much attention, although there is some prior knowledge for stationary bluff bodies. For the nominally two-dimensional wake of a circular cylinder, at a Reynolds number based on the diameter Red = 13 000 and in the intermediate wake region x/d = 20, Hayakawa & Hussain (Reference Hayakawa and Hussain1989) found significant three-dimensionality and estimated the spanwise scale of vortical structures around 1.8d. They concluded that the typical spanwise extent of large spanwise vortices is comparable to the local half-width of the wake. Recently, Zhang, Wang & Gursul (Reference Zhang, Wang and Gursul2022) reported the spanwise length scale to be of the order of 2 to 3 times the thickness H of the body for various D-shaped cylinder wakes in the range of x/H = 4–20 and ReH = 10 000 to 50 000. Such information for the wakes of stationary and oscillating airfoils is not available to the best knowledge of the authors.
With increasing frequency, although the two-dimensionality of the vortical flow is expected to increase, there is no prior knowledge on whether this depends on k or St, and how fast it takes place. There were early attempts to study the three-dimensionality of the flow. Buchner et al. (Reference Buchner, Buchmann, Kilany, Atkinson and Soria2012) presented some instantaneous three-dimensional flow data in a volume with a spanwise length of 0.12c. David et al. (Reference David, Jardin, Braud and Farcy2012) had a spanwise length of 0.35c of the measurement domain. However, the possibility of finding spanwise waves with larger wavelength (of the order of the chord length) exists at high frequencies. It is not clear whether the observations for high-aspect-ratio wings (Chiereghin et al. Reference Chiereghin, Bull, Cleaver and Gursul2020; Gao et al. Reference Gao, Sherwin and Cantwell2020; Son et al. Reference Son, Wang and Gursul2020, Reference Son, Wang and Gursul2021, Reference Son, Gao, Gursul, Sherwin, Wang and Cantwell2022) are related to those found by Floquet stability analysis (Sun, Deng & Shao Reference Sun, Deng and Shao2018) of the propulsive wake (hence resulting in a time-averaged jet) of a plunging airfoil set at a zero mean angle of attack at a low Reynolds number of Re = 1700. It is quite likely that the existence of spanwise instabilities will be dependent on the frequency and the amplitude of the motion. Generally, these instabilities appear at high frequencies, although it is not clear whether k or St is the determining factor.
Knowledge of the spanwise length scale could be useful not only for the understanding of the unsteady characteristics of oscillating wakes, but also for computational studies. In the 2.5-dimensional (2.5-D) simulations of airfoil flows one needs to select a minimal box size in the spanwise direction. Using a Fourier simulation in the spanwise direction requires a periodic length greater than the correlation length, although this choice is also dictated by the desire to capture the largest wavelength of interest. There are currently no experimental data for guidance in choosing the spanwise box size. Visbal (Reference Visbal2009) used a spanwise box size of 0.20c in a study of transitional flow over a plunging airfoil at Re = 10 000 to 40 000 at k = 3.93 and A/c = 0.1. Gao et al. (Reference Gao, Sherwin and Cantwell2020) and Son et al. (Reference Son, Gao, Gursul, Sherwin, Wang and Cantwell2022) used spanwise box sizes of 2.6c to 5.0c in the Reynolds number range of Re =1000 to 10 000 in the study of leading-edge vortices and wakes of a plunging airfoil at k = 2 and A/c = 0.5.
1.4. Oscillating wakes as gust generators
Wakes and vortices of oscillating airfoils are often used in wind tunnel experiments as gust generators to simulate downstream wings in gusts. Examples of this type of experimental facilities include the use of oscillating airfoils or a cascade of airfoils (Gilman & Bennett Reference Gilman and Bennett1966; Booth & Yu Reference Booth and Yu1986; Wilder & Telionis Reference Wilder and Telionis1998; Brion et al. Reference Brion, Lepage, Amosse, Soulevant, Senecat, Abart and Paillart2015; Wei, Kissing & Tropea Reference Wei, Kissing and Tropea2019a; Wei et al. Reference Wei, Kissing, Wester, Wegt, Schiffmann, Jakirlic, Holling, Peinke and Tropea2019b; Wu et al. Reference Wu, Bangga, Lutz, Kampers and Holling2020), and fixed airfoils with oscillating flaps (Bicknell & Parker Reference Bicknell and Parker1972; Jones & Moore Reference Jones and Moore1972). The two-dimensionality of the experimentally generated gusts, wakes and vortices has not been considered so far as a function of the generating parameters, such as the frequency and the amplitude of the airfoil motion. Spanwise correlation length must be important when the unsteady forces on the downstream wings are measured and interpreted. While we recognise that specific unsteady characteristics of the unsteady wakes generated by the above methods will differ, some essential features are expected to be similar. For example, one may expect that the effects of the frequency and the amplitude can be similar. Triantafyllou, Triantafyllou & Gopalkrishnan (Reference Triantafyllou, Triantafyllou and Gopalkrishnan1991) and Anderson et al. (Reference Anderson, Streitlien, Barrett and Triantafyllou1998) used a generalised Strouhal number based on the total excursion of the trailing edge of the airfoil for different airfoil motions. Triantafyllou et al. (Reference Triantafyllou, Triantafyllou and Gopalkrishnan1991) compared the mean thrust coefficient for pure plunging, pure pitching and combined pitching and plunging motions, and found very good agreement, suggesting that the Strouhal number is the dominant governing parameter. The time-averaged thrust force cannot be interpolated to the wake coherence directly, nevertheless it suggests the importance of the Strouhal number. We believe that the study of the pure plunging motion can shed some light onto the effects of the reduced frequency k and the Strouhal number St on the wake coherence. It is noted that these parameters determine whether vortices are rolled-up and also whether a reverse Kármán street is generated, and that St is a measure of the amplitude of the wake velocity fluctuations, and hence also the amplitude of the gust angle.
1.5. Objectives
In this paper we investigate the time-averaged and unsteady characteristics of the wakes of an oscillating airfoil set at zero mean angle of attack at a chord Reynolds number of Re = 20 000 by means of particle image velocimetry (PIV) measurements. The main focus is on the coherence of the oscillating wakes. We investigate the streamwise and spanwise two-point correlations and the relative energy of the dominant proper orthogonal decomposition (POD) modes, as well as the time-averaged flow, as a function of the reduced frequency k and the Strouhal number St. The maximum values of the reduced frequency and the Strouhal numbers considered were 3.14 and 0.24, respectively. The paper is organised as follows: § 2 gives an overview of the experimental set-up, the measurement method and analysis techniques. Discussion of the results is presented in § 3.1 for an overview of the effect of kinematic parameters on the instantaneous flow fields, the mean velocity and the amplitude of the cross-stream velocity fluctuations as well as an estimate of the drag/thrust coefficient. The two-point cross-correlations and the POD analysis are presented for streamwise flow in § 3.2 and for cross-flow in § 3.3, and the effects of k and St are discussed. Finally, implications of these findings on the measured unsteady lift force in wind tunnel gust generators are discussed in § 3.4.
2. Methods and techniques
2.1. Experimental set-up
The experiments were carried out in a closed-loop, free surface water tunnel (Eidetics model 1520) at the University of Bath. The maximum free-stream velocity is 0.5 m s−1, with a turbulent intensity of around 0.5 % (Heathcote Reference Heathcote2006). The main test section of the facility is 381 mm wide, 508 mm deep and 1520 mm long, and tempered glass is used in the test section for the camera and laser access. Figure 1 shows the side and front views of the test section, the test rig and the schematic of the PIV set-up. The airfoil is vertically mounted in the working section. It has a NACA 0012 airfoil profile, an aspect ratio of 5 and a chord length of c = 62.7 mm. The coordinate system is located at the root of the wing at the trailing edge, as sketched in figure 1. The wing was manufactured by selective laser sintering using Polyamide 2200, with a smooth finish and subsequently spray painted matte black to eliminate laser reflection during velocity measurements. Nominally two-dimensional airfoil geometry is simulated by using endplates at both ends, with 2 mm clearance, which extend 2c upstream and 10c downstream of the wing (Chiereghin, Cleaver & Gursul Reference Chiereghin, Cleaver and Gursul2019).
Schematic of the experimental set-up and PIV measurements.

The test rig consisted of a fixed platform, which is placed at the top of the water tunnel test section. The wing was connected to the platform through a rotation stage that allowed the wing to rotate, thus adjusting the desired geometric angle of attack with an accuracy of ±0.2°. For this article, the mean angle of attack was set to zero. The plunging motion, provided by a Zaber LSQ150B-T3 translation stage, was powered by a stepping motor with an X-MCB1 controller. The plunging motion h(t) of the airfoil displacement in the cross-stream y-direction can be expressed in the form of
 \begin{equation}h(t) = \frac{A}{2}\textrm{cos}(2{\rm \pi} ft\textrm{),}\end{equation}
which can be reproduced with an accuracy of 2 %. Here, the displacement h(t) is measured from the mean location of the airfoil (y = 0).
2.2. PIV measurements
The PIV measurements were conducted at Re = 20 000, and geometric angle of attack α = 0°. Experiments were carried out at various plunging reduced frequencies (up to k = 3.14) and normalised peak-to-peak amplitudes A/c (up to 1), as shown in figure 2. In this amplitude versus frequency plot, maximum values (at fixed amplitude and frequency) are dictated by the limits of the stepping motor, which roughly correspond to a constant value of maximum plunge velocity. The data in figure 2 result in a maximum value of the Strouhal number St = 0.24 in our experiments. As will be shown, this range of k and St in our experiments captures the essential features of different flow regimes.
Map of normalised plunge amplitude and reduced frequency values tested.

In this research we performed velocity measurements in two planes: the spanwise plane located at z/c = 2.5 to capture the streamwise flow, and the streamwise plane located at x/c = 4.03 to capture the cross-flow. Two laser sheets illuminating the two planes are illustrated in figure 1. The cross-flow PIV measurements were performed in a region which is restricted to between z/c = 1 and 4, and has a width of 60 % of the span of the airfoil. The measurement region is 1c away from both endwalls in order to avoid the effect of the wall on the vortical flow. For a similar chord length, gap and Reynolds number, the measurements of Calderon et al. (Reference Calderon, Cleaver, Gursul and Wang2014) in the same facility suggest that the effect of the wall boundary layer is limited to a region not wider than 0.15c at x/c = 1, which can be taken as a guideline for our measurements at x/c = 4.03.
The PIV system is a commercially available TSI system that consists of a synchroniser (TSI model 610036), a double-pulsed laser (Nd: YAG 50 mJ) and an 8 MP camera. The data sampling rate was chosen as 3.75 Hz (which was not a subharmonic or higher harmonic of the plunging frequency) for continuous sampling of 2000 sequential instantaneous flow fields. The time interval between two laser pulses was Δt = 0.8 ms. The water was seeded with commercially available hollow glass spheres (8–12 μm in diameter). The images were processed via algorithms provided by TSI's software package INSIGHT 4GTM using fast Fourier transform. The image processing was carried out with an interrogation window size of 32 by 32 pixels with 25 % overlap, resulting in a spatial resolution of 2.5 %c. The time-averaged data are derived from the 2000 pairs of images for each case. The primary peak ratio (PPR) algorithm for PIV uncertainty has been implemented and calibrated within INSIGHT 4GTM for each set of PIV processing parameters. The instantaneous measurement uncertainty was obtained using the PPR method with expanded uncertainty within a 95 % confidence level (Charonko & Vlachos Reference Charonko and Vlachos2013). The mean value of uncertainty was approximately 2 % of the free-stream velocity. We also estimated the uncertainty of the momentum thickness as 3 % and thrust coefficient as 8 %.
2.3. Proper orthogonal decomposition
The POD method has been extensively used for unsteady flows. The method extracts the significant properties that may otherwise be hidden within flow structures and instantaneous snapshots. In experimental studies, this method helps to interpret PIV data and reveal the most energetic modes. POD is used to decompose the coherent large-scale flow unsteadiness as a spatial vector function and extract the spatially most energetic eigenfunctions of the flow. The corresponding eigenvector represents the basis function or mode shape (Sirovich Reference Sirovich1987; Berkooz, Holmes & Lumley Reference Berkooz, Holmes and Lumley1993). For example, the POD method decomposes the cross-stream velocity component as shown below
 \begin{align}v(x,y,\,t) = V(x,y) + v^{\prime}(x,y,t) = V(x,y) + {b_1}(t)PO{D_1}(x,y) + {b_2}(t)PO{D_2}(x,y) + \cdots ,\end{align}
where V is the mean cross-stream velocity component, and  $v^{\prime}$ is the fluctuating cross-stream velocity component of the velocity field. Here POD and b are modes and corresponding mode coefficients. For oscillating wakes of plunging airfoils, most of the energy in the flow can be captured in the first few modes. In this paper, the analysis was performed using the commercial software TSI GRAD-POD TOOLBOX, which employs the spatial-temporal data analysis technique proposed by Heiland (Reference Heiland1992).
2.4. Two-point cross-correlations
The two-point correlations are used to determine the length scales associated with the coherent flows. The two-point correlation is defined (Bendat & Piersol Reference Bendat and Piersol1986) below for the cross-stream velocity component
 \begin{equation}{C_{vv}} = \frac{{\sum\limits_{i = 1}^n {({v_A}(t) - {V_A})({v_B}(t) - {V_B})} }}{{\sqrt {\sum\limits_{i = 1}^n {{{({v_A}(t) - {V_A})}^2}} }\, \sqrt {\sum\limits_{i = 1}^n {{{({v_B}(t) - {V_B})}^2}} } }},\end{equation}
where vA is the cross-stream velocity component at the reference point A, and vB is the cross-stream velocity component at the spatial location B in the measured velocity field. In this paper, we calculated the two-point correlations of the cross-stream component in the x–y plane at the mid-span of the airfoil (z/c = 2.5) and in the y–z (cross-flow) plane at x/c = 4.03. In the x–y plane the reference point was taken as (x/c = 0.5, y/c = 0) and in the y–z plane the reference point was taken as (z/c = 2.5, y/c = 0).
3. Results
3.1. Overview of streamwise flow
We start with the effects of the oscillation frequency and amplitude of the plunging motion on the main features of the instantaneous flow, followed by the summary of the effects of the main dimensionless parameters k and St on the time-averaged quantities, including the mean streamwise velocity and the amplitude of the cross-stream velocity fluctuations.
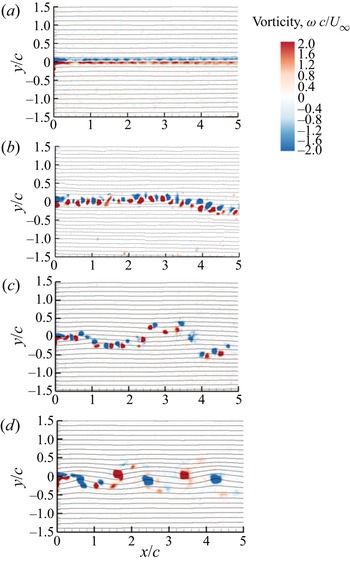
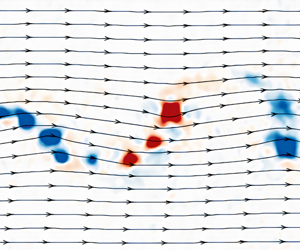
Figure 3 presents the instantaneous vorticity together with streamlines in the wake for A/c = 0.1 and varying frequency, including the case of the stationary airfoil (k = 0). For the stationary airfoil, vorticity sheets of opposite sign shed from the airfoil roll up into small concentrated vortices in the wake. The wavelength of the vorticity concentrations can be estimated from this instantaneous image as approximately 0.3c. A more accurate time-averaged estimate can be obtained by means of two-point correlation measurements, as will be presented in the next section. The approximate wavelength of 0.3c for the wake of the stationary airfoil can also be used to obtain an estimate of the frequency of the wake vortex shedding (the present PIV measurements are not time resolved). If the convection velocity is assumed to be equal to the free-stream velocity in the wake, one finds the reduced frequency of vortex shedding as k ≈ 10, which is comparable to the prediction of the two-dimensional unsteady laminar flow simulations of Young & Lai (Reference Young and Lai2007) as k ≈ 9.4 for the same airfoil and Reynolds number. As will be discussed later, the spanwise length scale for this case drops to around L ≈ 0.16c at x/c = 4.03. Considering the lack of two-dimensionality in the experiments, the success of two-dimensional simulations is remarkable. As the plunge oscillation frequency is increased in figure 3, small vorticity concentrations are still visible while the large-scale travelling-wave motion of the wake reaches a peak-to-peak amplitude that is one order of magnitude larger than that of the airfoil motion (A/c = 0.1) at k = 1.26 (St = 0.04). With further increase in the reduced frequency to k = 1.88 (St = 0.06), a reverse Kármán vortex street is observed, which is generally associated with thrust generating wakes. (It is known that the change in the vortex configuration does not exactly coincide with the change from drag to thrust; Bohl & Koochesfahani Reference Bohl and Koochesfahani2009.)
Instantaneous vorticity contours at a fixed value of A/c = 0.1 for (a) k = 0, (b) k = 0.63, St = 0.02, (c) k = 1.26 St = 0.04 and (d) k = 1.88, St = 0.06.

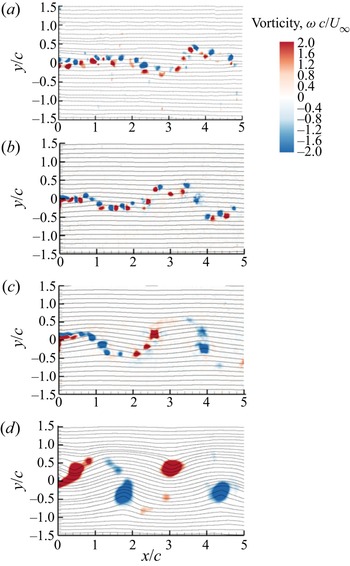
Figure 4 shows the instantaneous vorticity together with streamlines in the wake for a fixed reduced frequency k = 1.26 and varying amplitude A/c (hence the Strouhal number based on amplitude St as well). With increasing amplitude A/c, one can see the increasing amplitude of the large-scale travelling-wave motion of the wake, but not as fast as it increases with frequency. Therefore, there is a suggestion of k being a more important parameter as far as the amplitude of the wake shear layer is concerned. This is also reinforced by the comparison of the two cases with the same Strouhal number St: (k = 0.63, St = 0.02) in figure 3 and (k = 1.26, St = 0.02) in figure 4. For the largest amplitude shown in figure 4, once again there is a thrust-producing wake with a relatively large vertical distance between the two rows.
Instantaneous vorticity contours at a fixed value of k = 1.26 for (a) A/c = 0.05, St = 0.02, (b) A/c = 0.1, St = 0.04, (c) A/c = 0.2, St = 0.08 and (d) A/c = 0.4, St = 0.16.

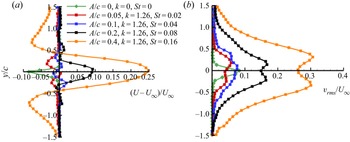
The variations of the normalised mean stream velocity defect or excess and the normalised root-mean-square (r.m.s.) of the cross-stream velocity fluctuations at x/c = 4.03 are shown in figures 5(a) and 5(b), which correspond to the cases shown in figure 4 together with the stationary airfoil case. The wake-like mean velocity profile seen for the stationary airfoil becomes jet like only for St ≥ 0.08, whereas the mean velocity profile is not simply jet like or wake like for lower values of the Strouhal number. The corresponding variation of the r.m.s. of the cross-stream velocity profiles in figure 5(b) reveals that the single peak of the stationary airfoil develops into double peaks located at approximate cross-stream coordinates of the row of the vortices in figure 4 for the largest plunge amplitude.
Variation of (a) time-averaged streamwise velocity deficit/excess, (b) r.m.s. of cross-stream velocity fluctuations of the stationary and oscillating airfoil for the same reduced frequency (k = 1.26) and various amplitudes; x/c = 4.03.

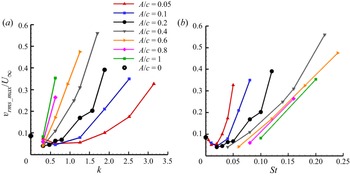
The normalised mean streamwise velocity at the wake centreline at x/c = 4.03 is shown for all cases as a function of the reduced frequency k in figure 6(a) and the Strouhal number St in figure 6(b). Whereas the reduced frequency k does not reveal any collapse of the data, the mean centreline velocity generally increases with increasing k and A/c. In contrast, there is a trend of the data to collapse with St, except for higher frequencies at each fixed amplitude A/c. The corresponding variation of the normalised r.m.s. velocity of the cross-stream velocity component is shown as a function of the reduced frequency k in figure 7(a) and the Strouhal number St in figure 7(b). It increases almost linearly with increasing k for lower values of k. When compared with the mean velocity at centreline in figure 6, the maximum r.m.s. velocity fluctuations exhibit similar trends with k and St. Again, a slightly better collapse with St for lower values of k is evident in figure 7(b). Clearly, no single parameter is sufficient to provide a good collapse in figures 6(b) and 7(b) as both St and k are the main parameters. However, there is clearly better correlation with St. This is expected because the Strouhal number is an amplitude parameter (the ratio of the maximum plunge velocity to the free-stream velocity).
The mean streamwise velocity at the centreline (x/c = 4.03 and y/c = 0) for all cases as a function of (a) reduced frequency, (b) Strouhal number.

The maximum r.m.s. cross-stream velocity fluctuation ( $v_{rms}$) at x/c = 4.03 for all cases as a function of (a) reduced frequency, (b) Strouhal number.

The variation of the momentum thickness,
 \begin{equation}\theta = \int_{ - \infty }^\infty {\frac{U}{{{U_\infty }}}\left( {\frac{U}{{{U_\infty }}} - 1} \right)\,\textrm{d}y} ,\end{equation}
normalised by the chord length at x/c = 4.03 is shown as a function of the reduced frequency k in figure 8(a) and the Strouhal number St in figure 8(b). Interestingly, the collapse of the data with St is very good for the whole range of the data. It is interesting that an integral quantity exhibits a clear collapse with respect to St, while the localised quantities in figures 6 and 7 do not collapse as clearly. A rough approximation for the thrust coefficient can be obtained as
 \begin{equation}{C_T} = \frac{{2\theta }}{c},\end{equation}
(see Squire & Young Reference Squire and Young1937, for example). It was shown that estimated thrust coefficients based on the mean velocity can be erroneous in highly unsteady wakes of oscillating airfoils (Bohl & Koochesfahani Reference Bohl and Koochesfahani2009). It was found that the r.m.s. of the velocity fluctuations in the streamwise direction  ${u_{rms}}$ and in the cross-stream direction
 ${v_{rms}}$ can make a significant contribution to the time-averaged momentum coefficient. Bohl & Koochesfahani (Reference Bohl and Koochesfahani2009) also took into account the downstream mean velocity at the border of the control volume, which may be slightly different from the free-stream velocity. The corrected thrust coefficient using the full formulation of Bohl & Koochesfahani (Reference Bohl and Koochesfahani2009) is compared with the direct measurements of the thrust force with force balances (Heathcote, Wang & Gursul Reference Heathcote, Wang and Gursul2008; Cleaver et al. Reference Cleaver, Calderon, Wang and Gursul2013) in figure 9(a).
Variation of momentum thickness for all cases as a function of (a) reduced frequency, (b) Strouhal number.

Variation of (a) estimated thrust coefficient and comparison with the results of direct force measurements from the literature; (b)  $({C_T} - {C_{T0}})/({F^2} + {G^2})$ as a function of Strouhal number.

For the stationary NACA 0012 airfoil at this Reynolds number, close agreement was found between the estimated thrust (drag) coefficient (CT 0 = −0.027) and the values reported by Heathcote et al. (Reference Heathcote, Wang and Gursul2008) (CT 0 = −0.028) and Cleaver et al. (Reference Cleaver, Calderon, Wang and Gursul2013) (CT 0 = −0.029) using direct force measurements, and Koochesfahani (Reference Koochesfahani1989) (CT 0 = −0.027) using the momentum equation. At this Reynolds number, the drag force switches to a thrust force at approximately St ≈ 0.05. Although the agreement between the estimated and directly measured thrusts is reasonably good, there are still deviations for some data points, which are usually those with larger k values at each amplitude A/c. This raises the possibility of an increasing influence of k with increasing reduced frequency. As discussed in the Introduction (§ 1.1), Garrick's theoretical prediction already points out a decrease of more than 70 % at high reduced frequencies (k ≥ 1) compared with the value at k = 0. In order to separate the effects of reduced frequency and also to be able to make a comparison with the Garrick's inviscid theory (Reference Garrick1936), his prediction of the thrust coefficient (see § 1.1) is written here as
 \begin{equation}\frac{{{C_T} - {C_{T0}}}}{{F{{(k)}^2} + G{{(k)}^2}}} = {\pi ^3}S{t^2},\end{equation}
The quantity on the left-hand side was calculated based on the estimated thrust coefficient from our experiments and plotted in figure 9(b). For each experimental data point, there are corresponding values of k and St based on kinematic parameters such as frequency and plunge amplitude. In figure 9(b), for each data point, the corresponding values of the functions F(k) and G(k) were calculated while the thrust coefficient term  $({C_T} - {C_{T0}})$ was estimated based on the full formulation of Bohl & Koochesfahani (Reference Bohl and Koochesfahani2009) to yield
 $({C_T} - {C_{T0}})/({F^2} + {G^2})$. The solid black curve corresponds to the Garrick theory. It is seen that the experimental data still have as much scatter as figure 9(a). It is also noted that, although the agreement with the Garrick theory is not as good, a parabolic curve fit, shown with a red solid line,
 \begin{equation}\frac{{{C_T} - {C_{T0}}}}{{F{{(k)}^2} + G{{(k)}^2}}} = 23S{t^2},\end{equation}
provides a better approximation to our data and the others. The coefficient of the parabolic curve fit is approximately 74 % of  ${\pi ^3}$ of the Garrick theory.
The change of the constant in front of the parabola St 2 in the above equation may also be interpreted as a change of the reduced frequency effect of  ${\pi ^3}({F^2} + {G^2})$ to
 $23({F^2} + {G^2})$. The reduced frequency dependence remains with the same function shape, but multiplied by a different constant. As the Garrick prediction assumes that the wake remains planar, the experimentally found coefficient can be considered as a correction for the roll-up of vortex sheets.
3.2. Coherence of streamwise flow
The two-point cross-correlations and the POD modes presented in this section capture the wave-like motion in the wake and the wavelength, and also reveal the decay of the amplitude of the cross-correlations. In addition, the POD modes show the dominant structures and confirm that St is the main parameter.
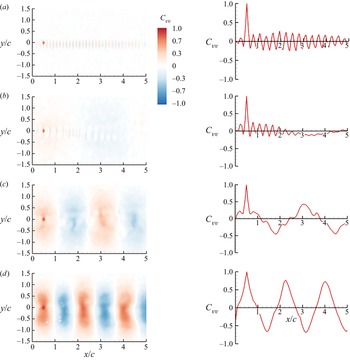
Figure 10 shows the contours of the cross-correlation coefficient of the cross-stream velocity fluctuations measured at two points. The reference point is taken at (x/c = 0.50, y/c = 0) for all cases presented here. The cross-correlation of the cross-stream velocity fluctuations between the reference point and any arbitrary point for all cases are shown in the left column. In the right column, the variation of the cross-correlation coefficient Cvv (x/c, y/c = 0) is shown for clarity. The cases shown in this figure correspond to the instantaneous vorticity fields shown in figure 3. For the stationary airfoil, the wake instability and the vortex shedding from the airfoil can be clearly identified. An average wavelength of 0.29c was found in this case. For the smallest plunge frequency (k = 0.63, St = 0.02) shown in figure 10(b), the natural vortex shedding instability can still be observed in the near wake, but it decays further downstream. With further increase in the frequency shown in figures 10(c) and 10(d), the peak cross-correlation coefficient increases, while the wavelength of the vortical motion can be easily calculated from the cross-correlation coefficient contours. For k > 0.70, the mean convection velocity is within Uc/U∞ = 1.0 to 1.1, increasing with increasing St (not shown here).
Contours of cross-correlation of the cross-stream velocity component Cvv (left column); its variation in the streamwise distance at y/c = 0 (right column) for A/c = 0.1 and (a) stationary airfoil, (b) k = 0.63, St = 0.02, (c) k = 1.26, St = 0.04 and (d) k = 1.88, St = 0.06.

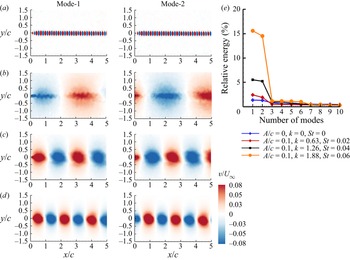
Figures 11(a)–11(d) present the first two dominant POD modes of the cross-stream velocity component for the corresponding cases. In each case the first two modes have approximately the same percentage of the total energy, and contain much larger energy than the rest of the modes, as shown in figure 11(e). These two modes characterise the travelling wave in the wake, corresponding to the fundamental frequency, and therefore we call them fundamental ‘wake modes’. The second mode is shifted quarter-wavelength with respect to the first mode. For the two largest reduced frequency cases shown in figure 11, the main wake modes appear roughly circular with decreasing wavelength. It is also seen in figure 11(e) that the relative energy of the first two modes increases with increasing frequency (reduced frequency k and Strouhal number St) at the fixed value of A/c = 0.1.
First two POD modes of cross-stream velocity component for A/c = 0.1 and (a) stationary airfoil, (b) k = 0.63, St = 0.02, (c) k = 1.26, St = 0.04, (d) k = 1.88, St = 0.06 and (e) ratio of the energy of mode to the total energy.

Figures 12 and 13 show the contours of cross-correlation coefficients and the POD modes of the cross-stream velocity fluctuations for the cases shown in figure 4. The effects of increasing amplitude A/c (and, also St) at a fixed reduced frequency k can be seen in these figures. For the smallest amplitude A/c = 0.05 in figure 12, the natural wake shedding instability just downstream of the oscillating airfoil still exists, but it decays further downstream. With increasing amplitude, the peak cross-correlation coefficient (downstream of the reference point) increases, while the wavelength remains roughly constant. The wave-like motion, including the amplitude decay, is captured in these plots. The cross-stream extent of the cross-correlation coefficient also increases with increasing amplitude.
Contours of cross-correlation of cross-stream velocity component Cvv (left column); its variation in the streamwise distance at y/c = 0 (right column) for k = 1.26 and (a) A/c = 0.05, St = 0.02, (b) A/c = 0.1, St = 0.04, (c) A/c = 0.2, St = 0.08, and (d) A/c = 0.4, St = 0.16.

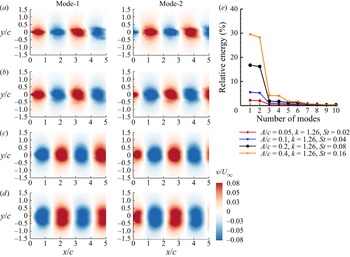
First two POD modes of cross-stream velocity component for k = 1.26 and (a) A/c = 0.05, St = 0.02, (b) A/c = 0.1, St = 0.04, (c) A/c = 0.2, St = 0.08, (d) A/c = 0.4, St = 0.16 and (e) ratio of the energy of mode to the total energy.

In figures 10 and 12, for Strouhal numbers up to and including the case of St = 0.04, natural vortex shedding can be detected. For St = 0.06 and higher, there is no sign of natural vortex shedding. Karniadakis & Triantafyllous (Reference Karniadakis and Triantafyllous1989) studied the response of laminar wakes behind circular cylinders at Re = 100 as periodic excitation is applied. Lock-in and non-lock-in of vortices, resulting in a periodic, quasi-periodic or chaotic flow response were observed depending on the combination of the amplitude and frequency of the forcing. The response can be qualitatively represented by a ‘resonant horn’ or ‘Arnol'd’ diagram. Young & Lai (Reference Young and Lai2007) presented a similar diagram for the wake of a NACA0012 airfoil in plunging motion at a Reynolds number Re = 20 000 using two-dimensional simulations. In both studies cited above, the key parameters are the ratio of the excitation (forcing) frequency to the natural vortex shedding frequency and the amplitude of the forcing (plunge amplitude in the case of Young & Lai Reference Young and Lai2007). In our experiments, the natural vortex shedding frequency has a reduced frequency of k ≈ 10, hence the frequency ratio is less than 0.31 for all cases. For low frequency ratios, Young & Lai (Reference Young and Lai2007) provide an approximate boundary for vortex lock-in, which we calculated as corresponding to St = 0.03 to 0.06. Given the two-dimensional nature of their simulations, it is remarkable that we also find a region of low coherence (both in the streamwise and spanwise directions) for St less than 0.05.
Figures 13(a)–13(d) presents the first two dominant POD modes of the cross-stream velocity component for the corresponding cases. Again, the first two modes, characterising the travelling main wake modes, are the most energetic modes compared with all other modes, and have approximately the same percentage of the total energy for each case (see figure 13e). With increasing amplitude A/c, the spatial structure of the modes changes from an ellipse with major axis in the streamwise direction to one with the major axis in the cross-stream direction as the cross-stream extent of the structures increases, while the wavelength remains constant. The relative energy of the first two modes increases with increasing amplitude A/c (and St) at a fixed value of reduced frequency k = 1.26.
As the first two POD modes represent the fundamental wake mode and have more energy compared with the higher modes, the sum of the energy of the first two modes (E 1 + E 2) as a fraction of the total energy ET, represents the relative contribution of the fundamental wake modes. The quantity (E 1 + E 2)/ET is shown as a function of the reduced frequency k in figure 14(a) and the Strouhal number St in figure 14(b). It is seen that the collapse of the data with St is very good. As discussed earlier, the time-averaged quantities such as the mean velocity appear to have a good correlation with St, however, the quantity (E 1 + E 2)/ET for the fluctuating field is even better correlated with St. For very small values of St, the percentage energy of the fundamental wake mode behaves like a parabola, but there is a different trend for St > 0.05. We note that the drag force switches to a thrust force at approximately St ≈ 0.05 (see figure 9a). For larger values than 0.05, the percentage energy increases with increasing St, but at a decreasing rate.
Ratio of the energy of the first two modes to the total energy as a function of (a) reduced frequency, (b) Strouhal number.

3.3. Coherence of cross-flow
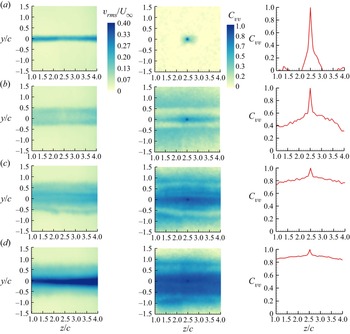
We carried out a similar analysis of the cross-correlation coefficient and the POD modes of the cross-stream component in the measurement plane at x/c = 4.03. We present the effects of the reduced frequency k and the Strouhal number St for the same kinematic parameters that were used in previous sections, and then summarise for all cases tested. Figure 15 shows the variation of the normalised r.m.s. of the cross-stream component of velocity (left column), the two-point cross-correlation coefficients of the cross-stream velocity component (middle column) and the cross-correlation coefficient Cvv (y/c = 0, z/c) along the wake centreline (right column), for the same cases shown in figure 3. If a two-dimensional vortex filament remains perfectly two-dimensional without any deformation in the spanwise direction, then the cross-correlation coefficient in the spanwise direction is unity.
Contour plots of r.m.s. cross-stream velocity fluctuations (left column); cross-correlation of cross-stream velocity component (middle column); its variation in the spanwise direction at y/c = 0 (right column) for A/c = 0.1 and (a) k = 0, (b) k = 0.63, St = 0.02, (c) k = 1.26, St = 0.04 and (d) k = 1.88, St = 0.06.

The variation of the r.m.s. cross-stream velocity in the cross-flow plane for the stationary airfoil (figure 15a) suggests that it is fairly two-dimensional in the measurement domain. However, we note that this is a time-averaged quantity. When the reduced frequency is increased to k = 0.63 (figure 15b) and k = 1.26 (figure 15c), the r.m.s. velocity  $v_{rms}$ spreads to a larger area in the cross-stream direction while the maximum value decreases compared with k = 0. For the largest reduced frequency k = 1.88 (figure 15d), the maximum value substantially increases compared with the other cases. It is noted that only this case has the reverse Kármán street configuration (see figure 3).
Equation (2.3) shows that the cross-correlation coefficient is obtained by normalising the cross-correlation with the respective amplitudes at two points. Therefore, it is not affected much by the choice of the reference point as long as the two points are not chosen well outside the wake (in free stream where there are no oscillations of the flow). In addition, the reference point in the cross-flow plane is chosen as the wake centreline where the velocity fluctuations are very large. The cross-correlation coefficients can be compared for all cases in the middle column. In all cases, the reference point is the centre of the wake (y/c = 0, z/c = 2.5) for the two-point cross-correlations. For the stationary airfoil, the cross-correlation contours are roughly circular, but confined to a very small region. In the right column, for the stationary airfoil, the cross-correlation coefficient Cvv(y/c = 0, z/c) along the wake centreline reveals that the cross-correlation rapidly decreases with distance from the reference point.
Hayakawa & Hussain (Reference Hayakawa and Hussain1989) also found no evidence of any periodicity in the spanwise cross-correlations at x/d = 20. They stated that ‘the secondary vortices observed by Wei & Smith in the vicinity of the cylinder could not be directly related to apparent substructures recognised by the present measurement [integral length scale based on the spanwise correlations]’. The evidence of the bluff-body wake instabilities are all limited to very near wake. For example, Wei & Smith (Reference Wei and Smith1986) visualised the secondary vortices at a distance less than one diameter; Lin, Vorobieff & Rockwell (Reference Lin, Vorobieff and Rockwell1996) measured the streamwise vorticity concentrations at a distance of one diameter and found spatial periodicity in the spanwise cross-correlation. Our cross-flow plane of the measurements is at x/c = 4.03, which corresponds to approximately 34 times the thickness of the airfoil (and 269 times the local momentum thickness) at a chord Reynolds number of 20 000.
Using the information shown in figure 15, one can obtain an estimate of the spanwise length scale L defined as
 \begin{equation}L/c = \int_{z/c = 1}^{z/c = 4} {{C_{vv}}\left( {\frac{y}{c} = 0,\frac{z}{c}} \right)\,\textrm{d}\left( {\frac{z}{c}} \right)} ,\end{equation}
For the stationary airfoil, we found L/c ≈ 0.16, which is of the order of the airfoil thickness and in agreement with measurements in the near wake of bluff bodies discussed in § 1.3. Hayakawa & Hussain (Reference Hayakawa and Hussain1989) reported a spanwise length scale based on the cross-correlation L ≈ 1.8d, which is comparable to our finding of L = 0.16c (or 1.33 times the thickness of the airfoil). With increasing reduced frequency in figure 15, the cross-correlation of the cross-stream velocity fluctuations improve substantially in the cross-flow plane (middle column). The cross-correlation coefficient Cvv (y/c = 0, z/c) in the spanwise direction presented in the right column reveals that the cross-correlation quickly decreases to a background level, which is not zero and increases with increasing reduced frequency. This is qualitatively similar to the findings of Bearman (Reference Bearman1984). Figure 7 in Bearman (Reference Bearman1984) shows that even the cross-correlation of the surface pressure fluctuations does not exhibit any periodicity in the spanwise direction. The correlation levels increase with oscillation frequency, and reach a maximum when the natural vortex shedding frequency is approached. This suggests that the wake instability (vortex shedding) is dominant compared with any secondary instabilities. We note that, for the cases of k ≠ 0, the definition of the spanwise length scale given above is not as meaningful. For these cases, we will define the average cross-correlation in the measurement domain and discuss later.
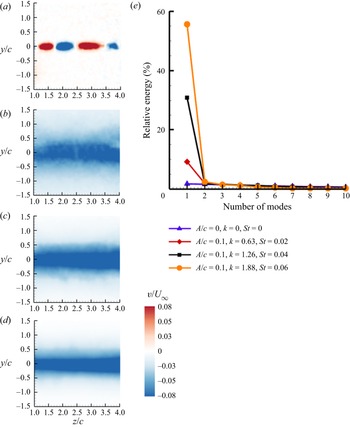
Figures 16(a)–16(d) present the first dominant POD mode of the cross-stream velocity component in the cross-flow plane for the same cases shown in figure 15. The first mode has the most energy compared with all other higher modes, as revealed in figure 16(e). Only for k = 0 can the first mode be interpreted as a spanwise standing wave with a wavelength of half of the measurement width. However, the energy of this mode is an extremely small fraction of the total energy. For all k ≠ 0 cases, the first POD mode can be described as a ‘flapping mode’, which can reach nearly 60 % of the total energy at k = 1.88.
First POD mode of cross-stream velocity component for A/c = 0.1 and (a) k = 0, (b) k = 0.63, St = 0.02, (c) k = 1.26, St = 0.04, (d) k = 1.88, St = 0.06 and (e) ratio of the energy of mode to the total energy.

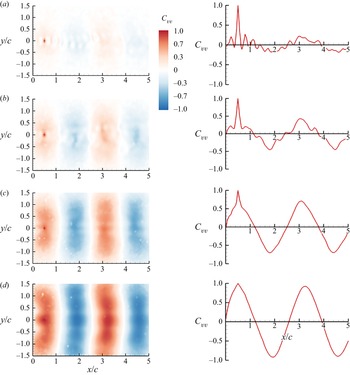
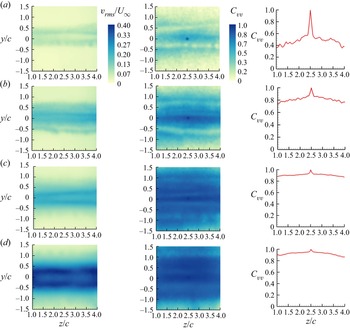
In order to present the effects of amplitude A/c at a fixed reduced frequency k = 1.26, figure 17 shows the variation of the normalised r.m.s. of the cross-stream component of velocity (left column), the two-point cross-correlation coefficients of the cross-stream velocity component (middle column) and the cross-correlation coefficient Cvv(y/c = 0, z/c) as a function of spanwise distance (right column), for the same cases presented in figure 4. The r.m.s. cross-stream velocity is approximately uniform in the spanwise direction, and exhibits well defined double peaks with increasing amplitude A/c, and with increasing peak values.
Contour plots of r.m.s. cross-stream velocity fluctuations (left column); cross-correlation of cross-stream velocity component (middle column); its variation in the spanwise direction at y/c = 0 (right column) for k = 1.26 and (a) A/c = 0.05, St = 0.02, (b) A/c = 0.1, St = 0.04, (c) A/c = 0.2, St = 0.08 and (d) A/c = 0.4, St = 0.16.

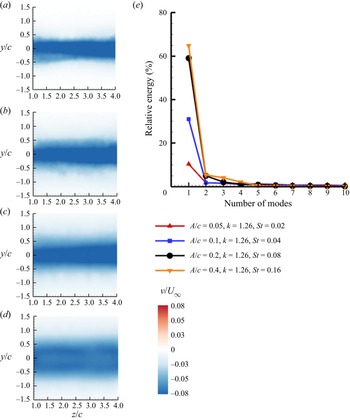
The cross-correlation coefficient shown in the middle column of figure 17 reveals that the values away from the reference point increase with increasing amplitude A/c, and also spread to a larger area in the cross-stream direction. The variation of the spanwise cross-correlation shown in the right column reveals that the background cross-correlation at one chord length away from the reference point increases in value from approximately 0.4 to approximately 0.9 with increasing amplitude A/c. The increasing cross-correlation with increasing amplitude A/c is consistent with the POD analysis shown in figure 18. In all cases, the first mode is the only dominant mode. The percentage energy of the ‘flapping mode’ increases while its cross-stream extent grows with increasing amplitude A/c. For the largest amplitude, the single flapping mode has around 65 % of the total energy of the oscillating wake.
First POD mode of cross-stream velocity component for k = 1.26 and (a) A/c = 0.05, St = 0.02, (b) A/c = 0.1, St = 0.04, (c) A/c = 0.2, St = 0.08 and (d) A/c = 0.4, St = 0.16 and (e) ratio of the energy of mode to the total energy.

As the flapping mode has most of the energy of the oscillating wake in the cross-flow plane, we plot the ratio of the first mode energy to the total energy, E 1/ET, as a function of the reduced frequency k in figure 19(a) and the Strouhal number St in figure 19(b) for all cases tested. The collapse of the data for the cross-flow with St is even better than that displayed in figure 14(b) for the streamwise flow. There are also similar regimes for small St in drag-producing flows, in which the energy percentage of the first mode behaves like a parabola, and for large St in the thrust-producing flows, in which it behaves like an exponential curve with negative exponent. The border between the two regions, which is around St ≈ 0.05, corresponds to the net zero force for the oscillating wake.
Ratio of the energy of the first mode to the total energy as a function of (a) reduced frequency, (b) Strouhal number.

Previously, we discussed the spanwise length scale using the integral of the cross-correlation coefficient in the spanwise direction for the stationary airfoil. This definition, if applied to the other cases (k ≠ 0), would be dependent on the width of the measurement domain. (For example, L = 3c for the perfectly correlated hypothetical case as the width of the measurement domain is 3c.) Instead, we define the average cross-correlation over the total width of 3c as
 \begin{equation}{C_{vv,ave}} = \frac{1}{3}\int_{z/c = 1}^{z/c = 4} {{C_{vv}}\left( {\frac{y}{c} = 0,\frac{z}{c}} \right)\,\textrm{d}\left( {\frac{z}{c}} \right)} .\end{equation}
The variation of the average cross-correlation coefficient in the measurement domain is shown as a function of the reduced frequency k in figure 20(a) and the Strouhal number St in figure 20(b). Again, we see a very good correlation with the Strouhal number St, which may be expected based on the good correlation with the percentage of energy of the dominant POD mode shown in figure 19(b) previously. For the spanwise-averaged cross-correlation coefficient shown in figure 20(b), we identify two regions: for small St, there is a rapid increase with St, which is similar to a steep parabola (similar to figures 14b and 19b), but can be approximated as a linear curve
 \begin{equation}{C_{vv,ave}} = 20\, St.\end{equation}
Spanwise-averaged cross-correlation at y/c = 0 as a function of (a) reduced frequency and (b) Strouhal number. Dashed lines indicate curve fits for small and large Strouhal numbers.

In the second region, for larger St, the spanwise-averaged cross-correlation coefficient is roughly constant
 \begin{equation}{C_{vv,ave}} \approx 0.92.\end{equation}
We note that, if there were no small-scale turbulence and the flow were purely two-dimensional, the spanwise-averaged cross-correlation coefficient would be unity. The case of perfect cross-correlation in the spanwise direction (two-dimensional flow and independent of z) also corresponds to the existence of only one mode in the POD, if (2.2) is adapted for the cross-flow. This can be shown directly by using the definitions in (2.2) and (2.3). In general, dominant modes with higher energy fraction and larger spatial POD mode correspond to higher mean correlation in the spanwise direction. In our measurements, the spanwise-averaged cross-correlation is not unity, but around 0.92 due to the small-scale turbulence in the vortical flow. The forms of (3.7) and (3.8) were chosen as the simplest cases as well as to emphasise the different regions of Strouhal number. The two curves for the two regions intersect at around St ≈ 0.05, which is the border between the drag and thrust forces. As the thrust force is generally associated with the reverse Kármán vortex street composed by rolled-up vortices, it appears that spanwise vortices generated in this regime are expected to be highly two-dimensional.
We note that, in our experiments, we measured a weak spanwise velocity component (of the order of 10 % of the free-stream velocity) in some cases, however, it is difficult to draw any conclusions about the spanwise flow in the vortex core from the measurements at a fixed cross-flow plane at four chord lengths downstream. As the flow is not fully coherent, especially at low Strouhal numbers, the deformation of the vortex filament in the spanwise direction and the resulting curvature of the vortex axis can also lead to the appearance of the spanwise velocity component. Even though the r.m.s. velocity in the spanwise direction is nearly uniform, spanwise vortices are not truly two-dimensional. It is more prudent to say that spanwise vortices are quasi-two-dimensional at high Strouhal numbers.
3.4. Implications of spanwise coherence
As discussed in the Introduction (§ 1.4), oscillating wakes are commonly used as gust generators in various experimental simulations. The present study, although limited to pure plunging motion, gives some insight into the degree of the two-dimensionality of oscillating wakes. Experimentally generated gusts, wakes and vortices may exhibit specific characteristics while the essential aspects, including the vorticity shedding, roll up and spanwise vortices, are expected to have some commonality. Based on our study, we predict that unsteady wakes can be assumed to be approximately two-dimensional if the Strouhal number St, which is an amplitude parameter, is larger than a critical value. For smaller Strouhal numbers, the average cross-correlation increases with increasing Strouhal number (wake or gust amplitude). In our case of plunging airfoils, the critical value of the Strouhal number is approximately St ≈ 0.05. This corresponds to a ratio of the maximum plunge velocity to the free-stream velocity of approximately 0.16 and  ${\alpha _{eff,max}} \approx 9\mathrm{^\circ }$. It is also seen in figure 7(b) that
 $v_{rms,max}/U_{\infty}$ is generally less than 0.1, if the Strouhal numbers are less than 0.05. If the maximum wake angle is taken as a rough approximation of the gust angle generated by the wake, it corresponds to a gust amplitude of approximately 6° for the pure plunging motion. This value could be an upper limit for experimentally generated small-amplitude gusts. This rough estimate can also be used for other airfoil motions (pure pitching and combined pitching and plunging), if the generalised Strouhal number based on the total excursion of the trailing edge of the airfoil is used (Triantafyllou et al. Reference Triantafyllou, Triantafyllou and Gopalkrishnan1991; Anderson et al. Reference Anderson, Streitlien, Barrett and Triantafyllou1998). In summary, in our case, if wakes of plunging airfoils are to be used as gust generators to produce small-amplitude gusts, the wakes need to operate at St ≤ 0.05. Unfortunately, in this range of the Strouhal numbers, the unsteady wake can be far from being two-dimensional.
The decay of the vorticity in the streamwise direction may cause a non-uniform variation in the amplitude of the travelling-wave gusts in this kind of gust generator. We believe that this is a secondary level effect compared with the lack of spanwise coherence, and may be alleviated to a certain extent by choosing the ratio of the chord length to the gust wavelength to be small. Lack of two-dimensionality is expected to decrease the magnitude of the unsteady forces acting on downstream bodies. In the simplest two-dimensional aerodynamic model, the instantaneous lift is proportional to the instantaneous cross-stream velocity, with a well-known frequency correction for attached flows (Theodorsen Reference Theodorsen1935). The amplitude of the lift fluctuations is given by
 \begin{equation}{c_l} = 2{\rm \pi} \frac{v}{{{U_\infty }}}\, \left( {\boldsymbol{C}(k) + {\rm i}\frac{k}{2}} \right),\end{equation}
where the Theodorsen function C(k) is a complex number and i is the imaginary unit. This two-dimensional attached flow model can be extended to the three-dimensional wings by including the two-point cross-correlation coefficients of the cross-stream velocity fluctuations. The physical basis of including cross-correlations in the spanwise direction comes from the use of the strip theory. Massaro & Graham (Reference Massaro and Graham2015) and others cited in their paper used this approach in which the two-dimensional lift is integrated over the span to compute the total lift on the whole span. In our case, their approach can be applied by integrating the sectional lift while also taking into account the cross-correlations of the cross-stream velocity
 \begin{equation}{C_L} = \frac{1}{b}\int {2{\rm \pi} {C_{vv}}} \frac{v}{{{U_\infty }}}\left( {\boldsymbol{C}(k) + {\rm i}\frac{k}{2}} \right)\,\textrm{d}z,\end{equation}
where b is the span of the wing. Therefore, for a rectangular wing and uniform velocity in the spanwise direction, we predict that the ratio of the lift fluctuations is given by the spanwise-averaged cross-correlation
 \begin{equation}\frac{{{C_L}}}{{{c_l}}} = \frac{1}{b}\int {{C_{vv}}\,\textrm{d}z} = {C_{vv,ave}}.\end{equation}
It appears that this may be a more important issue for the experimental simulation of small-amplitude gusts for which the amplitude of wake excitation (St in our case) is also small and the wake is far from being nearly two-dimensional. For small St, the spanwise-averaged cross-correlation increased linearly for our experiments.
To support our argument, we present the results from various experimental facilities and compare different methods of gust generation and unsteady wing motion. When unsteady lift of an airfoil submerged in wake flows is considered, the parameter k is the only parameter for small-amplitude disturbances in the Theodorsen and Sears formulations. Figure 21 is a typical plot commonly used to present the experimental lift data obtained in various gust generators. The different red symbols in figure 21 show the ratio of the amplitude of the unsteady lift force to that of the quasi-steady lift force, Lamp/Lqs,amp, as a function of the reduced frequency k from previous studies (Cordes et al. Reference Cordes, Kampes, Meissner, Tropea, Peinke and Holling2017; Wei et al. Reference Wei, Kissing, Wester, Wegt, Schiffmann, Jakirlic, Holling, Peinke and Tropea2019b; Wu et al. Reference Wu, Bangga, Lutz, Kampers and Holling2020), in which cascades of oscillating airfoils are used to generate travelling-wave gusts. The data cover a range of gust amplitudes, Reynolds numbers and airfoil profiles, but in all cases it is believed that (mostly) attached flows are maintained. The solid red line shows the Sears (Reference Sears1941) solution, which has good agreement with the experiments at higher k, but both the deviation from the theory and scatter of the data significantly increase at low reduced frequencies.
Ratio of the amplitude of lift to that of quasi-steady lift from the literature for travelling-wave gusts, standing-wave gusts, plunging airfoils, the Sears and Theodorsen predictions.

The discrepancy of the data of Cordes et al. (Reference Cordes, Kampes, Meissner, Tropea, Peinke and Holling2017) compared with the Sears function at low reduced frequencies was attributed to various factors. Cordes et al. (Reference Cordes, Kampes, Meissner, Tropea, Peinke and Holling2017) suggested that the experimental results show good agreement with the Atassi theory, which takes into account the distortion of the steady velocity field by the presence of an airfoil. Wei et al. (Reference Wei, Kissing, Wester, Wegt, Schiffmann, Jakirlic, Holling, Peinke and Tropea2019b) attributed the discrepancy to the turbulent wakes causing large intermittent peaks in the gust angle. They also reported that the two-dimensional simulations agree with the experiments in the low reduced frequency region over which the potential flow results are very different. The two-dimensional numerical simulations cannot take the spanwise coherence into account. This remains an open question. In addition, it is not clear how the turbulent wake from an upstream gust generator causes a very large discrepancy compared with the theory at low frequencies but still provides excellent agreement at higher frequencies. Wu et al. (Reference Wu, Bangga, Lutz, Kampers and Holling2020) suggested that, in addition to the ‘highly turbulent wakes’, there is a second flow mechanism which contributes to this discrepancy at low reduced frequencies. They proposed that the existence of the airfoil in the test section may impact the gust angle. It is likely that the spanwise coherence of the oscillating wakes in these gust generators is far from being two-dimensional in this range. In contrast, the blue triangular symbols, which show the results for a standing-wave type of gust generator (Fernandez, Cleaver & Gursul Reference Fernandez, Cleaver and Gursul2021), reveal very good agreement with the corresponding theoretical solution of Theodorsen (Reference Theodorsen1935). This particular standing-wave gust generator relies on the periodic deflection of the free stream rather than oscillating wakes with travelling waves, and is believed to have better two-dimensionality of the gusts generated. It is noteworthy that, even at very low reduced frequencies, the agreement with the theory is very good. This shows that excellent agreement with the theory exists if wake flows are not used as gust generators.
The plunging airfoil case is identical to a fixed airfoil in standing-wave gust. The blue square symbols in figure 21 show the case of a plunging airfoil (Chiereghin et al. Reference Chiereghin, Cleaver and Gursul2019), and also reveal good agreement with the Theodorsen theory. The difference between the Theodorsen and Sears solutions for k ≤ 0.25 is negligible, yet the experimental data for the standing-wave gusts and travelling-wave gusts exhibit very large deviations from each other. Physically, we expect that, at the very long wavelength limit (very small k), both the travelling-wave and standing-wave gusts should produce a similar lift response, just as the Theodorsen and Sears solutions merge. Our experiments suggest that the source of this discrepancy in the measured lift response of fixed airfoils in travelling-wave and standing-wave gusts may be due to the differences in the spanwise coherence of the simulated gusts. Unfortunately, measurements of the spanwise coherence of the experimentally produced gusts have been lacking in the literature. Our findings in this paper point out the importance of this long-neglected issue.
4. Conclusions
The unsteady wakes of a periodically plunging airfoil set at zero mean angle of attack at a chord Reynolds number of Re = 20 000 were investigated by means of PIV measurements. The main focus was on understanding the effects of the main parameters, which are the reduced frequency k and the Strouhal number St based on the peak-to-peak plunge amplitude, on the unsteady characteristics and coherence of oscillating wakes. The measurements of streamwise flow and cross-flow in the near wake were analysed using two-point cross-correlations and POD of oscillating wakes for a wide range of parameters (k ≤ 3.14 and St ≤ 0.24).
The instantaneous vortical flow in the near wake appears as a travelling wave with much larger amplitude than the amplitude of the airfoil motion at low Strouhal numbers. The peak-to-peak amplitude of the travelling wave is more dependent on the reduced frequency. With increasing Strouhal number, a reverse Kármán vortex street configuration with relatively smaller spacing between the two rows is observed. Within the range of kinematic parameters tested, the mean streamwise velocity at the centreline generally increases with increasing k and A/c. There is a better trend of the data to collapse with St than k, except for higher frequencies at each fixed amplitude A/c. Similarly, the maximum r.m.s. velocity fluctuations exhibit better collapse with St than k, particularly at lower values of k. The degree of the collapse in the whole range of the data significantly increases with the momentum thickness and the corrected thrust coefficient. Estimates of the thrust coefficient using the method of Bohl & Koochesfahani (Reference Bohl and Koochesfahani2009) suggest that the drag force switches to a thrust force at approximately St ≈ 0.05 at this Reynolds number. Our data for the whole range of parameters tested confirm the significant effect of the reduced frequency on the time-averaged thrust coefficient. The dependence on the reduced frequency can be represented by the same function proposed by Garrick (Reference Garrick1936), but multiplied by a 26 % smaller constant. We suggest that this correction represents the roll-up of vortex sheets instead of remaining planar, as assumed by the Garrick theory.
With increasing frequency and amplitude of the airfoil motion, the peak cross-correlation coefficient of the streamwise flow in the near wake increases. We find qualitative similarities to the wake synchronisation and vortex lock-in of oscillating bodies and airfoils. The streamwise flow is characterised by the first two POD modes, which are the fundamental wake modes and describe a travelling wave. The relative energy of the first two modes increases with increasing frequency and amplitude of the airfoil motion. The relative contribution of the fundamental wake modes, (E 1 + E 2)/ET, has a much better correlation with St than the time-averaged quantities of the flow. For drag-producing wakes, the percentage energy of the fundamental wake modes increases rapidly with increasing Strouhal number. In contrast, it increases more slowly for thrust-producing wakes.
The cross-flow measurements in the near wake revealed that, although the r.m.s. cross-stream velocity fluctuations are uniform in the spanwise direction, the two-point cross-correlation coefficient decays rapidly for the stationary airfoil (k = 0). The spanwise length scale for this case drops to approximately L ≈ 0.16c at x/c = 4.03, which is of the order of the airfoil thickness. With increasing frequency and amplitude of the airfoil oscillations, while the r.m.s. velocity fluctuations remain nearly uniform, the cross-correlation coefficient drops rapidly with spanwise distance from the reference point (wake centreline at the mid-span) to a nearly constant level. This constant level of the cross-correlation coefficient increases with increasing reduced frequency and Strouhal number. The corresponding POD analysis of the cross-stream velocity fluctuations shows that there is only a single dominant mode for the oscillating wakes, which can be described as a ‘flapping mode’. The ratio of the energy of the first mode energy to the total energy, E 1/ET, shows very good correlation with the Strouhal number, exhibiting different behaviour in drag-producing and thrust-producing wakes. The spanwise-averaged cross-correlation coefficient in the measurement domain again reveals a very good correlation with the Strouhal number St, consistent with the good correlation of the percentage energy of the dominant POD mode. Two regions are identified as a function of Strouhal number. For small St, the spanwise-averaged cross-correlation coefficient grows almost linearly in the drag-producing region. For larger St in the thrust-producing region, the spanwise-averaged cross-correlation coefficient is roughly constant  $({C_{vv,ave}} \approx 0.92)$. This high value of the cross-correlation suggests highly two-dimensional spanwise vortices in the thrust-producing regime for x/c ≤ 4 at Re = 20 000.
In summary, we compared the effects of the reduced frequency and the Strouhal number on various flow quantities, including the mean streamwise velocity, the maximum r.m.s. velocity, momentum thickness, mean thrust, energy percentage of the dominant POD modes and the spanwise-averaged cross-correlation coefficient. In all cases, it was shown that the Strouhal number was the dominant parameter. The Strouhal number represents the amplitude parameter for the excitation of the wake. Once it reaches a sufficient amplitude, the unsteady wake becomes more synchronised. The observed saturation of the mode energies and the spanwise-averaged cross-correlation for St ≥ 0.05 are due to the wake synchronisation. The threshold value of St ≈ 0.05 was consistent with previous numerical simulations of unsteady wakes. Once the wake becomes synchronised, further increase in the amplitude does not increase the coherence of the flow.
Finally, the implication of the lack of two-dimensionality was discussed for gust generators that are based on oscillating airfoils. While our study is limited to plunging airfoils, it suggests that the Strouhal number based on the plunge amplitude, which is also a measure of the gust amplitude produced in the wake, is the most important parameter that determines the degree of two-dimensionality. For small gust angles we may expect less two-dimensionality, and smaller lift force fluctuations on downstream wings. This may necessitate corrections of the measured lift amplitude using two-point cross-correlations of the gust angle. For a simple aerodynamic model in which the lift fluctuations are proportional to the amplitude of the gust angle, it is shown that the correction can be achieved by the use of the spanwise-averaged cross-correlation of gust angle. The comparison of the experimental results obtained using travelling-wave gusts, standing-wave gusts and plunging airfoils reveals that there exists a large scatter of data as well as deviations from the theory only for the travelling-wave gusts. This implies that travelling-wave gusts may be far from being two-dimensional in some cases. We suggest that the spanwise coherence of the experimentally produced gusts should be considered when interpreting the amplitude of the lift fluctuations on downstream wings.
Funding
The authors would like to acknowledge the Engineering and Physical Sciences Research Council (EPSRC) Grant No. EP/S028994/1, the EPSRC strategic equipment Grant (EP/K040391/1) that made the velocity measurements possible and the Republic of Turkey Ministry of National Education Scholarship for the first author.
Declaration of interests
The authors report no conflict of interest.