Introduction
Biodiversity in the tropics is increasingly affected by rapid changes in land use. For example, 318,000 ha of natural forest was converted to oil palm plantations in Peninsular Malaysia between 1990 and 2010 (Gunarso et al., Reference Gunarso, Hartoyo, Agus, Killeen, Killeen and Goon2013) with oil palm ‘forests’ now accounting for 45% (2.6 million ha) of the forested land (MPOB, 2016) in the peninsula. Forested land in total, accounts for 44% (5.80 million ha) of land in Peninsular Malaysia, including 1.92 million ha of protected forest (Forestry Department Peninsular Malaysia, 2016), while urban land accounts for around 6% (0.8 million ha) (National Physical Plan-2, 2010). The proportion of urban land will continue to increase across Tropical East Asia (Schneider et al., Reference Schneider, Mertes, Tatem, Tan, Sulla-Menashe, Graves, Patel, Horton, Gaughan and Rollo2015), and in Peninsular Malaysia specifically, the land around Kuala Lumpur, known as the Klang Valley conurbation, is experiencing rapid urban sprawl (Sing et al., Reference Sing, Jusoh, Hashim and Wilson2016a). Urban parks and gardens with substantial vegetation, ‘ornamental forests’, could help to retain biodiversity in tropical urban areas where little natural habitat remains (Alvey, Reference Alvey2006; Sing et al., Reference Sing, Jusoh, Hashim and Wilson2016a, Reference Sing, Dong, Wang and Wilsonb).
In addition to land use changes, the global average temperature has increased by 0.16 °C over the past decade (NASA, 2015), with impacts on terrestrial and marine species worldwide (Pacifici et al., Reference Pacifici, Foden, Visconti, Watson, Butchart, Kovacs, Scheffers, Hole, Martin, Akçakaya, Corlett, Huntley, Bickford, Carr, Hoffmann, Midgley, Pearce-Kelly, Pearson, Williams, Willis, Young and Rondinini2015). For example, activity patterns of terrestrial arthropods, poikilothermic animals with vital ecosystem roles (e.g. pollinators, seed dispersers, scavengers, decomposers, trophic intermediaries; Foottit & Adler, Reference Foottit and Adler2009) are dictated by climate. Changes in atmospheric temperatures influence arthropod activity both directly - temperature increases result in uncoordinated locomotion, increased metabolic expenditure, an accelerated life cycle, ‘heat coma’, and death (Piyaphongkul et al., Reference Piyaphongkul, Pritchard and Bale2012; Jaworski & Hilszczański, Reference Jaworski and Hilszczański2013), and indirectly - through plant phenology, food quality, and parasitoid, predator and pathogen abundances (Colinet et al., Reference Colinet, Sinclair, Vernon and Renault2015). In temperate regions, activity in a wide range of arthropod orders is influenced by changes in temperature and precipitation between seasons (Jaworski & Hilszczański, Reference Jaworski and Hilszczański2013). However, in tropical regions, where annual changes in temperature and precipitation are much less pronounced, arthropod activity is generally assumed to be aseasonal (Anu et al., Reference Anu, Sabu and Vineesh2009). Consequently, global warming may be considered a lower threat to arthropod biodiversity in tropical than in temperate regions because species showing patterns of activity influenced by fluctuations in temperature and precipitation are thought to be at higher risk of climate-related extirpation (Piyaphongkul et al., Reference Piyaphongkul, Pritchard and Bale2012). Conversely, tropical arthropods, already living at the limit of their narrow temperature range, may be less tolerant of temperature fluctuations compared with their temperate relatives (Bale & Hayward, Reference Bale and Hayward2010; Corlett, Reference Corlett2011; Andrew et al., Reference Andrew, Hart, Jung, Hemmings and Terblanche2013). Tropical arthropods will experience historically unprecedented climates within the next decade because the tropics will be among the regions of the world first affected by global climate change (Mora et al., Reference Mora, Frazier, Longman, Dacks, Walton, Tong, Sanchez, Kaiser, Stender, Anderson, Ambrosino, Fernandez-Silva, Giuseffi and Giambelluca2013).
Our objective was to characterize changes in tropical arthropod activity, corresponding to changes in temperature and precipitation, across three major tropical anthropogenic forest types: secondary reserve forest (SRF), oil palm forest (OPF), and urban ornamental forest (UOF). We collected weekly Malaise trap samples at each forest type over 12 months and used DNA metabarcoding (Brandon-Mong et al., Reference Brandon-Mong, Gan, Sing, Lee, Lim and Wilson2015) to examine shifts in arthropod activity.
Materials and methods
Anthropogenic forest sites and climate data
Malaise traps were deployed for 1 year (from October 2014 to October 2015) at three anthropogenic forest sites in Peninsular Malaysia representing typical examples of the major anthropogenic forest types found in the peninsular.
The first site was Ulu Gombak Forest Reserve, a 17,000 ha SRF in Selangor. Ulu Gombak Forest Reserve represents a typical secondary forest reserve found in the west of Peninsular Malaysia comprising logged, mixed, dipterocarp forest and has been intensively studied since the establishment of a Field Studies Centre in 1966 (Sing et al., Reference Sing, Syaripuddin and Wilson2013). The second site was Rimba Ilmu, an 82 ha UOF located at the University of Malaya main campus at the western boundary of the Federal Territory of Kuala Lumpur. Rimba Ilmu (http://rimba.um.edu.my) represents a typical urban park found in Peninsular Malaysia; Rimba Ilmu is open to the public, comprises a mixture of old trees, hedges (shrubs), flowerbeds, and small ‘unmanaged’ areas with early successional species (e.g. grasses) (Sing et al., Reference Sing, Jusoh, Hashim and Wilson2016a), and is surrounded by residential and commercial land use. The third site was OPF in Perak. The Malaise trap at OPF was originally sited at Teluk Intan, Perak, but was stolen in December 2014. A new Malaise trap was then immediately deployed at Parit, Perak, 60 km away from the original location. Both OPF locations were part of a large contiguous area of oil palm plantations in Perak and represent typical OPF in Peninsular Malaysia comprising a monoculture of Elaies guineensis × Elaies oleifera. It is common practice to remove weeds in the understory but some early successional species (notably non-native species; Teuscher et al., Reference Teuscher, Gérard, Brose, Buchori, Clough, Ehbrecht, Hölscher, Irawan, Sundawati, Wollni and Kreft2016) may persist, especially at forest edges.
Peninsular Malaysia, situated at the centre of hyperdiverse, tropical, Southeast Asia has almost no variability in the annual temperature (26°C ± 2°C), with high humidity (79–90%) and high rainfall (2400 mm per year) year-round (Akhiri & Yong, Reference Akhiri and Yong2011). Mild annual changes result from two monsoon seasons; drier conditions are experienced during southwest monsoon (May–August) compared with the northeast monsoon (November–February), known as the ‘rainy’ season (Hafezatul Rasyidah, Reference Hafezatul Rasyidah2010; Akhiri & Yong, Reference Akhiri and Yong2011; Tangang et al., Reference Tangang, Liew, Salimun, Kwan, Loh and Muhamad2012). These monsoons are increasingly unpredictable. The southwest monsoon is starting earlier and lasting longer, resulting in a significant increase in mean precipitation (8% increase across South Asia; Tangang et al., Reference Tangang, Liew, Salimun, Kwan, Loh and Muhamad2012), whereas the northeast monsoon is getting drier (Tangang et al., Reference Tangang, Liew, Salimun, Kwan, Loh and Muhamad2012). The interacting effects of El Niño Modoki have resulted in increased droughts and heat waves, while interacting effects of the Borneo Vortex have caused major floods, and a rare typhoon, during the northeast monsoon (Tangang et al., Reference Tangang, Liew, Salimun, Kwan, Loh and Muhamad2012). The average annual temperature in Peninsular Malaysia is expected to increase 3–5°C to 29–30°C by the end of the century (Tangang et al., Reference Tangang, Liew, Salimun, Kwan, Loh and Muhamad2012).
Weather data (daily mean rainfall, maximum and minimum temperature) for each site was obtained from the Malaysian Meteorological Department: (1) SRF from the station located at ‘Jabatan Kemajuan Orang Asli’ (JAKOA) Gombak; (2) UOF from the station located in Petaling Jaya; (3) OPF at Teluk Intan from Accuweather (http://www.accuweather.com/en/my/teluk-intan/229685/weather-forecast/229685); (4) OPF at Parit from the station at Pusat Pertanian Titi Gantong; defective data from this station (due to either malfunctioning of the instrument, maintenance, or failure to pass quality control steps) was replaced with either data obtained from the station at Hospital Kampar or from Accuweather (http://www.accuweather.com/en/my/parit/229765/weather-forecast/229765). Daily mean data were averaged to produce a single mean temperature for each week (Saturday to Friday because collection bottles were changed on Fridays).
Sample sorting and DNA extraction
The collection bottles of the Malaise traps were collected weekly and replaced with new bottles containing 150 ml ethanol. The collected samples were stored in a −20°C freezer prior to sample sorting and DNA extraction. Weekly samples were individually placed in previously sterilized Petri dishes (10% Chlorox) using forceps. Two legs from arthropod specimens, equal to or larger in size than a honeybee, and whole bodies of smaller specimens were placed in a 15 ml sterile tube. Specimens were oven-dried for 1 week and the mass of the weekly sample was recorded. Based on the mass, 8.0 ml of T1 lysis buffer, 1.1 ml of proteinase K, 8.8 ml of B3 lysis buffer, and 9.3 ml of absolute ethanol per 1.0 g were added to the tube. Genomic DNA was extracted using a NucleoSpin Tissue kit (Macherey-Nagel, Germany), using a single column per weekly sample, and otherwise following the manufacturer's instructions.
Polymerase chain reaction (PCR) and sequencing
Partial Illumina adapter sequences were incorporated into primers mlColintF and HCO2198 (Folmer et al., Reference Folmer, Black, Hoeh, Lutz and Vrijenhoek1994; Leray et al., Reference Leray, Yang, Meyer, Mills, Agudelo, Ranwez, Boehm and Machida2013; Supplementary Table 1). The bulk DNA extracts were used for PCR following the protocol described for [V3]mlColintF/[MID96]HCO2198 by Brandon-Mong et al. (Reference Brandon-Mong, Gan, Sing, Lee, Lim and Wilson2015) with an expected amplicon length of 313 bp. Five independent amplicons were pooled and were purified and size-selected using 0.8× volume ratio of AMPure XP® beads (Beckman Coulter Inc., USA). The purified amplicons were used as templates for the second round of PCR to generate amplicons containing full Illumina adaptors and unique dual-index tags (following Lee et al., Reference Lee, Gan, Clements and Wilson2016). The library was quantified using KAPA library quantification kit (KAPA Biosystems, South Africa), normalized, and pooled. Sequencing was performed on an Illumina MiSeq Sequencer (2 × 250 bp paired-end read setting) at the Monash University Malaysia Genomics Facility.
Sequencing was initially performed in two runs corresponding to weekly samples from October to March and April to September. Reads were demultiplexed and adapter trimmed onboard the MiSeq using the MiSeq Reporter software. The number of reads produced per weekly sample ranged from 146 to 389,750. Thirty-one weekly samples which produced ≤90,000 reads in the first run were repeated. The number of reads per weekly sample in the second run ranged from 11,892 to 143,180. Six samples which produced ≤15,000 reads in the second run were repeated. If a weekly sample was subjected to multiple runs, all reads were pooled for analysis. FASTQ files related to this study are available in the NCBI SRA under accession SRR5179085 (weekly samples from October to March) and SRR5181818 (weekly samples from April to September).
Bioinformatics analysis
The output FASTQ files were dereplicated and quality-filtered using the online PRINSEQ (Schmieder & Edwards, Reference Schmieder and Edwards2011). The PRINSEQ output data (in FASTA format) was further filtered manually in CodonCode Aligner (CondonCode Corp., USA) following the protocol described by Brandon-Mong et al. (Reference Brandon-Mong, Gan, Sing, Lee, Lim and Wilson2015). The resulting metabarcodes (final Operational Taxonomic Units; OTU) were uploaded to the Barcode of Life Datasystems (BOLD) (Ratnasingham & Hebert, Reference Ratnasingham and Hebert2007) and are available in the public dataset DS-MTISA (http://www.boldsystems.org/index.php/MAS_Management_OpenDataset?datasetcode=DS-MTISA).
Order assignment
Order names were assigned to the OTU based on matches obtained from the (full) BOLD identification engine. Names were assigned to OTU when the closest matching database sequence in BOLD shared >85.9% similarity (following Zeale et al., Reference Zeale, Butlin, Barker, Lees and Jones2011). 91.0% of OTU were assigned an order name. Due to incompleteness of DNA barcode reference libraries available for the region (Wong et al., Reference Wong, Lim and Wilson2015; Wilson et al., Reference Wilson, Sing, Lee and Wee2016), we did not systematically assign more precise taxonomic names to the OTU.
Statistical analyses
To avoid biases in diversity estimates caused by unavoidable inconsistencies in the number of reads produced across independent samples by high-throughput sequencers (Leray & Knowlton, Reference Leray and Knowlton2016), high-throughput sequencing data are commonly analyzed using proportions or rarefraction (Beng et al., Reference Beng, Tomlinson, Shen, Surget-Groba, Hughes, Corlett and Slik2016). Due to the problem of ‘lost data’ associated with rarefaction (McMurdie & Holmes, Reference McMurdie and Holmes2014), we opted to calculate the proportion of OTU representing each of the five most abundant arthropod orders in each weekly sample. The proportions were arcsine-transformed prior to statistical analysis (arcsine transformation is recommended to normalize proportions; Lachin, Reference Lachin1981).
Multiple linear regressions were fitted to examine the effect of weather variables on the proportion of the top five most abundant insect orders throughout the year. For each insect order (Diptera, Lepidoptera, Coleoptera, Hemiptera, and Hymenoptera), a multiple linear regression was performed with the following terms added as initial fixed effects: weekly maximum temperature (°C), weekly minimum temperature (°C), weekly mean rainfall (mm), and the second order interaction of each weather variable with forest type. Higher order interactions and other second-order interactions were not included to avoid over-parameterizing the models. Models were simplified using deletion tests based on partial F tests (using the base R function drop1), and non-significant terms were removed until minimal adequate models were achieved (Crawley, Reference Crawley2012). Explanatory variables with a P value of <0.05 were retained in the minimal adequate models. Model validation plots were examined for deviations from the assumptions of a linear model.
Results
We detected 8387 OTU across all sites (several overlapped multiple sites) and sampling weeks: 2603 from UOF, 3341 from OPF, and 4296 from SRF. In total, 7635 OTU were assigned to 28 arthropod orders. The orders containing the most OTU were Diptera (4672 OTU; 56%), Lepidoptera (1108 OTU; 13%), Coleoptera (778 OTU; 9%), Hemiptera (427 OTU; 5%), and Hymenoptera (199 OTU; 2%). Other arthropod orders were detected but with fewer OTU (<2%; Supplementary Table 2). Non-arthropod orders (mostly bacterial or fungal in origin) contributed 14% (1196) of the OTU detected.
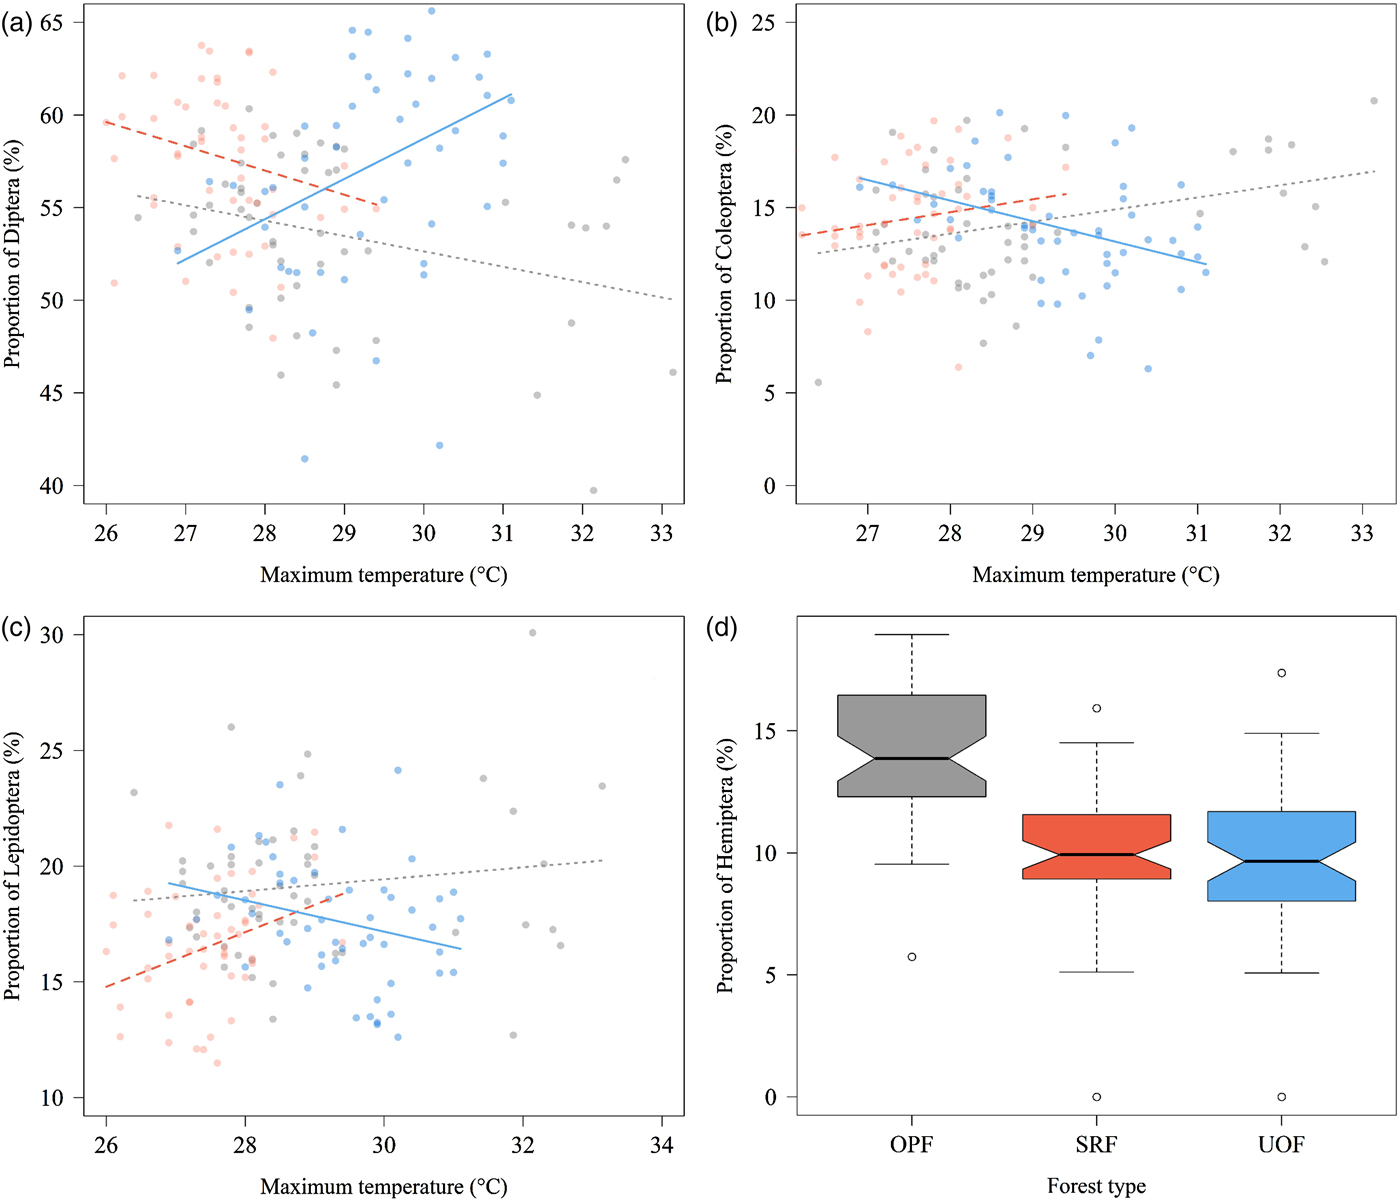
The proportion of Diptera was significantly affected by the interaction between forest type and maximum temperature (fig. 1a, F 2, 149 = 8.63, P < 0.001). This relationship was strongly positive in the UOF (y = 2.17x−6.47), and negative in both the oil palm (y = −0.829x + 77.5) and SRFs (y = −1.31x + 93.6).
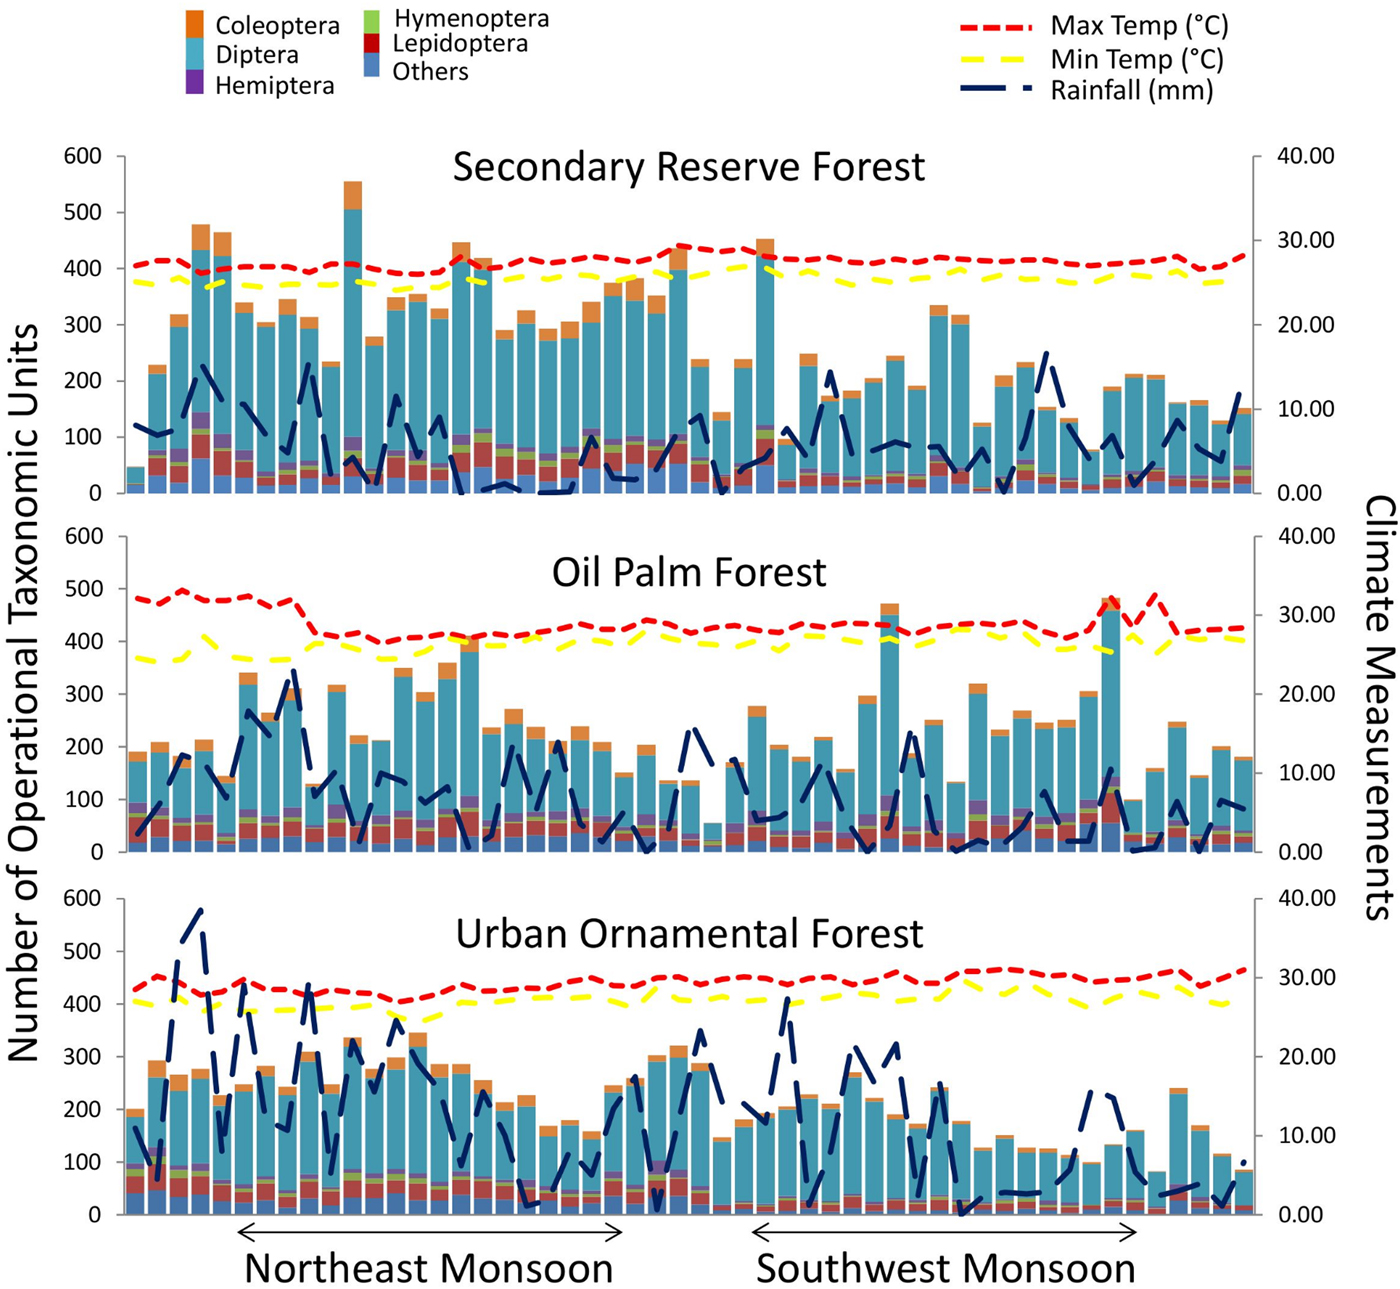
Number of operational taxonomic units collected in weekly samples over 1 year at three anthropogenic forests in Peninsular Malaysia.

The proportion of Coleoptera was also significantly affected by the interaction between forest type and maximum temperature (fig. 1b, F 2, 149 = 7.85, P < 0.001). This relationship was slightly positive in both the oil palm (y = 0.706x− 6.43) and SRFs (y = 0.695x− 4.69), and negative in the UOF (y = −1.11x + 46.4).
The proportion of Lepidoptera was also significantly affected by the interaction between forest type and maximum temperature (fig. 1c, F 2, 149 = 4.28, P = 0.0156). This relationship was strongly positive in the SRF (y = 1.18x −15.9), slightly positive in the OPF (y = 0.257x + 11.7), and negative in the UOF (y = −0.676x + 37.5).
The proportion of Hemiptera was significantly affected by forest type only (fig. 1d, F 2, 152 = 37.2, P < 0.001). The proportion of Hymenoptera was not affected by the forest type or any weather variables, with the model producing non-significant results for all variables.
Discussion
Although seasons across Southeast Asia are mostly characterized by heavy rainfall (i.e., the monsoons), the arthropod communities detected in this study did not show shifts significantly related to rainfall. Conversely, the arthropod communities detected in this study did show shifts which were significantly related to maximum temperature in various ways. These changes were compounded by differences in forest types, and similar to previous studies, we found substantially lower species richnesses of arthropods in oil palm plantations (Fitzherbert et al., Reference Fitzherbert, Struebig, Morel, Danielsen, Brühl, Donald and Phalan2008; Koh, Reference Koh2008; Fayle et a l., Reference Fayle, Turner, Snaddon, Chey, Chung, Eggleton and Foster2010; Senior et al., Reference Senior, Hamer, Bottrell, Edwards, Fayle, Lucey, Mayhew, Newton, Peh, Sheldon, Stewart, Styring, Thom, Woodcock and Hill2013) and urban green spaces (Uno et al., Reference Uno, Cotton and Philpott2010; Syaripuddin et al., Reference Syaripuddin, Sing and Wilson2015) compared with more natural forests. Consequently, tropical arthropod biodiversity may face a cumulative threat with the impact of climate change being felt more strongly in intensely human-modified ecosystems which already support reduced levels of arthropod activity in comparison with more natural forests. Crucial ecosystem functions are performed by forest arthropods, such as the decomposition of vertebrate carcasses (Sugiura et al., Reference Sugiura, Tanaka, Taki and Kanzaki2013) and plant biomass (Price et al., Reference Price, Denno, Eubanks, Finke and Kaplan2011), pollination (Vanbergen, Reference Vanbergen2013), and seed dispersal (Nichols et al., Reference Nichols, Spector, Louzada, Larsen, Amezquita and Favila2008), and such ecosystem functions will be impacted by changes in arthropod activity (Weisser & Siemann, Reference Weisser and Siemann2004).
Interestingly, responses to maximum temperature differed by arthropod order as well as forest type. The proportion of Coleoptera was significantly affected by the interaction between forest type and maximum temperature. The relationship was slightly positive in both the OPF and SRF, but negative in the UOF. Other studies have also reported significant correlations between beetle diversity and temperature (Pinheiro et al., Reference Pinheiro, Diniz, Coelho and Bandeira2002; Sittichaya et al., Reference Sittichaya, Thaochan and Tasen2013; Aneni et al., Reference Aneni, Aisagbonhi, Iloba, Adaigbe and Ogbebor2014), for example, Pinheiro and colleagues (Reference Pinheiro, Diniz, Coelho and Bandeira2002) showed the abundance of beetles in Brazilian Cerrado was significantly positively correlated with delayed maximum temperature (maximum temperature of the previous month). Most beetles are nocturnal or remain hidden during daylight (when the maximum temperature is most likely to occur), move slowly and rarely fly, and are unlikely to thermoregulate (Lease et al., Reference Lease, Goelst, Seely and Mitchell2014). However, some beetles, such as dung beetles, do thermoregulate and remain active at high temperature (Verdú et al., Reference Verdú, Díaz and Galante2004, Reference Verdú, Alba-Tercedor and Jiménez-Manrique2012). Interestingly, beetles in the family Bostrichidae, which includes serious insect pests of forests and agriculture (Sittichaya et al., Reference Sittichaya, Thaochan and Tasen2013), appeared in the OPF (based on BOLD database matches sharing >95% similarity) in February (end of northeast monsoon) and July 2016 (end of southeast monsoon), however, the abundance of Bostrichidae in mixed crop plantations in Thailand was reported to fluctuate without any prominent peaks (Sittichaya et al., Reference Sittichaya, Thaochan and Tasen2013).
Similarly to Coleoptera, the proportion of Lepidoptera was significantly affected by the interaction between forest type and maximum temperature. Likewise, the relationship was positive in the SRF and OPF, but negative in the UOF. The lowest maximum temperatures were reported for the SRF, and the highest maximum temperatures for the OPF. OPFs have generally been reported to be hotter (+2.84°C) and drier than both primary and secondary forest reserves (Luskin & Potts, Reference Luskin and Potts2011), but this will be dependent on the age of trees in the oil palm plantation. Roberts et al. (Reference Roberts, Cooper and Petit2000) suggested the higher density of canopy trees in the less-disturbed forest could provide shade and lower the atmospheric temperature (Liow et al., Reference Liow, Sodhi and Elmqvist2001), which presumably buffers arthropod communities from changes in temperature (Pincebourde et al., Reference Pincebourde, Sinoquet, Combes and Casas2007). Urban forests generally have fewer trees in the over-storey compared with forest reserves and plantations, effectively providing less shade (Porter et al., Reference Porter, Forschner and Blair2001) which may account for the different patterns observed between these forest types.
The dominance of dipterans in Malaise trap samples across the three anthropogenic forests was similar to previous findings, for example, Zhang et al. (Reference Zhang, Lin, Ji, Yang, Wang, Yang, Wang, Jiang, Harrison and Yu2016) reported that the collections from traps deployed in a tropical forest in southern mainland China comprised 43% dipterans (n = 848). Similarly to Coleoptera and Lepidoptera, the proportion of Diptera was significantly affected by the interaction between forest type and maximum temperature. However, in contrast to both Coleoptera and Lepidoptera, the relationship for Diptera was strongly positive in the UOF but negative in both the OPF and SRF. Nazareth et al. (Reference Nazareth, Seixas and Sousa2016) suggested that warmer temperatures (between the upper and lower limits) may increase the development rate of certain mosquito species, and some blood-feeding dipterans, such as mosquitoes, can thermoregulate during feeding (Benoit & Denlinger, Reference Benoit and Denlinger2010; Lahondère & Lazzari, Reference Lahondère and Lazzari2012). However, considering Diptera comprised the majority of OTU across all the samples (fig. 2), the increase in the proportion of Diptera could actually represent a decrease in other arthropod orders which are responding negatively to warmer temperatures in the UOF. Nevertheless, peak activities observed in OTU from the superfamily Empidoidea (based on BOLD database matches sharing >91% similarity), for example, corresponded closely with those reported in a previous study from Thailand (Plant et al., Reference Plant, Surin, Saokhod and Srisuka2011), with Iteaphila recorded between April and July, and Syndyas recorded between December and February.
Multiple linear regressions indicate the interaction between different anthropogenic forest types (grey = Oil Palm Forest, red = Secondary Reserve Forest, blue = Urban Ornamental Forest) and weather variables.

The proportion of Hemiptera was significantly affected by forest type only whereas the proportion of Hymenoptera was not affected by any of the weather variables or the forest type. The OPF had a significantly greater proportion of Hemiptera OTU (14.1%; of the top five orders), whereas the SRF and UOF had more similar proportions (10.1% and 9.68% respectively). Hemiptera in OPFs includes pest species such as Recilia mica (Delphacidae) (a vector of blast disease) and Leptopharsa gibbicarina (Tingidae) (a vector of Pestalotiopsis; Corley & Tinker, Reference Corley and Tinker2016). Delphacidae and Tingidae were detected in the OPF (based on database matches sharing >91% similarity), but not the SRF or UOF. Throughout a year-long study across different tropical forest ecosystems we have shown that changes in weather have stronger, and often opposite, impacts on arthropod activity found in highly modified forests (particularly UOFs) compared with more natural secondary forest. Changes in ecosystem functioning in anthropogenic forests, as a result of changes in arthropod activity, can have significant links to human well-being, including physical (e.g., food resources, protection from environmental hazards, and medicines) and psychological health (e.g., leisure and recreation) (Haines-Young & Potschin, Reference Haines-Young, Potschin, Raffaelli and Frid2010). Several recommendations have been put forward for the conservation of biodiversity, including arthropods, in anthropogenic forests: limiting the development of new oil palm plantations to non-forested lands (Austin et al., Reference Austin, Kasibhatla, Urban, Stolle and Vincent2015); use of reduced-impact logging methods, including appropriate directional logging, and careful planning of roads and trails to avoid collateral damage (Putz et al., Reference Putz, Zuidema, Pinard, Boot, Sayer, Sheil, Sist, Elias and Vanclay2008); less-intensive logging and maintenance of canopy closure to ensure suitable habitat for shade-requiring species (Putz et al., Reference Putz, Zuidema, Pinard, Boot, Sayer, Sheil, Sist, Elias and Vanclay2008); preservation of trees in urban areas to provide shade and planting drought-tolerant species (Gill et al., Reference Gill, Handley, Ennos and Pauleit2007); green corridors and retaining habitat connectivity (Wilby & Perry, Reference Wilby and Perry2006). Considering that responses to maximum temperature differed by arthropod order as well as forest type, management of tropical biodiversity should also consider taxonomic specific differences when developing conservation strategies.
Supplementary material
The supplementary material for this article can be found at https://doi.org/10.1017/S000748531800010X
Acknowledgements
The authors thank the staff at Ulu Gombak Field Studies Centre and other helpers (Mono, Leong Sow Woon, John Mong Guo An, Yee Yoke Pei Narong Jaturas, Cheah Yih Horng, Daniel Kong Wye Lup, Lim Aik Hean) for insect collections from Malaise traps. M. Sugumaran (coordinator of Rimba Ilmu Botanic Garden), Rosli Hashim (coordinator Ulu Gombak Field Studies Centre) and the owners of the oil palm estates (Got Tuan Tek and Lee Kwu Li) provided permission to deploy the Malaise traps. This work was initiated when BMGJ, KWS, and JJW were at the Institute of Biological Sciences, Faculty of Science, University of Malaya (UM) and was supported by a High Impact Research Grant (Chancellery) from UM to JJW and Lim Phaik Eem. The collaboration between UM and Queen Mary University of London was supported through a Newton-Ungku Omar Institutional Links Grant to ELC and JJW. The collaboration between UM and Monash University Malaysia was coordinated under an MOA.
Competing financial interests
The authors declare no competing financial interests.