

1. Introduction
Microstructural analyses and thermo-barometric estimates in metamorphic pebbles that are included in sedimentary sequences constitute an important investigation key to distinguishing the basement sources of conglomerates (Spalla et al. Reference Spalla, Zanoni, Gosso and Zucali2007). The validity of this innovative method may be tested where the sediments cap metamorphic complexes in which structural and metamorphic evolutions are well deciphered and the boundaries of tectonometamorphic units are well constrained. When applied to metamorphic pebbles, this approach may potentially reveal metamorphic signatures not preserved in the basements that are exposed today. In metamorphic belts the occurrence of mineral and structural records giving evidence of subduction stages decreases with the increase of the orogen age, in relation to the amount of eroded material and the erosion rate (England & Richardson, Reference England and Richardson1977). In very old orogenic belts, the geological record of subduction can be easily obliterated during the thermal rise induced by subsequent continental collision (e.g. Thompson, Reference Thompson1981; Platt, Reference Platt1998; Marotta & Spalla, Reference Marotta and Spalla2007), but may still be preserved in the metamorphic pebbles of late orogenic conglomerates.
The metamorphic evolutions inferred from these pebbles have been compared with those of the different tectonometamorphic units of the Central Southern Alps adjacent to the conglomerates (Fig. 1). We previously described results from metamorphic pebbles occurring in the Dosso dei Galli Conglomerate (Spalla et al. Reference Spalla, Zanoni, Gosso and Zucali2007), and in this contribution we will discuss the results from pebbles of the Aga and Vedello conglomerates; similar data from the Ponteranica Conglomerate will constitute a subsequent paper. Within the lower Permian lithostratigraphic sequence of the Central Orobic Alps (Orobic anticline), the Aga and Vedello conglomerates represent (Fig. 2), after the Basal Conglomerate, the oldest and the richest in metamorphic pebbles (Cadel et al. Reference Cadel, Cosi, Pennacchioni and Spalla1996) deriving from erosion of the Variscan chain and deposited in intramontane elongated troughs (Cassinis & Neri, Reference Cassinis, Neri, Cassinis, Cortesogno, Gaggero, Massari, Neri, Nicosia and Pittau1999).
Tectonic sketch map of the Orobic Alps and types of metamorphic evolution recorded in the basement. DGC – Dosso dei Galli Conglomerate; PF – Ponteranica Formation; DCZ – Domaso-Cortafò Zone; DOZ – Dervio-Olgiasca Zone; MMZ – Monte Muggio Zone; NEOB-A -B -C – North East Orobic basement units A, B and C, respectively; TVB – Tre Valli Bresciane basement; VBB – Val Biandino basement; VVB – Val Vedello basement. P–T–d–t paths (quantitative with solid and qualitative with dashed lines) of the Orobic basement units. Al-silicate (And, Ky, Sil) triple point after Holdaway (Reference Holdaway1971). Circled D1, D2 and D3 correspond to P–T conditions for the assemblages formed during the development of the first, second and third generation of structures; the type of tectonometamorphic unit (TMU) is indicated in parentheses. Inset map: TO – Torino; MI – Milano. (a–e) P–T–d–t paths of: (a) Domaso Cortafò Zone, (b) Monte Muggio zone, (c) Val Vedello basement, (d) unit A of the North East Orobic basement, (e) Dervio Olgiasca Zone; (f–h) qualitative P–T–d–t evolution for (f) Tre Valli Bresciane basement, here inferred after Giobbi Origoni & Gregnanin (Reference Giobbi Origoni and Gregnanin1983) and for units (g) B and (h) C of the North East Orobic basement. Modified after Spalla & Gosso (Reference Spalla and Gosso1999), di Paola, Spalla & Gosso (Reference di Paola, Spalla and Gosso2001) and Spalla et al. (Reference Spalla, Diella, Pigazzini, Siletto and Gosso2006).

Sketch map of Southalpine lower Permian deposits and metamorphic basement along the Central Orobic divide, redrawn from the geological map of Cadel et al. (Reference Cadel, Cosi, Pennacchioni and Spalla1996). Thick dashed line contours the sampled area.

Mineral abbreviations in the text and photomicrographs and figure captions are as in Kretz (Reference Kretz1983), except for white mica (Wm), phengite (Phe) and eastonite (East).
2. Geological setting
The Southalpine Domain is regarded as part of the Alpine orogenic lid (Laubscher, Reference Laubscher, Hatcher, Williams and Zietz1983). Extending to the south of the Insubric Line and between Lake Como and the Adamello Massif, it is composed of pre-Alpine metamorphic rocks and Permian–Mesozoic volcanic and sedimentary sequences (Fig. 1).
The metamorphic basement of the Central Southern Alps consists of two main lithostratigraphic units, the Edolo Schists and Morbegno Gneisses, which are mainly composed of micaschists and gneisses, minor metagranitoids, metabasics, marbles and quartzites. On the basis of local fossil findings and age determinations, an early Palaeozoic age is suggested for the sedimentary protoliths (Gansser & Pantič, Reference Gansser and Pantič1988; Mottana et al. Reference Mottana, Nicoletti, Petrucciani, Liborio, De Capitani and Bocchio1985). Ordovician granitoids are considered the protoliths of Palone di Sopressà meta-intrusives (Beltrami et al. Reference Beltrami, Bianchi, Bonsignore, Callegari, Casati, Crespi, Dieni, Gnaccolini, Liborio, Montrasio, Mottana, Ragni, Schiavinato and Zanettin1971; Bonsignore et al. Reference Bonsignore, Casati, Crespi, Fagnani, Liborio, Montrasio, Mottana, Ragni, Schiavinato and Venzo1971), Monte Fioraro gneisses (Colombo, Siletto & Tunesi, Reference Colombo, Siletto and Tunesi1994; Siletto et al. Reference Siletto, Spalla, Tunesi, Lardeaux, Colombo, von Raumer and Neubauer1993) and Gneiss Chiari (Bergomi, Reference Bergomi2004; Colombo, Siletto & Tunesi, Reference Colombo, Siletto and Tunesi1994). Basement rocks show different dominant metamorphic imprints in adjacent portions, varying from epidote–amphibolite- or amphibolite- to greenschist-facies conditions (Spalla & Gosso, Reference Spalla and Gosso1999) and commonly pre-dating the deposition of Permian–Mesozoic cover sequences (Bocchio et al. Reference Bocchio, Crespi, Liborio and Mottana1980; De Sitter & De Sitter-Koomans, Reference De Sitter and De Sitter-Koomans1949; Milano, Pennacchioni & Spalla, Reference Milano, Pennacchioni and Spalla1988). The mineral assemblages corresponding to these different dominant metamorphic imprints in metapelites are, respectively, BtI, GrtI, WmI, Cld; BtII, GrtII, St, ± Ky, WmII; WmIII, Chl, Ab, ± Ep, ± green BtIII, ± GrtIII. An exception is represented by the Como Lake basement (DCZ; Fig. 1), recording a high-temperature–low-pressure (HT–LP) metamorphic imprint at c. 226 Ma (Diella, Spalla & Tunesi, Reference Diella, Spalla and Tunesi1992; Sanders et al. Reference Sanders, Bertotti, Tommasini, Davies and Wijbrans1996).
Despite the homogeneous and still valid traditionally proposed lithostratigraphy in the basement, five types (I to V) of tectonometamorphic units have been described (Fig. 1), recording different stages of the Variscan convergence (Spalla & Gosso, Reference Spalla and Gosso1999; Spalla et al. Reference Spalla, Zanoni, Gosso and Zucali2007 and references therein):
(1) the subduction-related metamorphic imprint is recorded, at deep crustal levels, in types II and V;
(2) the continental collision-related metamorphic imprint is recorded at deep crustal levels by types I, II and IV;
(3) type III represents shallower Variscan units, characterized by a P/T ratio compatible with a warm subduction or a continental collision;
(4) the Variscan exhumation is recorded in each type, except type IV.
A type IV tectonometamorphic unit underwent a high-temperature exhumation related to the Permian–Triassic lithospheric thinning (Bocchio et al. Reference Bocchio, De Capitani, Liborio, Mottana, Nicoletti and Petrucciani1981; Mottana et al. Reference Mottana, Nicoletti, Petrucciani, Liborio, De Capitani and Bocchio1985; Sanders et al. Reference Sanders, Bertotti, Tommasini, Davies and Wijbrans1996). In this framework, only type V tectonometamorphic units escaped the Barrovian thermal imprint induced by continental collision.
Permian sedimentary sequences of the Central Southern Alps, which overlie crystalline basement units, are well preserved in the Trompia Valley and in the Orobic anticlines (Fig. 1), where roughly coeval lower Permian conglomerates belong to the Collio Formation, Ponteranica and Dosso dei Galli Conglomerate (Cadel et al. Reference Cadel, Cosi, Pennacchioni and Spalla1996; Casati & Gnaccolini, Reference Casati and Gnaccolini1967; Cassinis & Neri, Reference Cassinis, Neri, Cassinis, Cortesogno, Gaggero, Massari, Neri, Nicosia and Pittau1999; Sciunnach, Reference Sciunnach2001). Permian sequences developed during two tectono-sedimentary cycles (Cassinis et al. Reference Cassinis, Massari, Neri and Venturini1988; Italian IGCP 203 Group, 1986; Massari, Reference Massari and Cassinis1988; Massari et al. Reference Massari, Neri, Pittau, Fontana and Stefani1994). The two Permian sequences are separated by an angular unconformity due to a depositional and erosional gap that presumably lasted 14–27 Ma (Casati & Gnaccolini, Reference Casati and Gnaccolini1967; Cassinis et al. Reference Cassinis, Cortesogno, Gaggero, Perotti and Ronchi2007; Cassinis & Neri, Reference Cassinis, Neri, Cassinis, Cortesogno, Gaggero, Massari, Neri, Nicosia and Pittau1999); this unconformity generally marks the boundary between the lower and upper Permian (Barth & Mohr, Reference Barth and Mohr1994; Cassinis & Doubinger, Reference Cassinis and Doubinger1991, Reference Cassinis, Doubinger, Nairn and Korotev1992; Cassinis & Perotti, Reference Cassinis, Perotti, Podemsky, Dybová-Jachowicz, Jaworowski, Jureczka and Wagner1997). The first cycle is represented by a volcaniclastic sequence filling isolated subsiding basins (Fig. 3). The second cycle comprises alluvial fan to shallow marine sediments also capping the structural highs (Assereto et al. Reference Assereto, Bosellini, Fantini Sestini, Sweet, Logan and Hills1973; Cassinis et al. Reference Cassinis, Elter, Rau and Tongiorgi1980; Cassinis et al. Reference Cassinis, Massari, Neri and Venturini1988; Cassinis & Peyronel Pagliani, Reference Cassinis, Peyronel Pagliani and Falke1976). Lower Permian dextral strike-slip tectonics, which affected the whole of Central Southern Europe (Arthaud & Matte, Reference Arthaud and Matte1977; Ziegler, Reference Ziegler1988; Muttoni et al. Reference Muttoni, Kent, Garzanti, Brack, Abrahamsen and Gaetani2003), was responsible for the opening of the first-cycle-related basins during the progressive thinning of the Variscan lithosphere. A thick-skinned south-verging fold-and-thrust system developed under non- to very low-grade metamorphic conditions during Alpine times and controls the present structural setting of the Southern Alps.
Permian sequence and absolute age data of the Western, Eastern Orobic Basin and Trompia Basin in comparison with age data from Lago Maggiore–Luganese and Giudicarie sequences; redrawn after Cassinis & Neri (Reference Cassinis, Neri, Cassinis, Cortesogno, Gaggero, Massari, Neri, Nicosia and Pittau1999). DGC – Dosso dei Galli Conglomerate; AVC – Aga and Vedello conglomerates; PF – Ponteranica Formation. Radiometric data from: Ganna volcano-plutonic association and Montorfano and Mottarone granites (Bakos, Del Moro & Visonà, Reference Bakos, Del Moro and Visonà1990; Cassinis & Neri, Reference Cassinis, Neri, Cassinis, Cortesogno, Gaggero, Massari, Neri, Nicosia and Pittau1999; Pinarelli, Del Moro & Boriani, Reference Pinarelli, Del Moro and Boriani1988; Schaltegger & Brack, Reference Schaltegger and Brack2007); Val Biandino Pluton (Thöni et al. Reference Thöni, Mottana, Delitala, De Capitani and Liborio1992); volcanic rocks in the Collio Formation of the Orobic Alps (Cadel, Reference Cadel1986; Cadel, Fuchs & Meneghel, Reference Cadel, Fuchs and Meneghel1987); Torgola, Navazze and Val di Rango granitoids (De Capitani et al. Reference De Capitani, Delitala, Liborio, Mottana, Rodeghiero and Thöni1994); volcanic rocks in the Collio Formation of the Trompia Basin (Schaltegger & Brack, Reference Schaltegger and Brack2007); Monte Croce granitoids (Rottura et al. Reference Rottura, Del Moro, Caggianelli, Bargossi and Gasparotto1997); Athesian porphyric platform (Cassinis & Neri, Reference Cassinis, Neri, Cassinis, Cortesogno, Gaggero, Massari, Neri, Nicosia and Pittau1999).

2.a. The metamorphic basement of the Permian sedimentary sequence of the central Orobic anticline
The Aga and Vedello conglomerates belong to the lower Permian sequence that non-conformably overlies, or is in tectonic contact with, the Val Vedello basement. This basement is exposed in the central part of the Orobic Alps (Fig. 1), where the Morbegno Gneisses and retrogressed Edolo Schists are intermingled by repeated transposition (Cassinis et al. Reference Cassinis, Dal Piaz, Eusebio, Gosso, Martinotti, Massari, Milano, Pennacchioni, Perello, Pessina, Roman, Spalla, Tosetto and Zerbato1986; Milano, Pennacchioni & Spalla, Reference Milano, Pennacchioni and Spalla1988). It consists mainly of micaschists and paragneisses, which prevail in the Edolo Schists and Morbegno Gneisses lithostratigraphic units, respectively (Fig. 2), and minor metagranitoids deriving from Late Ordovician intrusive protoliths (Pizzo Meriggio Gneisses and Gneiss Chiari), marbles, and metabasics (Cadel et al. Reference Cadel, Cosi, Pennacchioni and Spalla1996). All these rocks occur both in the Morbegno Gneiss and Edolo Schists lithostratigraphic units but recorded a homogeneous structural and metamorphic pre-Alpine evolution; therefore, they constitute a unique tectonometamorphic unit (Diella, Spalla & Tunesi, Reference Diella, Spalla and Tunesi1992; Milano, Pennacchioni & Spalla, Reference Milano, Pennacchioni and Spalla1988).
The two earlier Variscan deformation stages are responsible for the development of S1 and S2 syn-metamorphic foliations, and are followed by two non-metamorphic stages responsible for the formation of the Alpine south-verging thrust belt (Cassinis et al. Reference Cassinis, Dal Piaz, Eusebio, Gosso, Martinotti, Massari, Milano, Pennacchioni, Perello, Pessina, Roman, Spalla, Tosetto and Zerbato1986; Milano, Pennacchioni & Spalla, Reference Milano, Pennacchioni and Spalla1988; Siletto, Reference Siletto1991). In Table 1, amphibolite-facies mineral assemblages, which mark S1 foliation in the Edolo Schists and Morbegno Gneisses, are synthesized together with greenschist-facies parageneses synkinematic with D2 structures (Diella, Spalla & Tunesi, Reference Diella, Spalla and Tunesi1992; Milano, Pennacchioni & Spalla, Reference Milano, Pennacchioni and Spalla1988; Siletto et al. Reference Siletto, Spalla, Tunesi, Lardeaux, Colombo, von Raumer and Neubauer1993). In the metagranitoids, which locally show mylonitic textures, the amphibolite-facies mineral assemblage is composed of Kfs, Wm, red-brown Bt and Grt. Chl and sericite mark the S2 foliation and replace red-brown Bt and Grt, and chessboard Ab replaces Kfs (Cadel et al. Reference Cadel, Cosi, Pennacchioni and Spalla1996). In summary, in the tectonometamorphic evolution of the Val Vedello basement (Fig. 1), the syn-D1 amphibolite metamorphic imprint indicates Variscan collision, while the syn-D2 greenschist re-equilibration developed during the Variscan exhumation (Spalla & Gosso, Reference Spalla and Gosso1999).
Assemblage sequences in the units of the Southalpine basement

Assemblage sequences in each lithostratigraphic unit (columns), and types of tectono-metamorphic unit (rows) of the Southalpine basement. TMUs – tectono-metamorphic units; LSUs – litho-stratigraphic units. *indicates P–T condition estimated from pebbles of the Dosso dei Galli Conglomerate (Spalla et al. Reference Spalla, Zanoni, Gosso and Zucali2007). ‘–’ indicates values not determined.
2.b. Lithostratigraphy of the lower Permian sequence in the central Orobic anticline
The lower Permian sequence (Figs 2, 4) of the Central Orobic Alps filled the eastern part of the Orobic Basin, which was separated from the Trompia Basin by crystalline structural highs and opened by sinistral strike-slip displacement along the paleo-Insubric Line (Cadel, Reference Cadel1986; Cassinis & Perotti, Reference Cassinis and Perotti1994). Within this sequence, the older formation, the Basal Conglomerate, consists of coarse alluvial sediments (Cassinis et al. Reference Cassinis, Dal Piaz, Eusebio, Gosso, Martinotti, Massari, Milano, Pennacchioni, Perello, Pessina, Roman, Spalla, Tosetto and Zerbato1986), mostly made of sandstones, and of conglomerates, which contain quartz and minor micaschist and volcanic pebbles (Cadel et al. Reference Cadel, Cosi, Pennacchioni and Spalla1996; Cassinis et al. Reference Cassinis, Dal Piaz, Eusebio, Gosso, Martinotti, Massari, Milano, Pennacchioni, Perello, Pessina, Roman, Spalla, Tosetto and Zerbato1986).
Schematic section across the Permian deposits in the Eastern Orobic Basin. Dashed lines are dated volcanic sheets: AS – Abete Sheet; NS – Novazza Sheet; URS – Upper Rhyolitic Sheet. AVC – Monte Aga and Val Vedello conglomerates. Redrawn from Cadel (Reference Cadel1986).

The Collio Formation overlies the Basal Conglomerate and is subdivided into two members (Cadel, Reference Cadel1986; Cadel et al. Reference Cadel, Cosi, Pennacchioni and Spalla1996; Cadel, Fuchs & Meneghel, Reference Cadel, Fuchs and Meneghel1987) that filled two subsequent basins, which had different depocentral axes (Cadel, Reference Cadel1986). The lower member mainly consists of acid to intermediate volcanic rocks, which belong to two volcanic cycles (Cadel, Reference Cadel1986; Cadel, Fuchs & Meneghel, Reference Cadel, Fuchs and Meneghel1987), with minor continental clastic sediments. The upper member consists of a thick sequence of lacustrine and alluvial fan sediments with minor evaporite deposits and volcanic rocks. The Aga and Vedello conglomerates are part of these clastic deposits (Cadel et al. Reference Cadel, Cosi, Pennacchioni and Spalla1996). These conglomerates contain sub-angular to sub-rounded pebbles, up to tens of centimetres in size, that consist of metapelites, metagranitoids and mylonitic gneisses, with up to 20% volcanic rocks. These deposits form fining-upward sequences up to 180–200 m thick, of which the lower part is interpreted as debris flows developed in fast-growing alluvial fans. Within these deposits, metric boulders of basement may represent rock falls from active escarpments. Sub-aqueous debris flows or gravity flow fans in shallow lakes constitute the upper part of these sequences. Locally these conglomerates are in contact with the crystalline basement through syn-sedimentary faults (Cadel et al. Reference Cadel, Cosi, Pennacchioni and Spalla1996).
Radiometric data (U–Pb zircon) on volcanic sheets of the lower volcaniclastic cycle provide ages of 287 (AS in Fig. 4) and 280 ± 3 Ma (NS in Fig. 4) (Cadel, Reference Cadel1986; Philippe et al. Reference Philippe, Villemaire, Lancelot, Girod and Mercadier1987). If the air-fall pyroclastic sheet that is interbedded within the upper member lacustrine sediments (URS in Fig. 4) comes from the Lugano area, where rhyolites yield a radiometric age of 278 ± 3 Ma (Hunziker in Cadel, Reference Cadel1986), the whole history of the Collio Formation would have lasted for about 10 Ma (e.g. Schaltegger & Brack, Reference Schaltegger and Brack2007); in particular, the inferred rate of sedimentation suggests that deposition of the upper member lasted for 1 or 2 Ma (Cadel, Reference Cadel1986).
3. Microstructural analysis of metamorphic pebbles
Detailed meso-scale observations on the pebbles of the Aga and Vedello conglomerates, aimed at distinguishing the different metamorphic rocks that fed lower Permian basins, were performed on 130 samples; 39 of them were selected for microstructural analysis, after extensive field surveys, using the geological map of Cadel et al. (Reference Cadel, Cosi, Pennacchioni and Spalla1996) as a reference. Pebbles were sampled along the central Orobic divide between Monte Masoni and Monte Aga and in the Vedello Valley around Pizzo Ceric (Fig. 2), where pebbles are tens of centimetres in size and are mainly metamorphic (micaschists and paragneisses, minor metagranitoids and mylonitic gneisses) (Fig. 5).
(a) Geological panorama of the Pizzo Ceric, showing Aga and Vedello conglomerates (AVC) overlying the Val Vedello basement (VVB); Q – Quaternary deposits. Width of field of view 1.5 km. (b) Examples of metamorphic pebbles, which preserve well the pre-lower Permian geological record; diameter of lens cap 6 cm.

To reconstruct the structural and metamorphic evolutions of the pebbles and compare them with those analysed in the Southalpine tectonometamorphic units, we selected pebbles: (1) sufficiently large to avoid effects of weathering or diagenetic alteration, (2) offering the widest variety of metamorphic lithotypes, mineral assemblages and chemical compositions, and (3) with bulk chemistries most sensitive to metamorphic variations. This sampling strategy maximized recognition of a relative chronology of the metamorphic re-equilibration steps inferred by microstructural analysis to deduce quantitative P–T paths.
Deformational and metamorphic heterogeneities make the record of tectonic events (rock memory) highly discontinuous and are responsible for the occurrence in adjacent domains of undeformed to highly deformed rocks associated with various degrees of metamorphic transformations, which respectively correspond to coronitic, tectonitic and mylonitic textures. These alternating textures reflect low-to-high-strain partitioning that occurs during the same deformation stages, which may generate domains recording a single group of structures (fold, foliation and/or lineation) adjacent to domains recording a superposed group of structures. Such discontinuous rock memory makes time correlation of fabric and metamorphic re-equilibration sequences difficult, even in the case of favourable exposure conditions common in mountain belts (Spalla et al. Reference Spalla, Zucali, di Paola, Gosso, Gapais, Brun and Cobbold2005 and references therein). Superposed fabrics in pebbles obviously do not bear a regional significance because every pebble represents a fragmented basement chip of unknown position within a mosaic of structural imprints. In addition, coeval metamorphic assemblages may mark different planar (S) fabrics in different pebbles, depending on the erosional sampling from the fabric mosaic, which represents single parts of the complete structural and metamorphic evolution. For these reasons, the reconstruction of a relative chronology of superposed structures and their related metamorphic imprints among different pebbles of the same lithotype are inhibited if style and superposed fabric are the only criteria used. Using this preliminary information, our approach consists of the following sequential procedure (see also Spalla et al. Reference Spalla, Zanoni, Gosso and Zucali2007): (1) the relative chronology of fabrics and mineral assemblages in each pebble is inferred by microstructural analysis, based on classical methods currently applied to polydeformed metamorphic rocks (Bell, Rubenach & Fleming, Reference Bell, Rubenach and Fleming1986; Vernon, Reference Vernon2004; Passchier & Trouw, Reference Passchier and Trouw2005); (2) pebbles are grouped by lithological affinity and relative chronology of structures and mineral assemblages, in order to decipher a relative chronology of superposed metamorphic imprints (M1, M2. . .) and consequently reconstruct the metamorphic evolution in each group; (3) the specific metamorphic evolution occurring in each pebble group is compared with those of the rocks of the surrounding tectonometamorphic units to assess the potential sources.
Therefore, in the following microstructural description of basement pebbles, the relative chronology of superposed foliations (S1, S2, S3. . .) or crenulation (D1, D2, D3. . .) used for the deformed rocks is based on the complete match of fabric and mineral assemblage sequences in each group of pebbles. Where mineral growth is not associated with a new fabric, the chronology of coronitic fabrics (C1, C2, C3. . .) is induced by correlation with the tectonitic or mylonitic fabrics marked by equivalent metamorphic assemblages.
In the following, the summary of the main microstructural characters for metapelite and metaintrusive pebbles is reported, and illustrated in Figures 6, 7 and 8. At the end of the description of each group of rocks, the metamorphic assemblages developed during each successive re-equilibration stage (M1, M2. . .) are reviewed. Figure 8 summarizes the fabric and assemblage evolution in metapelite pebbles. Details of the microstructural descriptions with analytical details of relationships among fabric elements and mineral assemblages are supplied in Appendix 1.
Microstructures from (a–d) Bt–Grt–St metapelite pebbles, and from (e, f) Grt–Chl metapelite pebbles. (a) Grt replaced mainly by Chl with an internal foliation continuous with and folded like the external S1; the wavelength is wider in the internal pattern, suggesting a Grt syn-folding growth in type A Bt–Grt–St metapelites; plane polarized light. (b) BtI marking S1 and BtII partially replaced by Chl, which contains an internal foliation suggesting a growth during the folding of S1; plane polarized light. (c) Internal foliations marked by opaque minerals that indicate that Pl pre-dates the S2 crenulation cleavage in type B Bt–Grt–St metapelites; plane polarized light. (d) St, Grt, Wm, Bt assemblages marking S2 in type C; plane polarized light. (e) Three successive foliations marked by Chl and Wm; plane polarized light. (f) Rt, which is rimmed by Ilm, is microfolded in the rock matrix and straight in the Grt. This suggests that Grt pre-dates S2 folding; plane polarized light.

Microstructures from gneiss pebbles. (a) Bt, partially replaced by Chl, shows different lattice preferred orientation, in Bt-bearing mylonitic gneisses; plane polarized light. (b) Microboudinaged Bt with Wm and Chl in the necks in Bt-bearing mylonitic gneisses; backscattered SEM image. (c) Bt site totally replaced by Wm, Chl and sagenitic Rt in type Am metagranitoids; plane polarized light. (d) Kinked WmI preserved between foliation planes marked by WmII and Qtz.

Schematic representation of fabric and assemblage evolution in metapelite and gneiss pebbles of the Aga and Vedello conglomerates. Correlation of deformation–metamorphism relationships between pebbles allows inference of the sequence of M1 and M2 metamorphic imprints (see discussion in the text). The deformation–metamorphism relationships inferred from Grt–Chl metapelites implies three stages of metamorphic re-equilibration (M1, M2 and M3). Relative chronology of superposed fabrics and relative mineral assemblages are referred to single rock types.

3.a. Metapelite pebbles
Metapelite pebbles generally preserve mineral assemblages characteristic of amphibolite-facies conditions (Bt–Grt–St metapelites), but some samples exclusively display mineral associations developed under greenschist-facies conditions (Grt–Chl metapelites).
3.a.1. Bt–Grt–St metapelite pebbles
These pebbles are mainly composed of micaschists and paragneisses with Qtz, Grt, Bt, Pl, Wm, Chl, opaque minerals, minor St, Rt, Ap, Tur, and rare Kfs and Ttn. The number and type of superposed planar fabrics and the mineral assemblages that make up the fabrics have been used to distinguish three types of Bt–Grt–St metapelites: type A with two pervasive foliations, type B with a pervasive foliation and a following crenulation (in places associated with an incipient crenulation cleavage), and type C with two pervasive foliations and a successive crenulation.
Type A contains a pervasive crenulated S1 foliation marked by WmI, BtI, Rt/Ilm and opaque minerals; the shape preferred orientation of PlI, where present, is parallel to S1. WmII, Ilm, BtII, PlII are synkinematic to S1 folding (D2), whereas Grt growth is pre- to synkinematic with respect to D2 (Fig. 6a, b). Chl, WmIII, Pl, sagenitic Rt, ± Ttn and ± Kfs developed in coronas (C3) at the expense of the previous mineral assemblages and post-date S1 and D2 crenulation.
Type B is characterized by a crenulated S1 foliation and a following incipient S2 crenulation cleavage. WmI, St, Bt, Rt/Ilm, Pl are synkinematic to S1 foliation (Fig. 6c), and Grt is pre- to syn-S1 development. WmII, Chl and Pl are synkinematic to S2 cleavage.
Type C mainly contains two foliations (S1 and S2). S2 is crenulated, and the D3 microfolds vary from open to tight. S1 is highly transposed during D2 and is rarely preserved in isoclinal folds within S2 microlithons. WmI, ± BtI, Rt, and opaque minerals mark S1; WmII, BtII, ± St, ± Ky(?), Ilm, Pl are synkinematic with respect to S2; Grt is pre- to synkinematic with respect to S2 development and shows rational grain boundaries with St (Fig. 6d). WmIII, Chl, Tur are synkinematic with D3 folding and with the rare development of S3 foliation; WmIII often occurs as a reaction rim of amphibolite-facies minerals.
The main microstructural characters observed in Bt–Grt–St metapelite pebbles and analytically described in Appendix 1, allow correlation of structures and related metamorphic imprints of the different pebble groups (Fig. 8). S2 crenulation cleavage in type A may be correlated with the pervasive S1 foliation in type B, while the pervasive S1 fabric in type A may be correlated with the relict S1 foliation in type C. The incipient S2 foliation in type B may be equivalent to the incipient S3 foliation in type C and contemporaneous with the coronitic assemblage C3 in type A. These correlations indicate a relative chronology of two mineral assemblages differently recorded in the three types of Bt–Grt–St metapelites: (M1) Qtz, Wm, Grt, Bt, Pl, ± St, ± Ky(?), Rt/Ilm; (M2) Qtz, Wm, Chl, sagenitic Rt, ± Tur, ± Pl, ± Kfs, ± Ttn, ± Sd. The first mineral assemblage is characteristic of amphibolite-facies conditions, while the second is characteristic of greenschist-facies conditions. The M1 assemblage is associated with tectonitic fabrics and is stable during the development of a crenulation cleavage (two superposed foliations), whereas M2 is associated with both coronitic and tectonitic fabrics, the latter consisting of a microfolding locally associated with an incipient axial plane foliation (Fig. 8).
3.a.2. Grt–Chl metapelite pebbles
These pebbles contain Qtz, Wm, Pl, Grt, Chl, Rt, Ilm, Tur and generally preserve up to three superposed foliations (Fig. 6e), the first of which (S1) is isoclinally folded between the differentiated films of the pervasive S2. An incipient, spaced crenulation cleavage (S3) is the trace of a D3 microfolding. S1 is coeval to WmI, and ChlI growth but is occasionally lacking; S2 foliation development is associated with Grt, PlI, WmII, ChlII, Rt/Ilm (Fig. 6f), and S3 is synkinematic with WmIII, ChlIII, Ab, Tur.
From the relationships between mineral growth and development of superposed fabrics, three successive greenschist-facies mineral assemblages can be deduced. These are M1: Qtz, WmI, ChlI; M2: Qtz, WmII, ChlII, Rt/Ilm, Grt, PlI; M3: Qtz, WmIII, ChlIII, Ab, Tur.
3.b. Gneiss pebbles
Gneissic pebbles consist of Bt-bearing mylonitic gneisses and metagranitoids.
3.b.1. Bt-bearing mylonitic gneisses
These are clearly distinguished from other pebbles by the abundance of Bt and their pervasive mylonitic foliation. In addition to Bt, in these rocks Qtz, Wm, Pl, Rt, Chl, and rare Ap and Ttn occur. The mylonitic foliation developed during the growth of Chl, WmII, sagenitic Rt and Ttn. Bt, WmI, Pl, and Rt are pre-mylonitic (Fig. 7a, b). WmIII grew mimetically on Pl.
The observed microstructural features highlight two successive mineral assemblages: M1: Qtz, Bt, Wm, Pl, Ap, Rt; M2: Qtz, Wm, Chl, sagenitic Rt, Ttn. M1 is compatible with amphibolite-facies conditions and pre-dates the mylonitic foliation marked by the M2 greenschist-facies mineral assemblage.
3.b.2. Metagranitoid pebbles
Metagranitoid pebbles mainly consist of Kfs, Pl, Wm, Chl, Ap and very rare Bt. They record an incipient foliation, mainly underlined by the shape preferred orientation of Kfs, Pl, Wm and elongated Qtz grains. These rocks are of two types, distinguished on the basis of grain size and occurrence of relict Bt.
Type Am: Type Am rocks are medium- to fine-grained foliated metagranitoids that preserve relict Bt, Pl and Kfs porphyroclasts (Fig. 7c). Wm occurs in relict grains of WmI or in thin crystals (WmII) marking the foliation, together with Ab and Chl.
Type Bm: These are coarse-grained foliated metagranitoids without either Bt or its reaction products. As in the type Am, Kfs, Pl and WmI porphyroclasts are wrapped by the foliation (Fig. 7d) marked by the shape preferred orientation of WmII and Qtz recrystallized aggregates.
The microstructural characters of these rocks indicate the existence of two successive metamorphic mineral assemblages. These are M1: Qtz, Kfs, Pl, Wm, ± Bt, compatible with amphibolite-facies conditions; M2: Qtz, Ab, Wm, ± Chl, ± sagenitic Rt, compatible with greenschist-facies re-equilibration.
4. Pebbles of the Aga and Vedello conglomerates compared with Southalpine basement rock
Most of the pebbles from the Aga and Vedello conglomerates display lithotypes and mineral assemblages similar to those occurring in the adjacent Val Vedello basement.
In the Bt–Grt–St metapelite pebbles, micro-structures are closely comparable with those of the Val Vedello basement rocks. Among these pebbles, the most retrogressed and phyllosilicate-rich samples could derive from the Edolo Schists of this basement unit, while type C pebbles show microstructures similar to those of the Morbegno Gneisses. In type C, the lack of Ky, which seldom occurs in the Morbegno Gneisses presently exposed in the Val Vedello basement (Milano, Pennacchioni & Spalla, Reference Milano, Pennacchioni and Spalla1988), may be due to a complete replacement during greenschist-facies retrogression (Table 1) in the rock volume sampled in the pebbles. In the Bt–Grt–St metapelite pebbles, a similar sequence of mineral assemblages that reflects the same sequence of metamorphic re-equilibration of the adjacent Val Vedello basement rocks (type I TMU: Diella, Spalla & Tunesi, Reference Diella, Spalla and Tunesi1992) is preserved. Pebbles of Bt-bearing mylonitic gneisses display microstructures and mineral growth relationships very similar to those of the mylonitic rocks of the basement (Milano, Pennacchioni & Spalla, Reference Milano, Pennacchioni and Spalla1988). Coarse-grained and fine-grained metagranitoids have mineral assemblages and microstructures very similar to that of Gneiss Chiari and the Pizzo Meriggio Gneisses (Cadel et al. Reference Cadel, Cosi, Pennacchioni and Spalla1996; Milano, Pennacchioni & Spalla, Reference Milano, Pennacchioni and Spalla1988), respectively.
Despite these similarities, the mineral assemblage sequence of the Grt–Chl metapelite reflects a metamorphic evolution developed exclusively within greenschist-facies conditions. Indeed, this evolution has never been described in the adjacent Val Vedello rocks and closely resembles that of tectonometamorphic units B and C exposed in the North East Orobic basement (S. Ceriani, unpub. thesis, Univ. Milano, 1994; Gansser & Pantič, Reference Gansser and Pantič1988; Spalla & Gosso, Reference Spalla and Gosso1999). The only difference with respect to the rocks of these basement tectonometamorphic units is the lack of Bt in the analysed pebbles (Table 1).
Therefore, pebbles from the Aga and Vedello conglomerates record two different types of metamorphic evolution: Type 1 matches that of the Val Vedello basement tectonometamorphic unit and Type 2 is similar to those of the shallower-level North East Orobic basement B and C tectonometamorphic units. The match between Type 1 pebble metamorphic evolution and that of the Val Vedello basement is corroborated by the following differences or similarities with the rocks belonging to the other tectonometamorphic units identified in the Central Southern Alps: (1) in pebbles recording Type 1 evolution (Fig. 8), the St-bearing assemblage is comparable with the St-bearing assemblages post-dating the Cld-bearing or pre-dating Bt–Sil-bearing assemblages, respectively, in type II or type IV tectonometamorphic units (Table 1); (2) in this group of pebbles the Barrovian imprint is recorded during temperature peak and pressure corresponding to temperature peak (T max–P Tmax) conditions, as well as in type I and II tectonometamorphic units of the Central Southern Alps, but escaped the metamorphic imprint responsible for the development of the Bt–Sil-assemblage recorded in type IV tectonometamorphic unit; (3) the Cld-bearing assemblages recorded in the type II tectonometamorphic units have not been detected in the Aga and Vedello pebbles.
Because the latest greenschist-facies metamorphic conditions and the related structural reworking affecting the pebbles are not occurring in the non-metamorphic conglomerate matrix (Fig. 5), the minimal age of the greenschist-facies imprint can be dated around 278 ± 3 Ma on the basis of radiometric age determination on volcanic rocks interlayered in these conglomerates (see Fig. 4).
5. Mineral chemistry
Major-element mineral compositions of pebbles from Aga and Vedello conglomerates have been determined with an automated WDS and EDS SEM-microprobe system. Analytical conditions and representative analyses are listed in the notes to Table 2. Mineral compositions of the Aga and Vedello conglomerate pebbles are compared with those of the adjacent Val Vedello schists (Diella, Spalla & Tunesi, Reference Diella, Spalla and Tunesi1992) and with the mineral composition of unit A of North East Orobic basement and Monte Fioraro metagranitoids (Colombo, Siletto & Tunesi, Reference Colombo, Siletto and Tunesi1994; Spalla et al. Reference Spalla, Carminati, Ceriani, Oliva and Battaglia1999).
Selected mineral micro-chemical analyses

The SEM-EDS and the WDS-microprobe systems operating at the ‘A. Desio’ Earth Science Department of Milan University have been used: the accelerating voltage was 15 kV and the sample current 190 pA and 15 nA respectively. Natural silicates have been used as standards; matrix corrections have been calculated by a ZAF procedure. The proportional formulas have been elaborated by MinTab (Rock & Carroll, Reference Rock and Carroll1990) and Hyper-Form (de Bjerg, Mogessie & Bjerg, Reference de Bjerg, Mogessie and Bjerg1992) programs. Stoichiometric ratios of elements based on: 22 oxygens for Bt and Wm, 12 oxygens for Grt, 8 oxygens for feldspars, 28 oxygens for Chl and 46 oxygens for St. Content of trivalent iron was calculated for Grt, whereas for all other Fe-bearing minerals it was assumed to be Fe2+.
White mica (Fig. 9a): In Bt–Grt–St metapelites, syn-M1 and syn-M2 Wm have similar Pg (Na/Na+Ca+K) content (0.09 and 0.30) and Si4+ values (atoms per formula unit: apfu) varying between 6.20–6.43 and 6.01–6.15, respectively. In the Grt–Chl metapelites, syn-M1 and syn-M2 Wm have similar Si4+ content (6.10 to 6.49) and Pg content (0.13 to 0.34). Some Pg-rich compositions (Pg = 0.82–0.85) have been detected in these two groups of Wm. Syn-M3 Wm shows Si4+ and Pg contents ≤ 6.30 apfu and ∼ 0.06, respectively. The Wm composition of the Val Vedello basement schists is similar to the composition of Wm from the Bt–Grt–St metapelite pebbles. Syn-M1 Wm in Bt-bearing mylonitic gneisses has Si4+ content (6.50–6.60) higher than syn-M2 Wm (5.99–6.30), contrary to Pg content that is lower in syn-M1 (0.07–0.09) than in syn-M2 (0.15–0.24) Wm. In metagranitoids, syn-M1 Wm has Si4+ values (6.53–6.63) higher than syn-M2 (6.11–6.29), whereas Pg in syn-M1 (0.07–0.11) is lower than in syn-M2 (0.10–0.14) Wm. Syn-M1 Wm in mylonitic gneisses and metagranitoids has Si4+ contents higher than Wm in the Monte Fioraro and unit A of the North East Orobic basement metegranitoids.
Variations of chemical compositions of the main mineral phases: (a) Wm compositions; (b) Grt from metapelite pebbles; grey arrows indicate core/rim compositional zoning in Grt from Grt–Chl metapelites; (c) example of compositional zoning in Grt from Grt–Chl metapelites; (d) composition of Bt from Bt–Grt–St metapelites and from Bt-bearing mylonitic gneisses; (e) composition of Chl.

Garnet (Fig. 9b, c): Grt in the Grt–Bt–St metapelites shows a narrower compositional variation (Alm = 0.69–0.77; Prp = 0.10–0.15; Sps = 0.06–0.11; Grs + Adr = 0.02–0.12) than in the Grt–Chl metapelites. In the latter, Alm (0.48–0.80) and Prp (0.02–0.11) increase and Sps (0.02–0.31) and Grs + Adr (0.11–0.21) decrease from core to rim (Fig. 9b, c). Grt from Bt–Grt–St metapelites plots in the compositional field of Grt from the Val Vedello basement schists (Fig. 9b), in contrast to Grt from Grt–Chl metapelites.
Biotite (Fig. 9d): Bt compositions from pebbles of Grt–Bt–St metapelites (Fe = 2.13–2.85 apfu; Mg = 1.86–2.76 apfu; Ti = 0.14–0.23 apfu; Altot = 3.39–3.91 apfu) plot in the compositional field of Val Vedello schists Bt. XMg varies between 0.46 to 0.50 with Mn content ≤ 0.02 apfu; variations in Ti content reflect various degrees of Bt re-equilibration, highlighted by Rt exsolution. In Bt-bearing mylonitic gneisses, Bt has higher Fe (3.64–4.62 apfu) and Ti (0.19–0.30 apfu) contents and similar Altot (3.30–3.61 apfu) values with respect to the Bt from metapelite pebbles. This Bt is richer in Fe and Mn than Bt from metagranitoids of the Monte Fioraro and unit A of the North East Orobic basement.
Chlorite (Fig. 9e): In Bt–Grt–St metapelites, XFe in Chl varies from 0.48 and 0.71. In Grt–Chl metapelites, Chl shows a gradual increase of XFe from ChlI (0.58–0.62) to ChlII (0.60–0.69) to ChlIII (0.68–0.71), while Altot content (apfu) is higher in ChlII (5.57–6.16) than in ChlI (5.58–5.71) and in ChlIII (4.94–5.39). In Bt-bearing mylonitic gneisses, Chl is characterized by XFe ∼ 0.70 and Altot ∼ 4.90; in metagranitoids XFe is ∼ 0.90 and Altot ∼ 5.60.
Feldspar: In Bt–Grt–St metapelites, syn-M1 Pl is oligoclase (Ab = 0.81–0.90; An = 0.08–0.18; Or = 0.00–0.04), similarly to that of Val Vedello schists. Syn-M2 Pl in Grt–Chl metapelites varies from oligoclase to albite (Ab = 0.84–0.96; An = 0.02–0.16; Or = 0.00–0.04), while syn-M3 Pl is albite (Ab = 0.98–1.00; An = 0.00–0.01; Or = 0.00–0.01). In Bt-bearing mylonitic gneisses, syn-M1 Pl composition ranges from oligoclase to albite (Ab = 0.79–0.99; An = 0.00–0.19; Or = 0.00–0.05), whereas in metagranitoids analysed plagioclase is re-equilibrated during M2 (Ab = 0.94–1.00; An = 0.00–0.03; Or = 0.00–0.06); Kfs composition is quite homogeneous (Ab = 0.05–0.12; An = 0.00; Or = 0.88–0.95).
Staurolite: Fe (2.30–2.85 apfu) and Zn (0.01–029 apfu) contents, respectively, slightly decrease and increase from core to rim as well as in St of Val Vedello schists.
6. P–T estimates and metamorphic evolution
As described in the microstructural analysis paragraph, a single pebble can preserve markers of different mineral and structural re-equilibration stages. The reconstruction of the chronological relationships between mineral growth and fabric evolution allowed the discrimination of mineral assemblage sequences (Fig. 8) and the selection of favourable microstructural sites for inferring P–T conditions of each metamorphic re-equilibration stage. On the basis of the microstructural analyses presented here, the univariant equilibria characterizing the reaction path (Figs 10, 11), the estimate of P–T conditions for each metamorphic stage and the reconstruction of P–T paths may be inferred.
P–T path inferred for type 3 of Bt–Grt–St metapelite pebbles. Grey lines indicate univariant reaction curves calculated by THERMOCALC (Holland & Powell, Reference Holland and Powell1998), and black lines indicate univariant reaction curves calculated by Perple_X (Connolly, Reference Connolly1990). Vertical and horizontal dashed lines delimit the temperature and pressure ranges estimated with independent thermometers and barometers (see text and Table 3 for details). Thermometers: Ti in Bt = content of Ti in biotite (Henry, Guidotti & Thomson, Reference Henry, Guidotti and Thomson2005); Grt–St = garnet–staurolite (Perchuk, Reference Perchuk1989); AlIV Chl = AlIV in chlorite (Cathelineau, Reference Cathelineau1988); AlIV v. XFe Chl = AlIV versus XFe in chlorite (Jowett, Reference Jowett1991). Barometers: GPMQ – garnet–plagioclase–muscovite–quartz (Hodges & Crowley, Reference Hodges and Crowley1985); GPBQ – garnet–plagioclase–biotite–quartz (Hoisch, Reference Hoisch1990); GPBMQ – garnet–plagioclase–biotite–muscovite–quartz (Hoisch, Reference Hoisch1990).

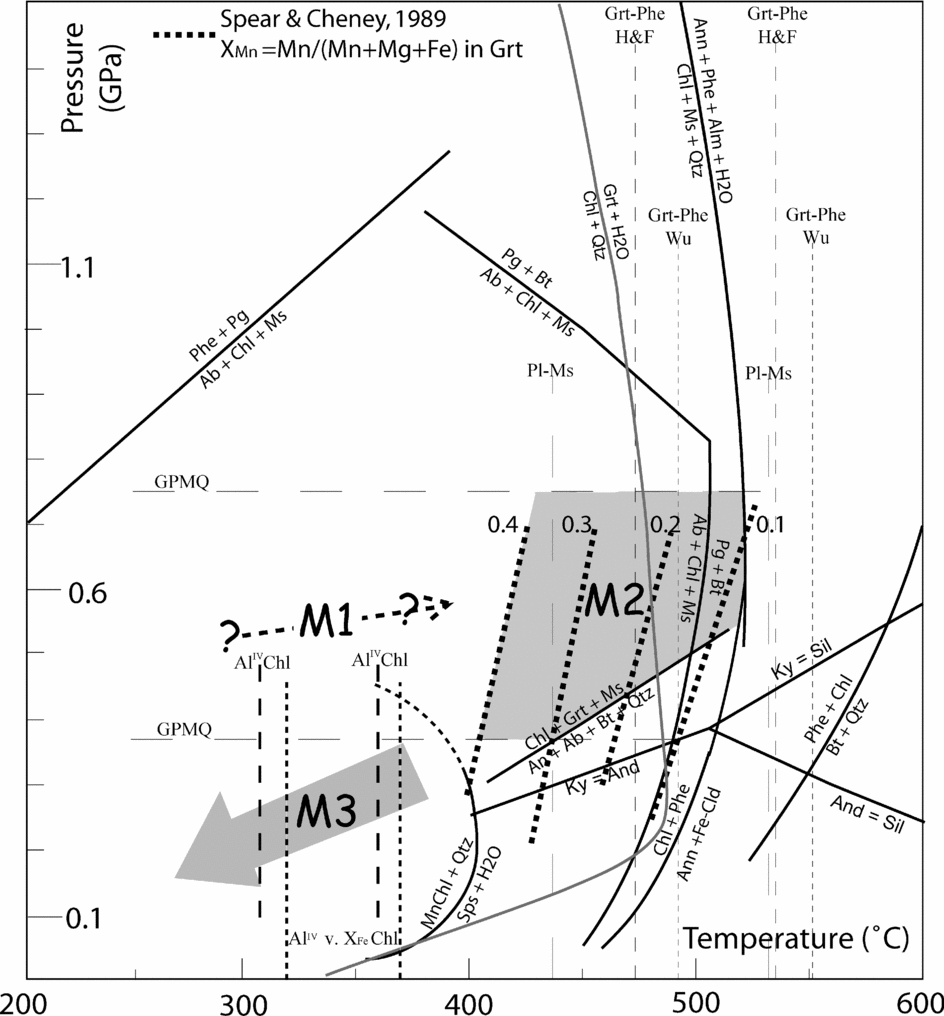
P–T path inferred for Grt–Chl metapelite pebbles. Grey line indicates univariant reaction curves calculated by THERMOCALC (Holland & Powell, Reference Holland and Powell1998), and black lines indicate univariant reaction curves calculated by Perple_X (Connolly, Reference Connolly1990). Vertical and horizontal dashed lines delimit the temperature and pressure ranges estimated with independent thermometers and barometers (see text and Table 3 for details). Thick black dotted lines indicate XMn isopleths in garnet (Spear & Cheney, Reference Spear and Cheney1989). Thermometers: Grt–Phe H&F – garnet–phengite (Hynes & Forest, Reference Hynes and Forest1988); Grt–Phe Wu = garnet–phengite (Wu et al. Reference Wu, Wang, Yang, Geng and Liu2002); Pl–Ms = plagioclase–muscovite (Green & Usdansky, Reference Green and Usdansky1986); AlIV Chl = AlIV in chlorite (Cathelineau, Reference Cathelineau1988); AlIV v. XFe Chl = AlIV versus XFe in chlorite (Jowett, Reference Jowett1991). Barometers: GPMQ = garnet–plagioclase–muscovite–quartz (Hodges & Crowley, Reference Hodges and Crowley1985).
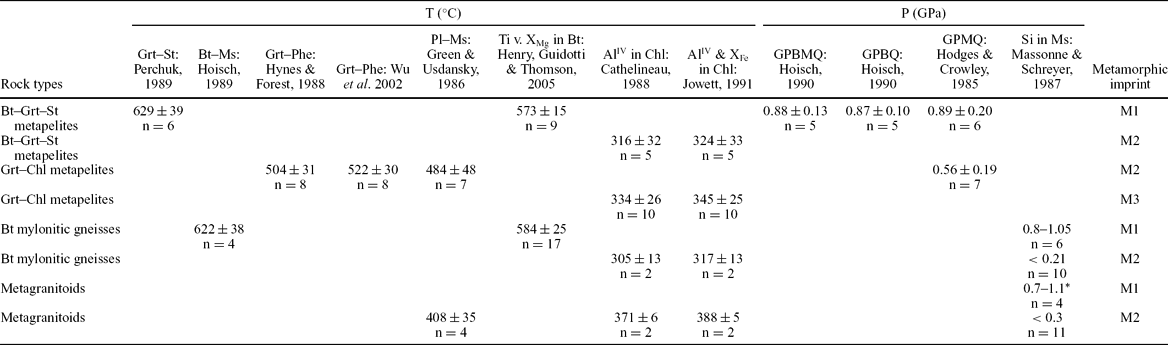
P–T conditions (Table 3) have been estimated using well-calibrated independent thermometers and barometers. Geothermometers were based on Fe–Mg and Na–K exchange reactions or based on the Ti content of Bt and on the AlIV and XFe content of Chl, and geobarometers on net transfer reactions and on the Si4+ content in Wm. In Table 3, the number of estimates (n) is reported plus or minus the standard deviation for each calibration. In addition, univariant equilibria have been calculated for metapelites by THERMOCALC (Holland & Powell, Reference Holland and Powell1998), taking into account the end-member activity of mineral phases, and by Perple_X (Connolly, Reference Connolly1990).
Thermo-barometrical estimates for metamorphic pebbles of Aga and Vedello conglomerates are shown with standard deviation and the number (n) of estimates
6.a. Metapelite pebbles
In the Bt–Grt–St metapelites, recording Type 1 metamorphic evolution, thermometric estimates (Table 3) deciphered by Fe–Mg exchange between St and Grt (Perchuk, Reference Perchuk1989) yield temperatures of 629 ± 39 °C for the M1 metamorphic imprint. These temperatures match the range of 500 to 650 °C estimated by the Ti content in Bt (Schreurs, Reference Schreurs1985); the Ti content v. XMg in Bt yields 573 ± 15 °C (Henry, Guidotti & Thomson, Reference Henry, Guidotti and Thomson2005). These temperature estimates are coherent with the calculated reaction St + Qtz that limits the M1 field at T < 670 °C and with the reaction curve Cld + Qtz = Grt + St + H2O that constrains the M1 field at T ≥ 580 °C (Fig. 10). The application of GPBMQ (Grt–Pl–Bt–Ms–Qtz) (Hoisch, Reference Hoisch1990), GPBQ (Hoisch, Reference Hoisch1990) and GPMQ (Hodges & Crowley, Reference Hodges and Crowley1985) net transfer barometers yields pressures between 0.87 ± 0.10 and 0.89 ± 0.20 GPa (Table 3). For the M2 greenschist-facies re-equilibration stage, temperatures are constrained between 316 ± 32 and 324 ± 33 °C by AlIV and XFe content in chlorite (Cathelineau, Reference Cathelineau1988; Jowett, Reference Jowett1991). This field is limited by the reactions Mu + Bt + Qtz = Kfs + Chl and Prl = And + Qtz + H2O at pressures between 0.5 GPa and 0.1 GPa (Fig. 10).
In the Grt–Chl metapelites, carrying Type 2 metamorphic evolution, microstructural analysis indicates that these rocks recorded three mineral re-equilibration steps under greenschist-facies conditions. Pressure and temperature conditions for the first re-quilibration stage M1 are not easily constrained because of the poor mineral assemblage. The lack of Grt in the M1 mineral assemblage suggests that temperatures were lower than those achieved during the M2 stage. The compositions of ChlI and ChlII indicate temperatures higher than those characterizing the calibration of Cathelineau (Reference Cathelineau1988). In addition, the occurrence of Grt may buffer the Al-content of Chl. For the M2 assemblage, the Fe–Mg exchange between Grt and Phe gives T-values of 504 ± 31 °C (Hynes & Forest, Reference Hynes and Forest1988) and of 522 ± 30 °C (Wu et al. Reference Wu, Wang, Yang, Geng and Liu2002). The ion exchange reaction between Pl–Ms yields temperatures of 484 ± 48 °C (Green & Usdansky, Reference Green and Usdansky1986). These temperatures match the calculated reaction curves showing the appearance of Chl + Ms + Qtz and of Ab + Chl + Ms (Fig. 11). The pressure for the M2 field is constrained by the reaction curve Chl + Grt + Ms = An + Bt + Qtz and by the GPMQ barometer (Hodges & Crowley, Reference Hodges and Crowley1985) at values of 0.56 ± 0.19 GPa. XMn isopleths (Spear & Cheney, Reference Spear and Cheney1989), according to the decrease of Mn from core to rim of Grt (Fig. 9c), suggest a T-prograde path during M2. The AlIV and XFe contents in ChlIII indicate temperatures for M3 (Cathelineau, Reference Cathelineau1988; Jowett, Reference Jowett1991) ranging between 334 ± 26 and 345 ± 25 °C (Table 3). These estimates agree with the experimentally determined break-down of Mn-rich garnet (Sps + H2O = MnChl + Qtz: Hsü, Reference Hsü1968).
6.b. Gneiss pebbles
In the Bt-bearing mylonitic gneisses, the Fe–Mg exchange reaction among Bt–Ms (Hoisch, Reference Hoisch1989) gives temperatures of 622 ± 38°C for the stability field of the M1 assemblage. These estimates are coherent with Ti content in Bt (Schreurs, Reference Schreurs1985), which indicates temperatures between 500 and 650 °C, and with the Ti content v. XMg in Bt (Henry, Guidotti & Thomson, Reference Henry, Guidotti and Thomson2005) that yields T = 584 ± 25°C (Table 3). Si4+ content in Wm constrains pressure for the M1 stage at 0.8–1.05 GPa and for M2 stage at less than 0.2 GPa, taking into account T-values of 305 ± 13 °C and 317 ± 13 °C (Table 3) estimated by AlIV and XFe content in Chl (Cathelineau, Reference Cathelineau1988; Jowett, Reference Jowett1991).
In metagranitoids and Bt-bearing mylonitic gneisses, the Si4+ content of syn-M1 Wm indicates pressures of 0.65–1.1 GPa, taking into account the occurrence of Bt in the M1 assemblage (Bt-in at 420–450 °C) and the Wm break-down (T < 700 °C). The complete Bt replacement observed in these samples inhibits better constraint on T (asterisk in Table 3). For the M2 assemblage, the Ms–Pl thermometer (Green & Usdansky, Reference Green and Usdansky1986) indicates T = 359 ± 42 °C, and the AlIV and XFe content in Chl (Cathelineau, Reference Cathelineau1988; Jowett, Reference Jowett1991) gives temperatures between 371 ± 6 and 388 ± 5 °C. Syn-M2 Wm indicates pressure lower than 0.3 GPa for M2 assemblages (Table 3).
The estimated P–T conditions for the different groups of pebbles have been plotted on the P–T grid showing the metamorphic-facies fields (Peacock, Reference Peacock1993). The P–T conditions for M1 and M2 assemblages in pebbles of Bt-bearing mylonitic gneisses are comparable with those of M1 and M2 in Bt–Grt–St metapelites (Fig. 12). The pressure conditions estimated for metagranitoids are scattered on a large P-interval with respect to those estimated for Bt–Grt–St metapelites and Bt-bearing mylonitic gneisses because of the large estimated temperature interval (Table 3). Therefore, the Bt–Grt–St metapelite and Bt-gneiss pebbles underwent a homogeneous P–T evolution (Type 1). The P–T evolution in the Grt–Chl metapelite pebbles (Type 2) is markedly different from that of Type 1 because it developed entirely in greenschist facies with a thermal peak under remarkably lower pressure (Fig. 12). The uncertainty of M1 P–T estimates for metagranitoid pebbles makes the attribution of their metamorphic evolution to Type 1 or Type 2 difficult.
Comparison of thermo-barometric estimates inferred for the different types of pebbles sampled in the Aga and Vedello conglomerates. The P–T fields are plotted on the metamorphic facies grid by Peacock (Reference Peacock1993) (GN – granulite facies; AM – amphibolite facies; EP – epidote-amphibolite facies; EC – eclogite facies; EB – epidote–blueschist facies; LB – lawsonite–blueschist facies; GS – greenschist facies; PA – pumpellyite–actinolite facies; LC – lawsonite–chlorite facies; PP – prehnite–pumpellyite facies; ZE – zeolite facies; PrA – prehnite–actinolite facies). The inset shows a comparison between P–T paths inferred for the Aga and Vedello conglomerates metamorphic pebbles, quantitative P–T–d–t paths inferred for the Val Vedello basement and the unit A of the North East Orobic basement (Diella, Spalla & Tunesi, Reference Diella, Spalla and Tunesi1992; Spalla et al. Reference Spalla, Carminati, Ceriani, Oliva and Battaglia1999) and with qualitative metamorphic evolution of units B and C of the North East Orobic basement (Spalla & Gosso, Reference Spalla and Gosso1999 and references therein). In grey: geotherms after Cloos (Reference Cloos1993), calculated for: 1 = high T/P ∼ 60 °C km−1 near spreading ridges or active arc volcanoes; 2 = normal geothermal gradients, ∼ 25 °C km−1 of old (> 25 Ma) plate interiors; 3 = high P/T, ∼ 10 °C km−1 ‘warm’ subduction zones; 4 = ‘cold’ subduction zones ∼ 6 °C km−1.

The Type 1 P–T evolution in pebbles (Type 1 pebbles) matches with the quantitative P–T–d–t path of the adjacent Val Vedello tectonometamorphic unit (Diella, Spalla & Tunesi, Reference Diella, Spalla and Tunesi1992), whereas the Type 2 P–T evolution (Type 2 pebbles) is similar to the qualitative P–T path of the tectonometamorphic units B and C of the North East Orobic basement (S. Ceriani, unpub. thesis, Univ. Milano, 1994) (inset of Fig. 12). The two different types of P–T evolution recorded by the analysed pebbles indicate that the Aga and Vedello conglomerates were fed by two different basement sources, recording different metamorphic evolutions and therefore representing two different tectonometamorphic units.
7. Discussion and conclusions
The comparison between the P–T paths inferred in pebbles of the Aga and Vedello conglomerates with the P–T–d–t paths deduced in the Central Southern Alps crystalline basement is crucial to determining the potential tectonometamorphic units that acted as basement sources and consequently locating the provenance area of the clasts.
The quantitative P–T–d–t paths of type I of the Val Vedello tectonometamorphic unit (Diella, Spalla & Tunesi, Reference Diella, Spalla and Tunesi1992) and the qualitative P–T–d paths of type III tectonometamorphic unit B and C of the North East Orobic basement (Gansser & Pantič, Reference Gansser and Pantič1988; S. Ceriani, unpub. thesis, Univ. Milano, 1994) are respectively comparable with the Type 1 and 2 metamorphic evolution recorded in pebbles. The two tectonometamorphic units consist of metapelites with St-bearing and with Grt- and Chl-bearing assemblages, respectively. The two different types of P–T evolution indicate that the Aga and Vedello conglomerates were fed by two different metamorphic basement sources. The inset of Figure 12 shows that the P–T evolution of Type 1 pebbles matches well the quantitative P–T path of the Val Vedello tectonometamorphic unit, while the P–T evolution of Type 2 pebbles is closer to the qualitative P–T evolution of units B and C of the North East Orobic basement. These comparisons suggest that the most likely basement source for Type 1 pebbles was the portion of the Val Vedello basement already exposed to erosion in early Permian times and constituting today the basement underlying the Aga and Vedello conglomerates. This also agrees with the close lithological and mineral assemblages matching with the adjacent Val Vedello basement rock types and with the lack of a Cld-bearing metamorphic assemblage (epidote amphibolite facies) pre-dating the St-bearing assemblage (amphibolite facies), which occurs instead in unit A of the North East Orobic basement (Spalla et al. Reference Spalla, Carminati, Ceriani, Oliva and Battaglia1999).
In Type 2 pebbles, the correspondence of the lithological and mineral assemblages with those of the basement rocks from the tectonometamorphic units B and C of the North East Orobic basement, suggests that these units could be their source. This may be confirmed by the estimated P–T path in Type 2 pebbles that is comparable with the qualitative P–T evolution of units B and C of the North East Orobic basement (inset of Fig. 12). In this view, Type 2 pebbles could represent detrital materials deriving from fluvial transport from the present North East Orobic basement (see Fig. 1 for location) or represent detrital remains of a tectonic unit exposed during early Permian times in the present Vedello Valley area and now completely eroded. This latter possibility is supported by the sedimentological characters that suggest that these conglomerates, which represent detritus from exposed fault escarpments, were subjected to a very short distance of transport (Cadel et al. Reference Cadel, Cosi, Pennacchioni and Spalla1996).
These arguments suggest also that the Alpine convergence that is responsible for the south-verging thrust-and-fold belt in the Southern Alps in this area should not have caused a wide displacement between the sedimentary cover and related basement units, along the main tectonic contacts.
The lack of a metamorphic imprint in the conglomerate matrix indicates that the Aga and Vedello conglomerate age, around 278 Ma (see discussion in Cadel, Reference Cadel1986), represents the minimum exhumation age for its basement sources. The lithological and metamorphic affinities between Type 1 pebbles and Val Vedello basement rocks may indicate that the geological history recorded by these pebbles is referable to the Variscan evolution because radiometric data for the amphibolite-facies imprint in type I tectonometamorphic unit assemblages are around 330 Ma (Siletto et al. Reference Siletto, Spalla, Tunesi, Lardeaux, Colombo, von Raumer and Neubauer1993).
Thermo-barometric estimates in Type 1 pebbles, as well as in their basement source, indicate that the T max–P Tmax for M1 assemblages is characterized by P/T and T/depth ratios around 1.5 × 10⁻³ GPa °C−1 and 18 °C km−1, respectively, and suggest that the thermal regime was compatible with a continental collision consequent to the Variscan convergence. The greenschist-facies imprint that is recorded in Type 1 pebbles is related to the Variscan exhumation and is characterized by P/T ∼ 1 × 10⁻³ GPa °C−1 and T/depth ∼ 3 °C km−1. The epidote–amphibolite-facies metamorphic imprint that is recorded in the type II tectonometamorphic units (e.g. unit A of North East Orobic basement in the inset of Fig. 12) and is related to Variscan tectonic burial is missing in the pebbles recording Type 1 P–T evolution, as well as in the Val Vedello basement rocks. This may suggest that in the presently exposed Val Vedello basement, as well as in its portion exposed in the early Permian, the thermo-mechanical re-equilibration during the Variscan collision was able to obliterate completely the Variscan tectonic burial record, in contrast to unit A of the North East Orobic basement.
In Type 2 pebbles, M2 conditions are characterized by P/T ∼ 1.2 × 10⁻³ GPa °C−1 and by T/depth ∼ 26 °C km−1 that may reflect a thermal regime compatible with a collisional stage. M3 conditions are characterized by P/T ∼ 0.7 × 10⁻³ GPa °C−1 and T/depth ∼ 45 °C km−1, which are compatible with a thermally relaxed regime after the crustal thickening consequent to continental collision.
Since units B and C of the North East Orobic basement have a Variscan age (Gansser & Pantič, Reference Gansser and Pantič1988), Type 2 pebbles may be considered to derive from a similar Variscan basement and therefore, they may record the thermal imprint related to the Variscan collision (M2) but at a shallower structural level with respect to that of Type 1 pebbles and of type I and II tectonometamorphic units (inset of Fig. 12).
Finally, for the basement source of Type 1 pebbles, we may suggest, as a preliminary rough estimate, an exhumation rate of 0.44–0.64 km Ma−1. This estimate is based on the c. 330 Ma age of the amphibolite-facies metamorphic imprint in the Val Vedello basement, homologous to M1 in Type 1 pebbles and on the c. 278 Ma deposition age of the Aga and Vedello conglomerates.
This methodological approach indicates that micro-structural analysis, together with petrological P–T estimates, is necessary to infer the full tectonic evolution of the basement source area for a conglomerate. In addition, as pointed out by this case history, this integrated analysis may reveal in late orogenic conglomerates a record no longer preserved in presently exposed basements, as suggested by the case of the Grt–Chl metapelite pebbles. In summary, the parent basement rocks of conglomerates cannot be unambiguously distinguished by occurrences of detrital grains of a single mineral species or of single mineralogical assemblages, as previously pointed out by a similar type of analysis in the Dosso dei Galli Conglomerate (Spalla et al. Reference Spalla, Zanoni, Gosso and Zucali2007). Actually, if the tectonometamorphic units of surrounding basements are well individuated and contoured, the identification in the pebbles of a mineral assemblage sequence is required to restrict the thermal signature of the potential source basement, with the exception of cases in which a definitely specific geochemical signature makes single mineral grains diagnostic.
Acknowledgements
E. Garzanti and an anonymous reviewer greatly helped with their comments and suggestions to improve the manuscript. E. Spreafico shared fieldwork with D. Z.; F. Felletti and M. Zucali are thanked for helpful discussions. C. Malinverno prepared thin-sections, A. Risplendente and A. Rizzi provided the technical assistance at the microprobe and at the SEM-EDS, respectively. Funding from PUR 2007 and CNR-I.D.P.A. is acknowledged.
Appendix 1. Analytical description of the pebbles microstructure
Metapelite pebbles
Bt–Grt–St metapelite pebbles of type A. Shape and lattice preferred orientation of weakly deformed WmI marks S1; WmII marks a slight S2 foliation in the most phyllitic portions. Grt is widely replaced by fine-grained WmIII and Chl. Rare relict portions in large porphyroblasts have composite inclusion trail patterns and contain WmI and Rt rimmed by Ilm that mark internal foliations continuous with the external S1. Internal foliation is straight and at a high angle with the Se (external foliation) in the cores and is deflected towards the external S1 orientation at the rims. In places the internal foliation is folded following the same geometry of S1 in matrix but with a wider wavelength (Fig. 6a). Therefore Grt is interpreted as pre- to synkinematic with respect to D2 microfolding. Pl occurs in two different generations: PlI occupies the S1 lithons and is widely replaced by fine-grained WmIII. PlII contains an internal foliation straight in the core but folded in the outer parts and continuous with the external folded S1, which suggests a pre- to synkinematic growth with respect to D2. PlII shows rational rims with Grt. Bt is widely replaced by Chl, sagenitic Rt and rare Ttn. Coarse-grained Bt is also replaced by Kfs or WmIII. Fine-grained BtI shows shape preferred orientation parallel to S1 (Fig. 6b). Coarse-grained BtII locally shows shape preferred orientation parallel to an incipient S2 foliation and contains straight inclusion trails continuous with the folded S1 foliation (Fig. 6b) of the matrix. Rt shows shape preferred orientation parallel to S1 foliation and is rimmed by Ilm. Chl in addition to Grt and Bt replaces also WmI and II.
Bt–Grt–St metapelite pebbles of type B. Shape and lattice preferred orientation of Wm mark S1 foliation (WmI) and S2 cleavage (WmII). In D2 microfold hinges WmII is decussate. Grt is widely replaced and does not contain internal foliations; St porphyroblasts are totally replaced by a Chl and Wm fine-grained aggregate and in places a ghost internal foliation, deflected and continuous with the external S1, suggests a syn-S1 growth. Pl contains an internal foliation continuous with the external S1 (Fig. 6c, d) and generally crenulated in the core of the crystals and straight at the margins; a rim free of inclusions locally occurs (Fig. 6c). Pl growth is interpreted as syn- to post-D1. Bt generally occurs as relics widely replaced by Chl and minor Wm ± Rt; its shape preferred orientation parallel to S1 suggests syn-S1 growth. Microboudinaged Rt shows shape preferred orientation parallel to S1, Ilm occupies its microboudin necks and also grew at the rims. Chl, which is also the main reaction product of Grt and Bt, is aligned parallel to S2 (Fig. 6e).
Bt–Grt–St metapelite pebbles of type C. Shape preferred orientation of internally deformed WmI marks the relict S1 foliation. WmII is decussate in correspondence to D2 isoclinal microfolds and displays a shape preferred orientation parallel to S2. Rare WmIII with a shape preferred orientation at a high angle to S2 contains an internal foliation marked by opaque minerals that is parallel and continuous with the external S2. Grt is replaced by fine-grained Chl and WmIII, shows Qtz strain shadows, and is wrapped by WmII; it contains a deflected internal foliation continuous with the external S2 that in the core is locally straight and orthogonal to the external S2 and in the rim becomes progressively parallel to S2. These features suggest a pre- to syn-S2 Grt growth. Where St occurs, it encloses Grt; these two phases show rational grain boundaries (Fig. 6f). St shows shape preferred orientation parallel to S2 and is locally microboudinaged with fine-grained Chl and minor WmIII in the necks of porphyroclasts and in micro-fractures. Fine-grained WmIII grew at the St rims and at the contacts with the enclosed phases (Fig. 6g). Pl shows a slightly deflected internal foliation marked by Qtz and WmI and continuous with the external S2. Pl encloses fine-grained Grt; these two phases show mutual rational grain boundaries. Shape preferred orientation of Bt is parallel to S2 (BtII) but some individuals (BtI) have different shape orientation. BtII shows rational grain boundaries with WmII. Rt is enclosed in St with irregular grain boundaries, is rimmed by Ilm, and in the rock matrix shows oblique orientation with respect to S2. Prismatic micro-sites totally replaced by a fine-grained aggregate of Wm may correspond to Ky relics. In these pseudomorphic aggregates, Rt inclusion trails mark an internal deflected foliation, continuous with S2. Tur shows an internal foliation continuous and folded like the external S2 but with a higher wavelength that suggests growth during D3 folding. Chl replaces Grt, Bt, St and grew mimetically over the S2 foliation.
Grt–Chl metapelite pebbles. Shape preferred orientation of WmI grains, which show undulose extinction, marks S1. Shape and lattice preferred orientation of WmII, which shows slight internal deformation, mark S2 (Fig. 7a). A few WmIII grains mark the S3 crenulation cleavage. Grt occurs as millimetre-sized grains and is partially replaced by ChlIII and WmIII, which grew also in its fractures (Fig. 7b, c). A Grt internal foliation marked by Rt and rarely by WmI is continuous with the S2 external foliation (Fig. 7c). This internal foliation is deflected, becomes parallel to S2 at the margins, and is never folded by D3. Grt growth may be situated before D3 folding from syn- to post-S2. Rt marks S2 by shape preferred orientation (Fig. 7c), is microboudinaged, and rimmed by Ilm. Shape preferred orientation of ChlI marks the S1 foliation and shape preferred orientation and locally lattice preferred orientation of ChlII mark S2 (Fig. 7a). ChlII shows also rational grain boundaries with WmII and Grt. Large ChlIII crystals are aligned along S3 cleavage (Fig. 7d). Pl displays compositional zoning from oligoclase to albite and shows rational grain boundaries with Grt. An internal foliation continuous with the external S2 is deflected, or straight, or folded coherently with the S2 foliation in the matrix (Fig. 7b). These features indicate for Pl a growth from syn- to post-S2. Tur occurs in euhedral fine-grained crystals free of internal deformation.
Gneiss pebbles
Bt-bearing mylonitic gneisses. Bt shows slight internal deformation and has a shape preferred orientation parallel and locally a lattice preferred orientation oblique to the mylonitic foliation (Fig. 8a). Wm and Chl grew in the necks of frequently microboudinaged Bt (Fig. 8b). Chl, Ttn, and fine-grained Wm replaced partially Bt; occasionally Bt exsolves sagenitic Rt. WmI shows a shape preferred orientation parallel to the mylonitic foliation and is microboudinaged. WmII recrystallized during the development of the mylonitic fabric and occupies the boudin necks of Bt. Pl shows rational grain boundaries with Bt, polysynthetic twinning, and is widely replaced by fine-grained randomly oriented WmIII. Ap shows rational grain boundaries with WmI and shape preferred orientation parallel to the mylonitic foliation.
Type Am metagranitoids. Pl has either polysynthetic growth or deformation twinning, which occasionally are perpendicular to the foliation. It may show graphic texture (Fig. 8c) and forms inequigranular aggregates with Qtz that consist of sub-grains and new grains. Locally Ab is abundant and shows shape preferred orientation parallel to the foliation. WmII forms thin crystals with shape preferred orientation parallel to the foliation and WmI forms crystals oblique to the foliation. Kfs porphyroclasts contain Ab perthites and are parallel to the foliation. Bt is often widely replaced by Wm and Chl and acicular sagenitic Rt (Fig. 8d).
Type Bm metagranitoids. Kfs forms large porphyroclasts, seldom displays granophiric texture and is parallel to the foliation, which is marked also by shape preferred orientation of Wm. Pl has polysynthetic twinning (Fig. 8e) and may show orientation transversal with respect to the foliation (Fig. 8f). Occasionally kinked grains of WmI are oblique with respect to the foliation (Fig. 8g). Shape preferred orientation of rare WmII, with a weak internal deformation, is parallel to the foliation, marked by recrystallized Qtz microaggregates.



