The variable production of coda /r/—hereafter referred to as (r)—is a hallmark variable of variationist sociolinguistics. The publication of The Social Stratification of English in New York City (Labov, Reference Labov1966) established the subfield of variationist sociolinguistics with its description of the social stratification of phonological variables of New York City English (NYCE), not the least of which was the production of historical or orthographic /r/ in the syllable coda of words such as father and card. NYCE, a traditionally nonrhotic dialect of North American English (NAE), was found to be variable for (r), and that variability patterned according to social predictors such as socioeconomic status and gender. Furthermore, the analysis found a robust change in progress for (r) in NYCE in the direction of rhoticity. The variable has figured prominently in discussions of the apparent time construct, serving as the classic example of a change from above, or a change above the level of social awareness that is often introduced by the dominant social class (Labov, Reference Labov1994:78). The present paper revisits the Lower East Side field site of Labov (Reference Labov1966) as well as the variable (r), providing both real and apparent time evidence of the advancement of the change for this iconic feature of NYCE.
The variable (r) is defined as the variable acoustic presence of constricted /r/ in tautosyllabic or coda position (e.g., in words such as care, card, and careful). It has been commonly referred to in the sociolinguistic literature as “post-vocalic r.” The realization of (r) ranges from constricted to vocalized to deleted, but it is commonly operationalized into a binary variable that opposes the presence of constricted /r/, also referred to as [r-1] or r-pronunciation, to absent or vocalized /r/, also referred to as [r-0] or r-vocalization. Speakers and varieties with much constricted /r/ are commonly referred to as r-ful, whereas speakers or varieties with much vocalized or absent /r/ are commonly referred to as r-less. This paper refers to the variable as (r), adopts the terminology [r-1] and [r-0] to refer to the presence and nonpresence of constricted /r/, respectively, and refers to speakers and varieties who use much constricted /r/ as rhotic, and to those who use much absent or vocalized /r/ as nonrhotic.
Nonrhoticity in North American English
Only a few regional dialects of NAE retain variable nonrhoticity in the face of the widespread rhotic norm in contemporary NAE.Footnote 1 Many early dialect regions, however, emerged as nonrhotic, adopting linguistic features in alignment with patterns of British settlement, which included settlers from nonrhotic Southern England in the 18th and 19th centuries. Nonrhoticity predominated in the coastal ports along the Eastern seaboard—Boston, Providence, New York City, Charleston, and Savannah—that were centers of trade and culture and maintained close ties with London, looking to it for cultural and linguistic norms (Kurath, Reference Kurath1949). In contrast were urban centers such as Philadelphia that remained relatively independent from the influence of London and established a new, rhotic norm for NAE (Miller, Reference Miller and Verma1998).
Nonrhoticity remained the prestige norm in these coastal cities through the mid-20th century, when dialectologists noted the beginnings of a change toward the broader NAE rhotic norm (Kurath & McDavid, Reference Kurath and McDavid1961; McDavid, Reference McDavid1948). Though all nonrhotic dialect regions began the change toward rhoticity during this period, the Atlas of North American English (ANAE) describes a “striking” difference between the South and the North for the mode of restoration of rhoticity (Labov et al., Reference Labov, Ash and Boberg2006:48). In the South, the change to rhoticity has moved quickly and is basically complete (Baranowski, Reference Baranowski2007; Feagin, Reference Feagin, Edmondson, Feagin and Muhlhausler1990; Labov et al., Reference Labov, Ash and Boberg2006).Footnote 2 Whereas earlier analyses of variable nonrhoticity in the South identified numerous social factors impacting the use of (r), finding that young, white educated women led the change toward rhoticity (McDavid, Reference McDavid1948; Schonweitz, Reference Schonweitz2001), more recent analyses find only age to be a significant social predictor of rhoticity, indicative of an advanced stage of change (Baranowski, Reference Baranowski2007; Labov et al., Reference Labov, Ash and Boberg2006). In contrast, the ANAE states that in the North, (r) is either undergoing slow change (in New York City) or there has been no change (in New England). However, recent work in Boston and New Hampshire (Nagy & Irwin, Reference Nagy and Irwin2010) contested the picture of stability for New England, providing apparent time evidence of change in progress in the direction of rhoticity. Similarly, this paper provides an update for the perspective on NYCE's mode of restoration of rhoticity and its characterization as a slow change.
Nonrhoticity in NYCE
Scholars have long described nonrhoticity as a defining feature of NYCE (Babbitt, Reference Babbitt1896; Bronstein, Reference Bronstein1962; Frank, Reference Frank1948; Hubbell, Reference Hubbell1950; Kurath & McDavid, Reference Kurath and McDavid1961; Sen, Reference Sen1979). In the 18th century, nonrhoticity was the prestige norm, originating in the speech of upper-class New Yorkers interested in maintaining the norms of standard British English (Sen, Reference Sen1979). By the turn of the 20th century, Babbitt (Reference Babbitt1896) described the use of nonrhoticity as categorical in the general New York City population. Mid-way through the 20th century came reports that rhoticity was making inroads in NYCE (Bronstein, Reference Bronstein1962; Frank, Reference Frank1948; Hubbell, Reference Hubbell1950). Labov (Reference Labov2006) argued that World War II marked the turning point for (r) in NYCE and other nonrhotic dialects. Following World War II and the large population movement that resulted from the war, New Yorkers began to turn away from the prestige of British English and became sensitive to the norm of rhoticity in NAE (Labov, Reference Labov2006:225–226). The NYCE speech community used variable nonrhoticity, with the use of (r) patterning with a number of social divisions that indicated the prestige of rhoticity for New Yorkers. Labov (Reference Labov1966, Reference Labov1972b) confirmed a change in progress in the direction of rhoticity for NYCE (r), and predicted that NYCE would soon join the rest of rhotic NAE.
The Department Store Studies
The most well-known investigation of NYCE variable nonrhoticity is Labov's (Reference Labov1966) rapid anonymous survey of three New York City department stores. The Department Store Study hypothesized that salespeople from three department stores with differing social status (Saks Fifth Avenue, Macy's, and S. Klein) would mirror the prestige of their respective stores in the use of (r). The stores themselves were meant to serve as a proxy for the social stratification of New York City residents, such that the results for (r) were hypothesized to apply to the NYCE speech community more broadly. Indeed, salespeople at Saks (the highest prestige store) produced more [r-1] than did salespeople at Macy's (the store with medium prestige), who in turn produced more [r-1] than did the salespeople at S. Klein (the lowest prestige store). In addition, speakers demonstrated stylistic variation, producing more [r-1] when asked to repeat the phrase “fourth floor.” Both of these findings confirmed the prestige of [r-1], as it was used more by higher-class speakers and in contexts where more attention was paid to speech. The results for age, however, did not support an apparent time picture of change, as only the speakers at Saks were stratified across age groups with younger speakers producing the most [r-1]. Apparent time documentation of the change in progress toward rhoticity in NYCE came from the Lower East Side community study.
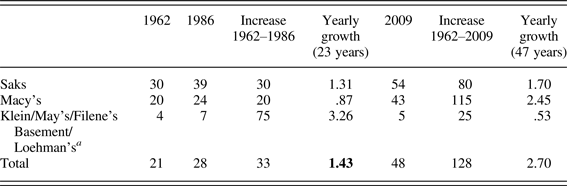
It was not until Fowler's (Reference Fowler1987) trend study, which replicated the original department store methodology, that the department store data provided real time evidence of change. Fowler found an overall increase in the use of [r-1] as well as verification of the findings from the original study of both social and stylistic stratification. Because the data were directly comparable to the Department Store Study data from two decades earlier, the rate of change toward rhoticity was quantified (Labov, Reference Labov1994; Labov et al., Reference Labov, Ash and Boberg2006). A growth rate was calculated, based on a comparison of the speakers sampled in 1962 (the year the fieldwork was conducted for the original Department Store Study) who produced all [r-1] in the twice-repeated phrase “fourth floor,” compared with the speakers who produced all [r-1] in the replication fieldwork conducted in 1986.Footnote 3Table 1 presents a straight-line calculation of the percentage of yearly growth in all [r-1] production for each department store and across department stores. The percentage of yearly growth across all three department stores from 1962 to 1986 is 1.43% (bold cell in Table 1), which approximates the 1.5% per year increase reported by the ANAE (Labov et al., Reference Labov, Ash and Boberg2006:47).Footnote 4
Percentage of speakers who produce all [r-1]

Note: aS. Klein closed before the time of Fowler (Reference Fowler1987), which substituted May's, a store with a similar location and clientele. By the time of Mather's (Reference Mather2012) fieldwork, May's also had closed, so this study used two stores—Filene's Basement, located in Union Square near the site of the original S. Klein, and Loehman's—as substitutes for the lowest ranking store.
Source: Data from Fowler (Reference Fowler1987), Labov (Reference Labov1966), and Mather (Reference Mather2012).
More recently, Mather (Reference Mather2012) conducted another replication of the Department Store Study and demonstrated the continued progress of the change toward rhoticity. The total speakers who produce all [r-1] across all three stores in these data, collected in 2009, is 48%, making the percentage of yearly growth across all three stores from 1962 to 2009 2.7%, almost double the yearly increase of 1.43% calculated for the period 1962 to 1986. In contrast to the results for age in Labov (Reference Labov1966) and Fowler (Reference Fowler1987), Mather (Reference Mather2012) found that younger speakers produce the most [r-1] in all three department stores and suggested that his 2009 results demonstrate change in apparent time as well as real time change.
The Department Store Study comparisons revealed that the change toward rhoticity was advancing more slowly than expected (Labov, Reference Labov1994:91). Fowler, writing in 1986, when the overall percentage of speakers who produced all [r-1] across the three department stores had increased from 21% to only 28%, noted that “[r-1] is not steamrolling its way into LMC [lower middle class] speech as Labov predicted” (Fowler, Reference Fowler1987:9). Based on the calculations in Table 1 as well as more recent analyses that continue to find variable nonrhoticity maintained in NYCE, numerous studies have characterized the change to rhoticity in NYCE as slow (Becker, Reference Becker2009; Labov, Reference Labov1994; Labov et al., Reference Labov, Ash and Boberg2006) and expressed surprise at its lack of progress.
No objective benchmark exists for identifying a rate of change as “slow” or conversely “fast.” For NYCE rhoticity, the slow characterization is in part relational and comes from a comparison of the 1.5% per year rate of change with the rate of the return to rhoticity in the South, which went to completion in as few as three generations. Feagin's (Reference Feagin, Edmondson, Feagin and Muhlhausler1990:138) paper was influential in presenting the restoration of rhoticity in Southern English as a rapid change that was “racing like wildfire.” Within a single family in Anniston, Alabama, a grandmother showed an [r-1] of 0%, whereas her grandson produced an [r-1] of 91%. Because NYCE speakers were found to maintain the use of much variable nonrhoticity, (r)'s advancement is characterized as slow in comparison. In addition, age is the single social predictor of rhoticity in contemporary studies of the South (Baranowski, Reference Baranowski2007; Labov et al., Reference Labov, Ash and Boberg2006), whereas data from NYCE continue to show differentiation according to multiple social variables. As conditioning by age alone has been suggested as a characteristic of late-stage change, comparing the South to NYCE again casts the latter as at an earlier stage, and so a slow change by comparison.
The social stratification of English in New York City
The data from the Department Store Studies are limited in their ability to characterize variable nonrhoticity. Because each participant only produced (r) four times (in the twice-repeated phrase “fourth floor”), participants were binned into three categories: those who produced all [r-1], those who produced some [r-1], and those who produced no [r-1] in those four tokens. Given that speakers rarely display categorical behavior in the production of active sociolinguistic variables, the dataset is not ideal for providing an accurate picture of nonrhoticity as a socially stratified variable or of the variable's rate of change. And indeed, the findings were not meant to stand alone, but to be considered in tandem with Labov's (Reference Labov1966) community study of the Lower East Side.
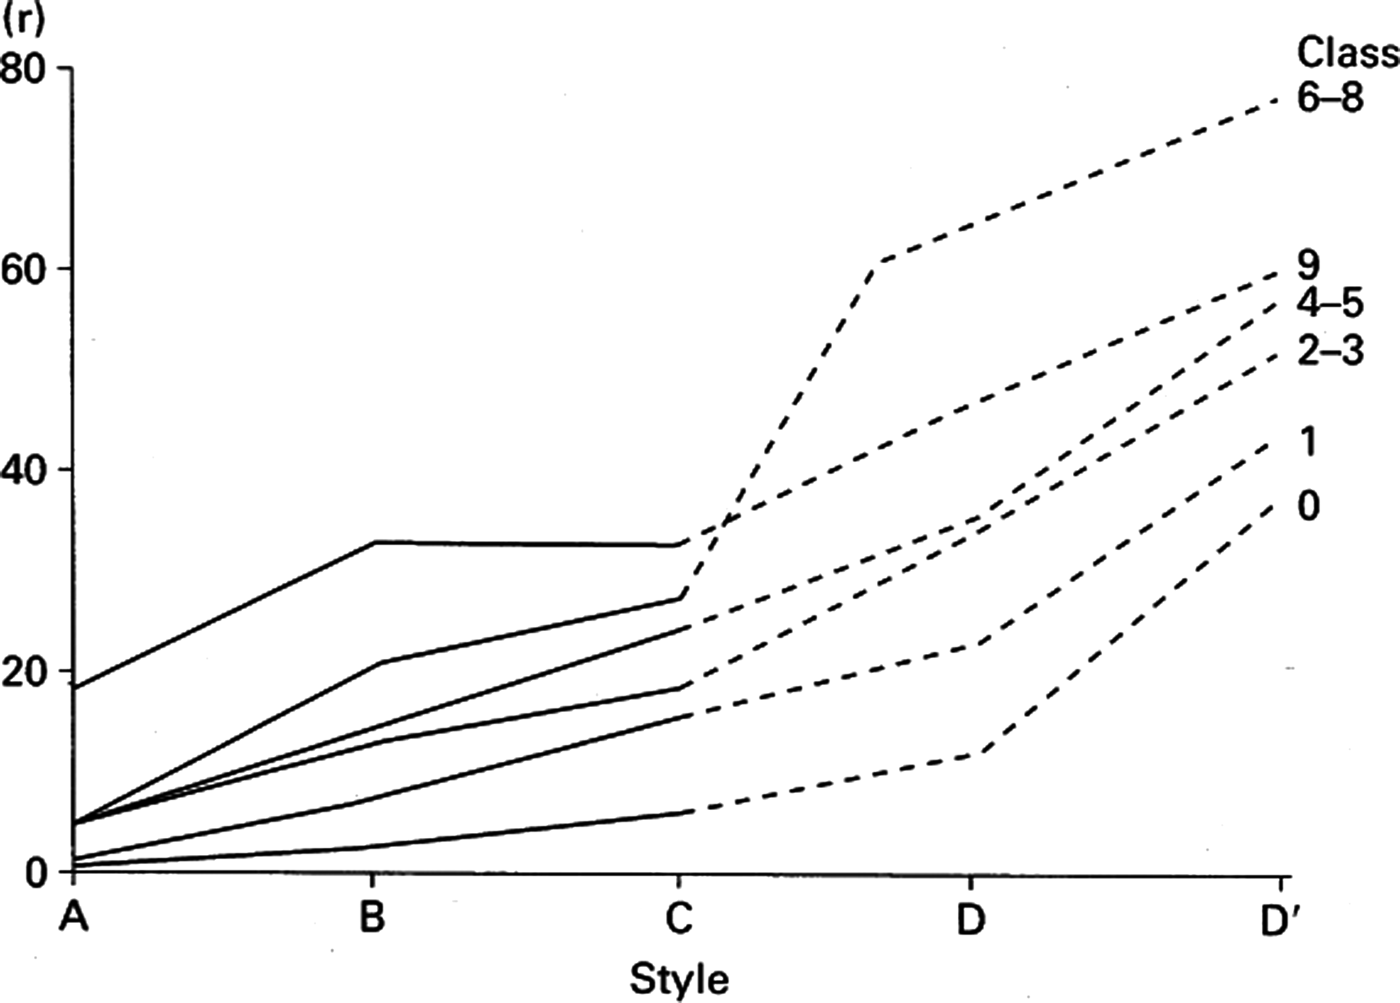
Variable nonrhoticity was the showcase variable of Labov (Reference Labov1966). Speakers' use of (r) demonstrated fine stratification, or small, even divisions in use of the variable that corresponded to a linear hierarchy of class divisions in the speech community. The picture for (r) also effectively demonstrated the relationship between social and stylistic stratification, as speakers of all class groups increased their usage of [r-1] systematically from more casual to more formal contextual styles. Finally, (r) exemplified the linguistic insecurity of NYCE speakers, based on the results of subjective reaction tests where subjects reported their own use of [r-0] while overwhelmingly choosing [r-1] as the correct, preferable form. All of these sociolinguistic patterns are captured in the classic graph for (r) in Figure 1. The figure shows an increase in [r-1] across six socioeconomic class groups along the vertical axis, as well as an increase in [r-1] across five contextual styles on the horizontal axis. In addition, the lower-middle-class groups (6–8) outperform the upper-middle class (9) in [r-1] in more formal styles. This is the classic hypercorrect behavior of the second highest class group, a behavior linked to linguistic insecurity as well as an important indicator of change from above (Labov, Reference Labov1972b). The patterns for (r) exemplified in Figure 1 are now the benchmark for a variable undergoing change in apparent time from above.
The production of [r-1] for six class groups across five contextual styles (from Labov, Reference Labov1966).
Based on its categorization as a change in progress, Labov (Reference Labov1966) predicted that rhoticity would continue to spread in NYCE. Unlike for the Department Store Study, to date there has been no large-scale community study with data from sociolinguistic interviews with which to make a real time comparison. Becker (Reference Becker2009) looked at a small sample of seven white, lower-middle-class, middle-aged and older residents who grew up and still live on the same block on the Lower East Side. The study reported that the mean [r-1] was [r-55], which translates to a real time increase when compared with the middle-aged, lower-middle-class speakers in style B (careful speech) from Labov (Reference Labov1966), who used [r-21]. Though Becker (Reference Becker2009) was limited in its small, homogeneous sample, the study contributes an important perspective on the covert prestige of nonrhoticity that stands in contrast to the stigma demonstrated for (r) in Labov (Reference Labov1966). Becker (Reference Becker2009) found that speakers style-shifted in the direction of nonrhoticity, significantly increasing their rates of nonrhoticity when discussing neighborhood-oriented topics as compared with non-neighborhood topics. This behavior was argued to be evidence that speakers were active participants in the construction of a place identity, an aspect of identity tied to localness and authenticity (Becker, Reference Becker2009). Overall, these findings highlight the active use of nonrhoticity by speakers of NYCE despite the advancement of the change away from it use, which has implications for the change in progress to rhoticity in NYCE. On the one hand, nonrhoticity could be available as an active resource because the change has progressed slowly; on the other, this usage could be contributing to the slow advancement of the change (Becker, Reference Becker2009:653).
In this study, multivariate regression analyses confirm the advancement of the change in apparent time, and in combination with real time comparison with the data from Labov (Reference Labov1966) and the Department Store Studies, support the conclusion that the change can no longer be characterized as slow.
Rhoticity and formality
Despite the clear picture of change in apparent time toward rhoticity in the Lower East Side data, Labov (Reference Labov1966:234) argued that the norm of everyday, casual speech in NYCE remained nonrhotic, reporting mean [r-1]s of zero for working-class speakers in casual speech. Only the speakers from the highest class group used any significant [r-1] in casual speech (Labov, Reference Labov1972b). These results, taken in concert with the real time data from the Department Store Studies, which indicated a slow change, led to later characterizations of rhoticity in NYCE as a feature restricted to formal speech (Labov, Reference Labov1994). Most recently, the ANAE found that nonrhoticity persisted for the 12 New Yorkers in their sample despite the relative formality of the telephone interview data. The authors summarize:
The change in New York City is primarily a change in the norms of careful speech. The small rate of increase of 1.5 percent a year reported above is largely due to the behavior of the younger upper middle class speakers. For others, r-constriction shows an increase only in careful styles, and this tendency is greatest in middle-aged rather than younger speakers. (Labov et al., Reference Labov, Ash and Boberg2006:48)
The present study will show that rhoticity predominates in interview speech across age and class backgrounds, and so can no longer be considered superposed or formal. Though there are no data here from more formal styles (reading passages and word lists) to compare with earlier work, the presence of rhoticity in noncareful styles in any meaningful amount is enough to challenge the characterization of NYCE (r) as a formal feature, and this is precisely what the analysis here demonstrates.
In addition to commenting on the characterizations of “slow” and “formal” from the literature on the change to rhoticity in NYCE, this paper highlights the social differentiation of (r) on the Lower East Side, with a particular focus on ethnolinguistic variation and change.
Variable nonrhoticity and ethnicity
The community study of Labov (Reference Labov1966) highlighted the role of ethnic identity in the use of NYCE, in particular differences between Jewish and Italian Lower East Siders for a number of phonological variables. Jewish speakers were found to use a higher bought vowel than Italians did, whereas Italians used a higher bat for the tense vowel set of the NYCE short-a split. For (r), Jewish and Italian speakers were collapsed with other speakers of European ancestry, so that the classic graph in Figure 1 depicts the behavior of white speakers of NYCE.
However, (r) is also considered a feature of African American English that has been documented in the speech of African American speakers in both rhotic and nonrhotic dialect regions (Myhill, Reference Myhill1988; Rickford, Reference Rickford1999; Wolfram, Reference Wolfram1969, Reference Wolfram2007). A number of studies have compared white speakers of some regional dialect with African American speakers in the same locale and found that African Americans produce lower rates of [r-1] than do coterritorial whites (Myhill, Reference Myhill1988; Thomas, Reference Thomas2007). These studies have by and large presented the use of nonrhoticity by African Americans as ethnolectal behavior, although it has been suggested that contact with nonrhotic dialect speakers produces an “additive effect” that explains the lower rates of [r-1] produced by African Americans in nonrhotic dialect regions when compared with African Americans in rhotic dialect regions (Wolfram, Reference Wolfram2007:8–9).
In New York City, the use of variable nonrhoticity by African American New Yorkers has been characterized largely as ethnolectal rather than dialectal behavior. Labov (Reference Labov1966) sampled African American Lower East Siders and concluded that these speakers did not participate in the phonology of NYCE, based on analysis of five phonological variables including (r). In the Lower East Side study, as well as in the three Department Store Studies, African American speakers were found to produce lower rates of [r-1] than their white counterparts did, but the African American speakers followed the overall patterns of social and stylistic stratification (Fowler, Reference Fowler1987; Labov, Reference Labov1966; Mather, Reference Mather2012). Labov (Reference Labov1972a) found that many speakers of what he called the Black English Vernacular who participated in the street culture of Harlem were completely nonrhotic. In arguing that African American English was a distinct linguistic variety, Labov (Reference Labov1972a) noted key differences between African American and white New Yorkers' constraints on (r), including the infrequent use of linking (r) by African Americans. Socially, however, Labov (Reference Labov1972a:13) found that African Americans showed the same sensitivity to (r)'s prestige as other New Yorkers did and even demonstrated more dramatic style-shifting than white speakers did.
More recent studies of African Americans' use of (r), in both rhotic and nonrhotic locales, have found evidence of change in progress toward rhoticity (Blake & Shousterman, Reference Blake and Shousterman2010; Hinton & Pollock, Reference Hinton and Pollock2000; Nagy & Irwin, Reference Nagy and Irwin2010). Blake and Shousterman (Reference Blake and Shousterman2010) and Shousterman, Blake, and Kelley (Reference Shousterman, Blake and Kelley2009) found an overall rate of [r-1] of [r-40] for their sample of African American New Yorkers, and they argued this was evidence of real time change when compared to Labov (Reference Labov1972a), although they did not find evidence of apparent time change. Nagy and Irwin's (Reference Nagy and Irwin2010) study of variable nonrhoticity in Boston argued that African American Bostonians were participating in the change to rhoticity there, and that the overall frequency of [r-1] for African American and white Bostonians in their sample is essentially the same (28% and 33%, respectively). Despite similarities in mean [r-1], they kept the two groups separate in analysis due to differences in constraint rankings, a topic that I will discuss in more detail.
In contrast to what is known about African Americans and (r), little scholarship has looked at the use of variable nonrhoticity by other nonwhite North Americans. A few studies incorporate Latino speakers into their studies, almost always combining—or at most comparing—them with coterritorial African Americans (Fowler, Reference Fowler1987:6; Myhill, Reference Myhill1988).
The present study analyzes an ethnically diverse sample of speakers on the Lower East Side, considering them part of one speech community in initial quantitative analyses. The speaker population includes African Americans, about whom much is known for variable nonrhoticity, as well as Chinese and Puerto Rican Lower East Siders, about whom almost nothing is known for (r). The resulting analysis, with confirms that nonwhite Lower East Siders participate in the constraints on variable nonrhoticity, and that Chinese speakers participate in the change toward rhoticity, aligns with the growing body of work arguing that native nonwhite residents do participate in regional dialect phonology (Fought, Reference Fought1999; Hall-Lew & Yaeger-Dror, Reference Hall-Lew and Yaeger-Dror2014; Wolfram, Reference Wolfram2007; Yaeger-Dror & Thomas, Reference Yaeger-Dror and Thomas2010).
METHODS
Field site
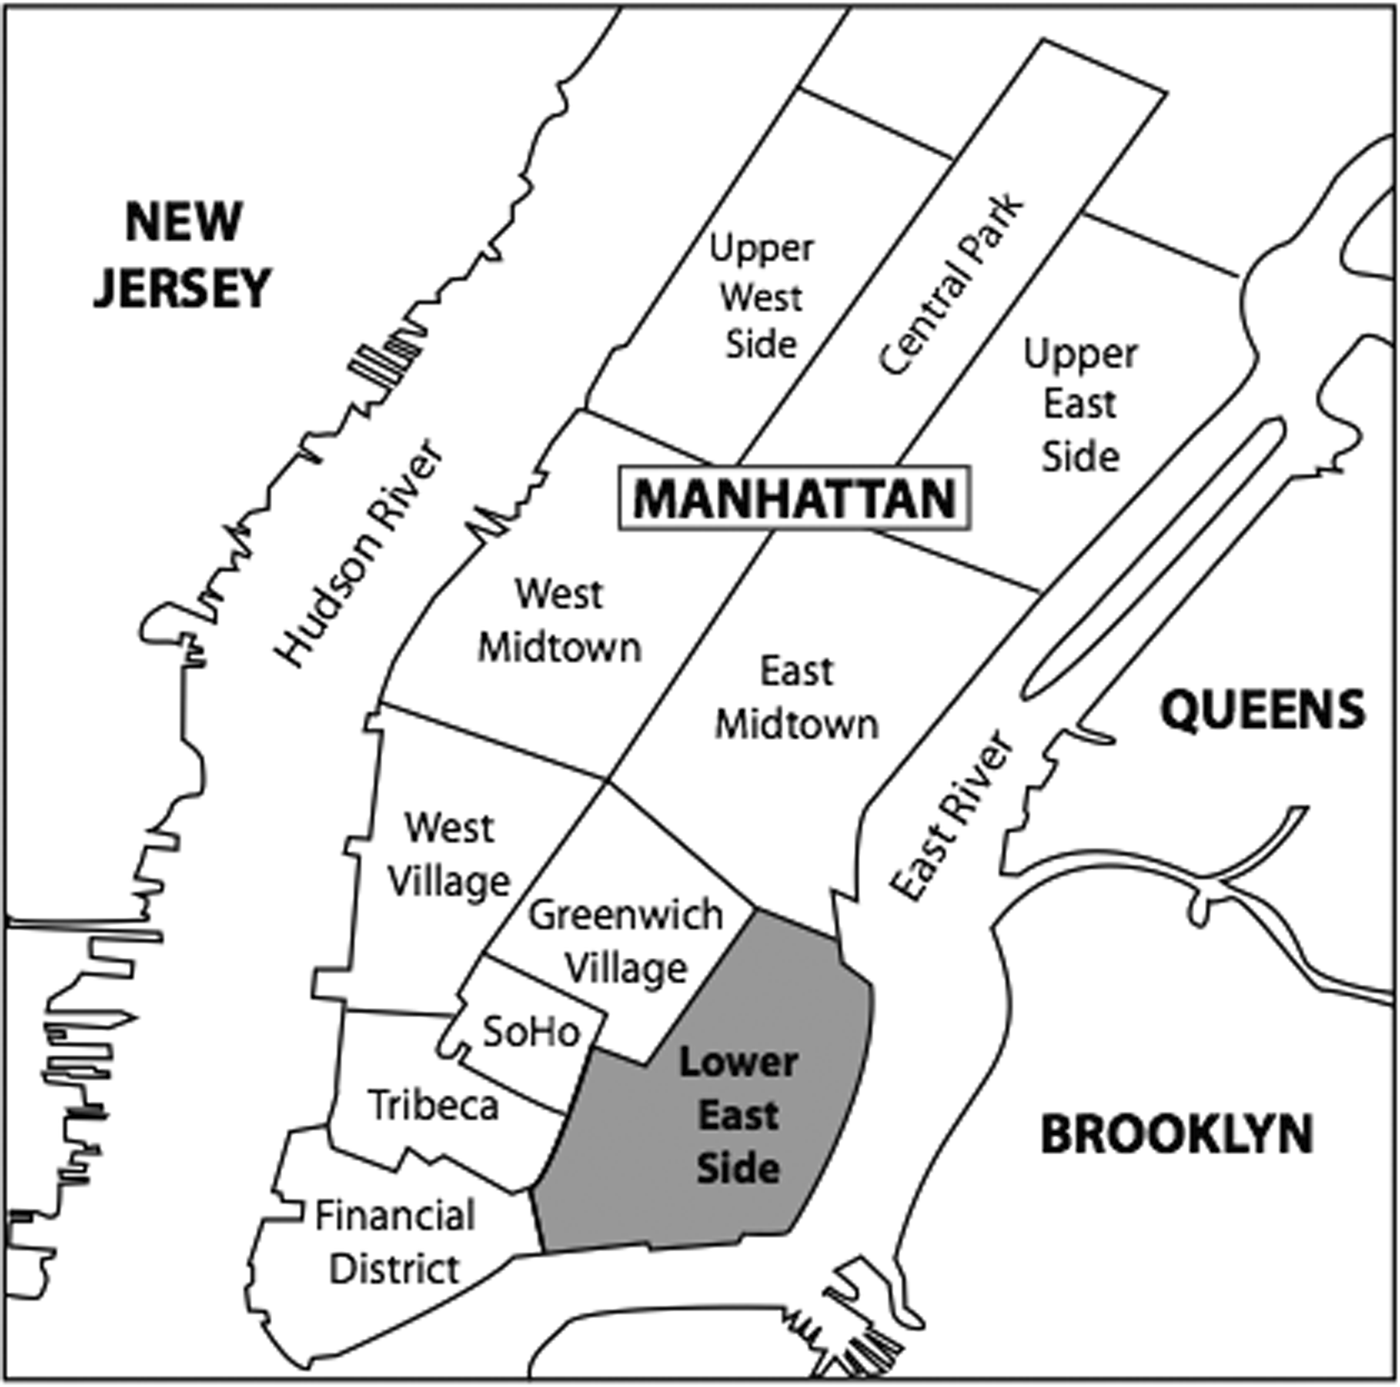
The present study revisits the Lower East Side of Labov (Reference Labov1966) (Figure 2). Although the Lower East Side remains characterized by the “rapid social movement” (Labov, Reference Labov1966:98) of various ethnic and socioeconomic groups, in many ways, the neighborhood has changed dramatically since Labov's fieldwork in the 1960s. The Lower East Side was primarily a white ethnic immigrant neighborhood during the late 19th and early 20th centuries and was a way station for immigrants newly arrived to the United States. Today, the descendants of these white ethnic families have primarily moved away, so that what was once a majority white neighborhood, with a reported 63% of residents of European descent in 1966, is now only 33% white according to the 2010 U.S. Census. The ethnic landscape of the neighborhood is now dominated by nonwhite residents, including large numbers of immigrants and their children from Puerto Rico and China. In addition, not all of the current white residents are the “old stock” residents profiled by Labov (Reference Labov1966). Some are gentrifiers, wealthy transplants drawn to the hip bars and restaurants that populate the neighborhood's northern and western sides. These predominantly white and upper-middle-class residents are largely rhotic speakers of American English, having moved to New York City from elsewhere in the United States. Socioeconomically, they increase the overall stratification of the neighborhood by adding to the wealthy end of the socioeconomic continuum, although the median income of the Lower East Side remains almost half that of the median income for the borough of Manhattan (Mele, Reference Mele2000). Socioeconomically and ethnically, gentrifiers are a visible and controversial presence. Though they are not included in the current sample, which draws from native residents of the neighborhood, they contribute to community tensions over authenticity as well as access to housing and quality of life issues.
Location of the Lower East Side neighborhood in Manhattan.
The data analyzed here come from an oral history and ethnographic fieldwork project. Interviews were conducted from 2006 to 2009 as part of a collaboration with local housing activist organizations in which the author served as lead interviewer for a community oral history project (Becker, Reference Becker2010). Because the primary goal of the interviews was not sociolinguistic, these interviews lack linguistic data from formal contextual styles (reading passages, word lists, and minimal pairs), subjective reactions tests, or other linguistic tasks. The lack of contextual styles is a significant drawback for a discussion of NYCE rhoticity, given the results for stylistic stratification and hypercorrection in earlier works. However, the production data collected during the body of the interviews is comparable in topic and tone to other sociolinguistic interviews. Becker (Reference Becker2009), which uses data from the same set of oral history interviews, found no significant difference between casual and careful styles within the body of the interview. That study and the present one consider interview speech to be a single category. When comparing to Labov (Reference Labov1966), style B or careful speech is considered a conservative choice as the most similar style for comparison.
Because the data are drawn from informal interview speech, a contextual style that Labov (Reference Labov1966) and Labov et al. (Reference Labov, Ash and Boberg2006) concluded remains nonrhotic, the analysis will provide an important perspective on the characterization of the change toward rhoticity as a feature of formal speech.
The sample
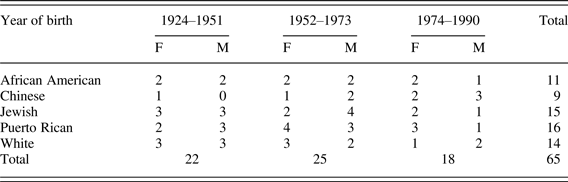
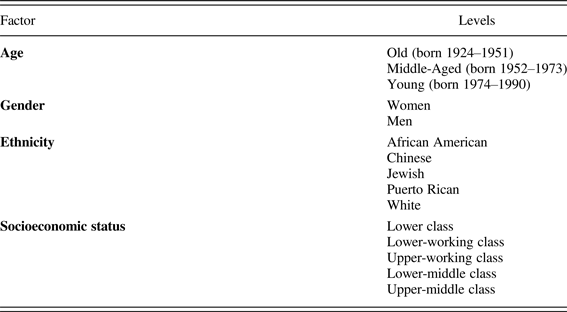
Speakers were identified through a snowball sampling technique. An effort was made to identify and interview native residents of the Lower East Side, although any Lower East Side resident who expressed interest in the oral history project was interviewed by the author. A total of 105 interviews were conducted, of which 65 were selected for the sociolinguistic sample.Footnote 5 Three social categorizations were used to fill “cells:” age, gender, and ethnicity. Speakers were selected into three age bins that allowed for an even distribution by age. The sample is balanced for men and women, and fairly balanced across five ethnic groups (see Table 2).Footnote 6
The community sample of the Lower East Side, by age, gender, and ethnicity
Ethnic categories reflect the current demographic makeup of the Lower East Side neighborhood. Speakers were categorized using their own emic reports of ethnic group membership in combination with the etic categorizations used by the U.S. Census (Hoffman & Walker, Reference Hoffman and Walker2010). The term white refers to members of what were once the dominant white ethnic groups on the Lower East Side, including Irish, Italians, Polish, and Ukrainians. Today these residents of European ancestry self-identify simply as white, a common supraethnic term of reference in contemporary U.S. society (Fought, Reference Fought2006). Exceptions to this practice are the 15 residents who identified as Jewish; these individuals saw their ethnicity as similar but not identical to a white identity. Chinese speakers are of Cantonese heritage, although two participants included in this category are of mixed heritage but identified as Chinese. The term African American is adopted here in the sense of Baugh (Reference Baugh1999) to indicate that these speakers all have roots in the American South, although the term black was used seemingly interchangeably by many community members. Finally, the term Puerto Rican is used for residents of Puerto Rican heritage, many of whose families arrived on the Lower East Side during the large influx of immigration from Puerto Rico in the decade following World War II (Zentella, Reference Zentella, Fishman and Garcia1997).
Coding
Two analysts auditorily coded tokens of (r) for the presence or absence of rhoticity. Tokens were coded as 1: [r-1] (presence of constricted /r/); 2: [r-0] (vocalic or deleted /r/); or 3: partially constricted or ambiguous. The agreement rate between these two coders was 94%. A third coder auditorily coded the remaining 6% of tokens about which there was disagreement, and the majority code was used for analysis. With the addition of a third coder, the unclear codes were resolved, resulting in a binary response variable for (r). The dataset consists of 19,284 tokens of (r), or an average of 298 tokens per speaker. Although the unreliability of auditory coding of (r) by sociolinguistic researchers has been documented (Yaeger-Dror, Kendall, Foulkes, Watt, & Johnson, Reference Yaeger-Dror, Kendall, Foulkes, Watt and Johnson2009), reliable acoustic correlates of rhoticity have yet to be identified. Furthermore, the use of auditory coding allows for direct comparability with other research on (r). An [r-1] index for each speaker was calculated by dividing the total instances of constricted /r/ by the total number of environments for (r).
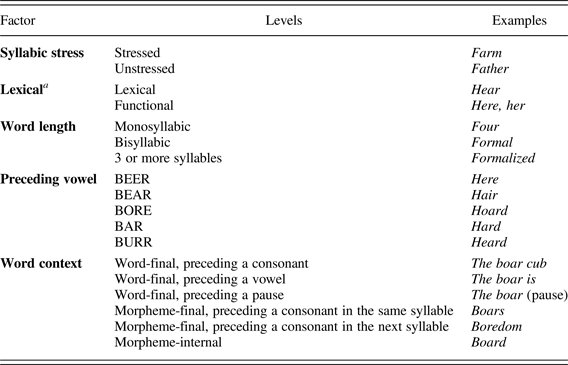
Table 3 presents an overview of the internal factors investigated. Significant differences are well attested in the literature for syllabic stress, with stressed syllables normally the most favoring context for [r-1]; the lexical status of the word, with lexical words normally favoring [r-1] more than function words; and word length, with shorter words favoring [r-1] more than longer words. The preceding vowel factor has five levels corresponding to the surface vowel quality of the preceding segment and includes both stressed and unstressed tokens.Footnote 7 Some prior studies have split the centralized vowels of the burr class into stressed and unstressed levels, finding stressed burr to favor [r-1] more than unstressed burr and more than full vowels do (Blake & Shousterman, Reference Blake and Shousterman2010; Nagy & Irwin, Reference Nagy and Irwin2010), whereas earlier studies excluded stressed burr on the assumption that [r-1] was categorical in this environment (Labov, Reference Labov1966). The present study treats syllabic stress as a separate factor in order to include the 503 secondarily stressed and unstressed tokens with preceding full vowels (i.e., arcade, atmosphere, welfare, uniform). The word context factor is a combined factor that incorporates both following environment and word position, following Nagy and Irwin (Reference Nagy and Irwin2010). Note that word-final /r/ preceding a vowel in the following syllable (the boar is), often referred to as linking r, is included in the analysis. Although many studies have excluded this environment on the assumption that /r/ is never vocalized or absent in this position (Feagin, Reference Feagin, Edmondson, Feagin and Muhlhausler1990; Labov, Reference Labov1966; Labov et al., Reference Labov, Ash and Boberg2006), prior research in New York City (Becker, Reference Becker2009) and in Boston (Nagy & Irwin, Reference Nagy and Irwin2010) has found variable nonrhoticity in this position.
Internal factors and levels
Note: aNo more than five tokens of a single lexical of function word were coded for a given speaker.
Table 4 presents the external factors and levels for analysis, including age, gender, and ethnicity, factors that influenced the sample design. In addition, each speaker in the sample was assigned a class score using three traditional measures of socioeconomic status: education, occupation, and housing type (Becker, Reference Becker2010). Scores ranged from 4 to 19, which were then collapsed into five ranked class groups that correspond to five traditional socioeconomic categories, from lower class to upper-middle class.
External factors and levels
Statistical models are all mixed-effects logistic regressions using the binary response variable [r-1] versus [r-0], with [r-1] as the application value, run in Rbrul (Johnson, Reference Johnson2012). Models were fit by stepping down from a full model including the internal and external factors as fixed effects, and speaker and word as random effects. The following sections first present the full sample data analysis. Then separate regression analyses for each of the five ethnic groups are presented and compared.
RESULTS
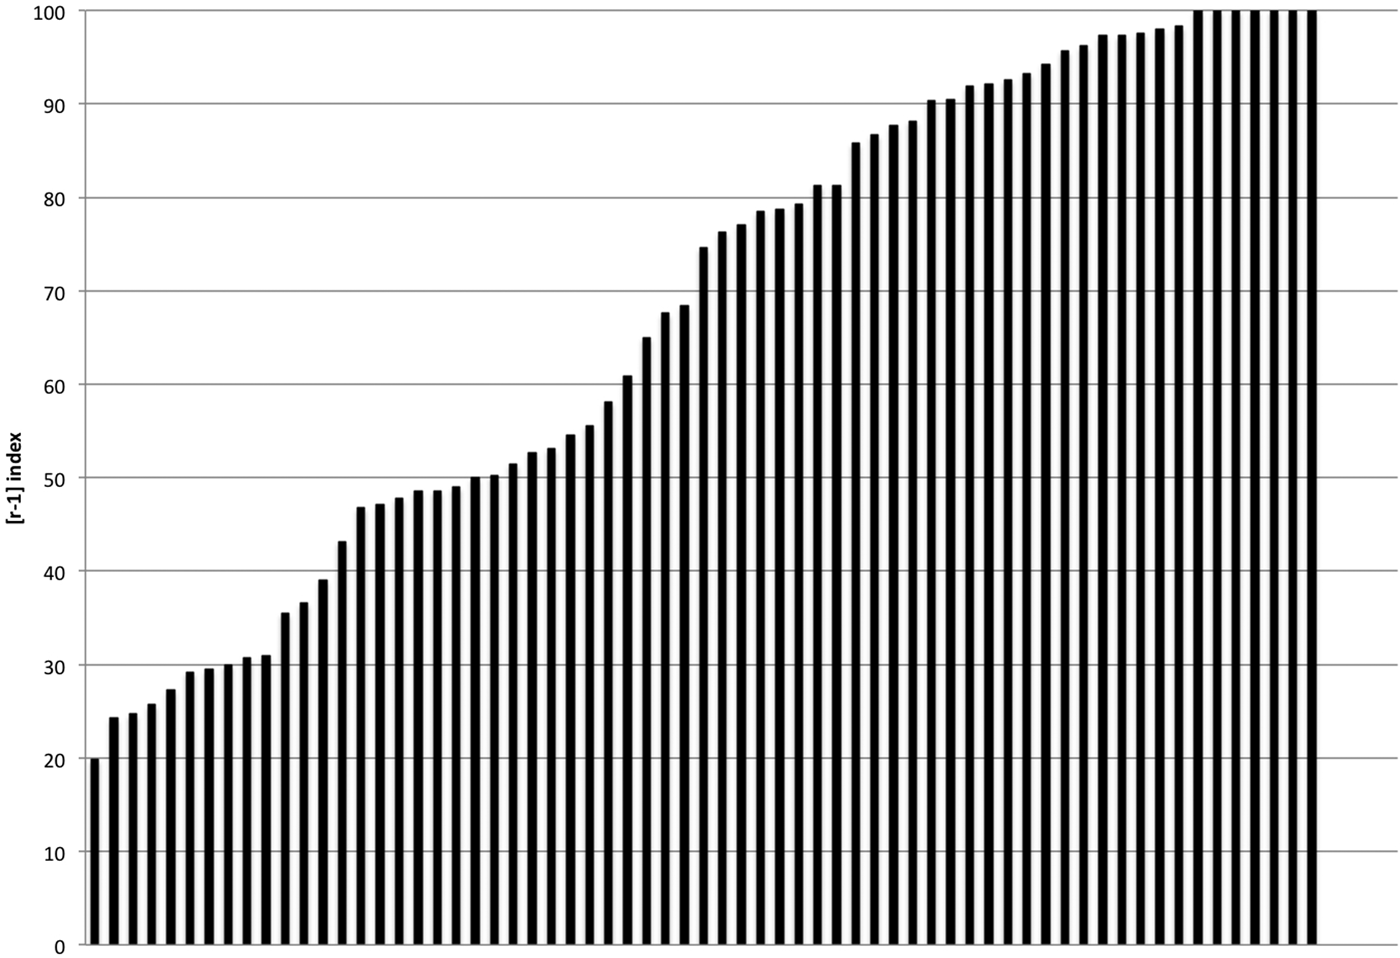
Figure 3 confirms the general advancement of the change to rhoticity in the Lower East Side community. Speakers range from an [r-1] index of [r-19] for the most nonrhotic speaker to an index of [r-100]. Seven speakers are categorically rhotic, whereas none are categorically nonrhotic. The sample has a mean [r-1] index of [r-68].
[r-1] indexes for the full sample (n = 65).
The full sample
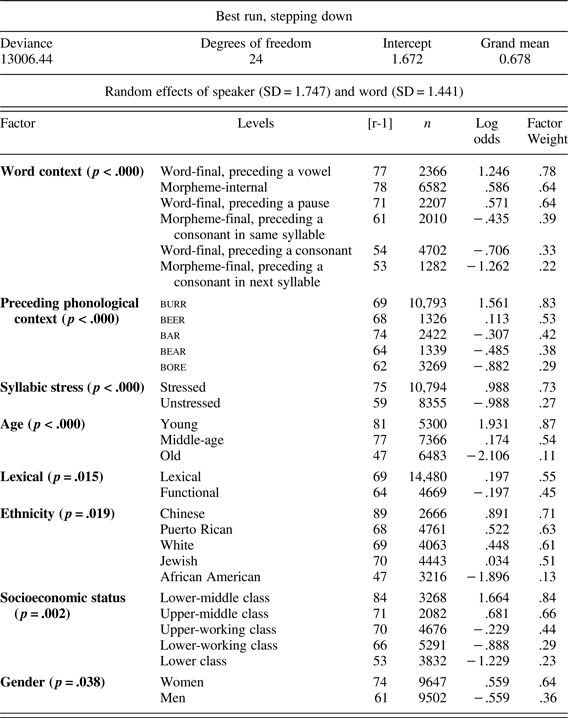
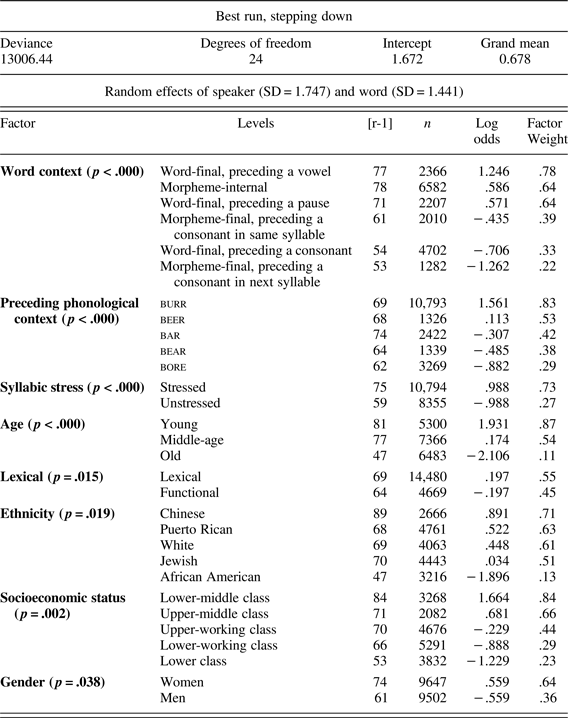
Table 5 presents the best-fit model using main effects only for the full sample of 65 speakers. The first column of Table 5 lists the factors that were selected as significant predictors of [r-1], with their corresponding p-value. The second column lists the levels within each factor, ordered from largest to smallest factor weights. The third column lists the [r-1] index for that level, and the fourth lists the n for that level. The fifth column lists the log-odds, units that are a logistic transformation of probabilities and are equivalent to centered factor weights. Factor weights are listed in the final column and will be referenced in the subsequent discussion of favoring and disfavoring contexts for [r-1].
Mixed-effects logistic regression for the full sample, main effects
Internal factors
All internal factors are significant except for the word length factor. In the word context factor, word-final /r/ preceding a vowel, or linking r, is the most favoring context for [r-1], but it is not categorical as some prior scholarship has assumed (Feagin, Reference Feagin, Edmondson, Feagin and Muhlhausler1990; Labov, Reference Labov1966). Other environments that favor [r-1] are morpheme-internal (board, card) and word-final, prepausal (the boar). Morpheme-final /r/, both preceding a consonant in the same syllable (boars) and in the next syllable (boredom) disfavors [r-1], as does word-final /r/ before a consonant (the boar cub). For preceding context, the central vowel burr is the most favoring context for [r-1] (FW = .83). Although some scholars have found that front vowels lead back vowels in favoring [r-1] during change in progress (Feagin, Reference Feagin, Edmondson, Feagin and Muhlhausler1990), that pattern is not evident here. The high front vowel beer does favor [r-1] (FW = .53) more than any other full vowel, but the mid-front vowel bear disfavors [r-1] (FW = .38), as do the back vowels bar (FW = .42) and bore (FW = .29). For syllabic stress, /r/ in stressed syllables highly favors [r-1] (FW = .73), whereas /r/ in unstressed syllables is highly disfavored (FW = .27). Nagy and Irwin (Reference Nagy and Irwin2010) argued that the finding that stressed schwa favors [r-1] more than unstressed schwa does is a universal finding in studies of North American variable nonrhoticity. Here, vowel quality is treated separately from stress, but the fact that both burr (whether stressed or unstressed) and /r/ in stressed syllables are both the most favoring contexts for [r-1] in their respective factors aligns with this suggestion. For lexicality, /r/ in lexical words favors [r-1] (FW = .55), whereas /r/ in function words is disfavored (FW = .45).
External factors
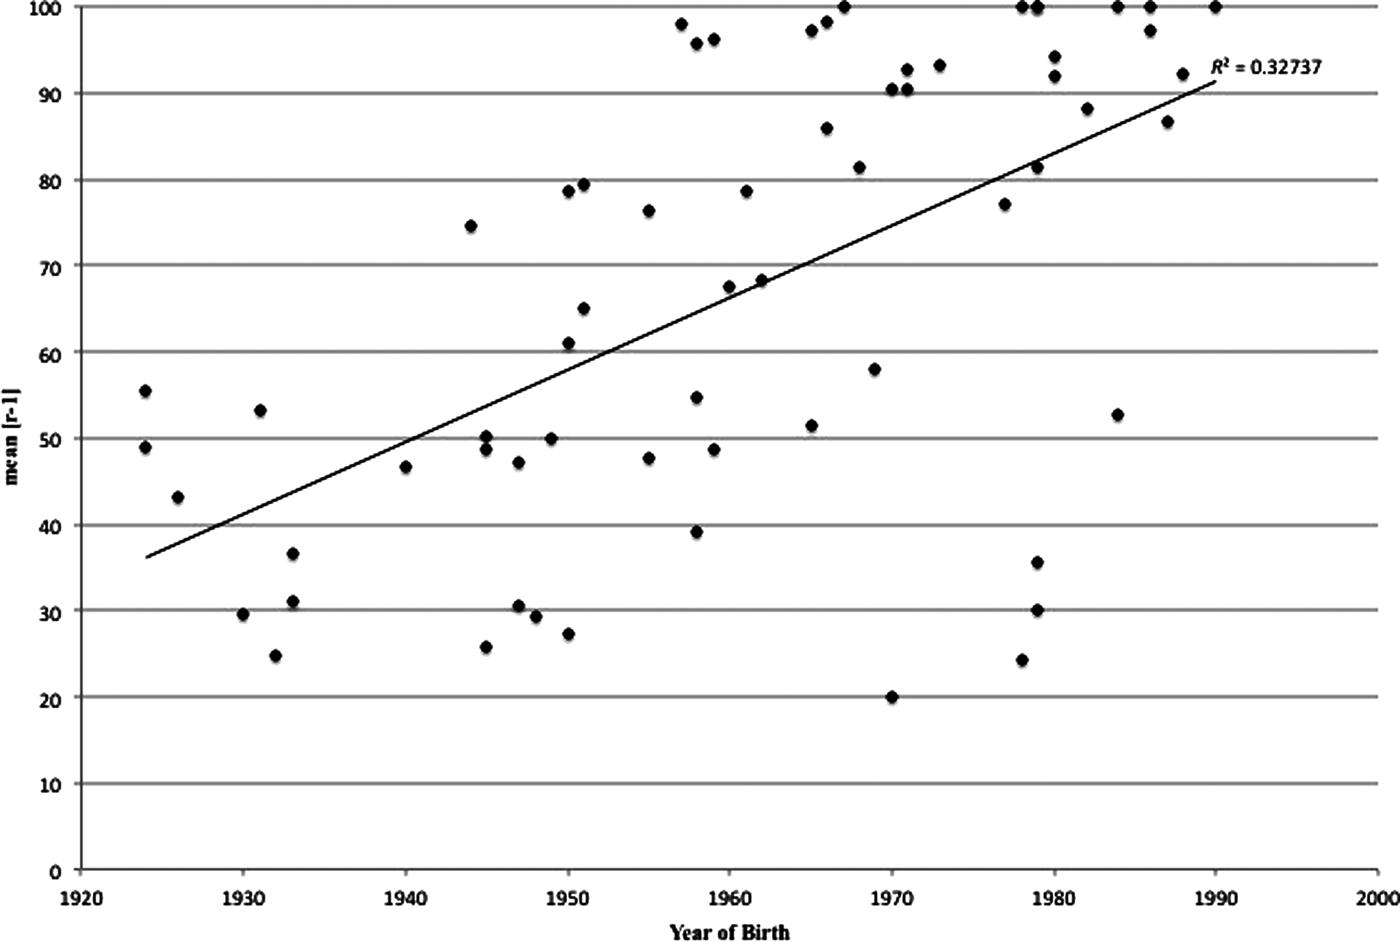
The results for external predictors of [r-1] confirm a change in progress from above for (r): younger speakers, women, and middle-class groups all favor [r-1]. Age is a highly significant predictor of [r-1], with the expected pattern for a change in progress: young speakers highly favor [r-1] (FW = .87), middle-aged speakers slightly favor [r-1] (FW = .54), and older speakers highly disfavor [r-1] (FW .11). Figure 4 demonstrates this relationship by plotting each speaker's [r-1] index by their year of birth, with older speakers on the left and younger speakers on the right. There is a significant positive correlation between [r-1] and age, with [r-1] increasing as a function of year of birth (r 2 = .33 p = .000). The overall view is one of apparent time change in the direction of rhoticity.
Mean [r-1] by speaker year of birth, full sample.
Other social patterns confirm the prestige of (r), particularly the findings that middle-class groups (the lower-middle and upper-middle classes) and women favor [r-1], whereas speakers from lower-class groups (the upper-working, lower-working, and lower classes) and men disfavor [r-1]. These results are in line with research demonstrating that speakers of higher-class backgrounds and women lead in the use of prestige variants in cases of change from above (Labov, Reference Labov1994).
Finally, ethnicity is a significant predictor of rhoticity. Chinese speakers strongly favor [r-1], and have the highest mean [r-1] of any ethnic group ([r-89]). Puerto Rican, white, and Jewish speakers also favor [r-1] and have similar mean [r-1] indexes, though Jewish speakers only slightly favor [r-1] in the model. African American speakers strongly disfavor [r-1] (FW = .13) and have a mean [r-1] index of [r-47], which is much lower than for other ethnic groups.
Ethnic groups separately
Two questions motivate the separate regression analyses by ethnic group. First: Do all ethnic groups participate in the NYCE system of variable nonrhoticity? Table 5 confirms that speakers of all ethnic backgrounds are variable for (r). However, a quantitative analysis of the full sample assumes that speakers of all ethnic backgrounds use the NYCE variety, and specifically that they share the same system for variable nonrhoticity. Here, a comparison of significant factors and constraint rankings is used to assess the similarity of these ethnic group's systems. A number of studies have compared the results of regression analyses to argue that some varieties do or do not have a common source, particularly in the literature on African American English (Poplack & Tagliamonte, Reference Poplack and Tagliamonte2001; Rickford, Reference Rickford2006). Recently, Nagy and Irwin (Reference Nagy and Irwin2010) compared subgroups of their New England sample for [r-1] to determine dialect similarity. Based on this comparison, they argued that younger and older Bostonians are members of the same speech community and that (r) has traveled by transmission there; in contrast, New Hampshirites have acquired (r) through diffusion as a result of contact with Boston. Here, two types of evidence are used to compare the constraints on variable nonrhoticity for five ethnic groups: (1) the significance of factors, and (2) the similarity of constraint rankings (or the ordering of levels) within factors. A high level of similarity will support the argument that members of these ethnic groups, which include both white and nonwhite speakers, should be considered together in accounts of NYCE. A lack of similarity will suggest that use of (r) is not attributable to NYCE for all groups.
A second question concerns change in apparent time: Do all ethnic groups participate in the change in progress toward rhoticity? Whereas the preceding analysis identifies ethnolinguistic variation in the sample, separate runs can confirm whether or not age is a significant predictor of [r-1] for each ethnic group. Because the prior research on NYCE (r) that has established change in progress is based on data from speakers of European ancestry (including white and Jewish speakers), separate analyses by ethnic group will confirm the role of ethnic identity in change, contributing to our understanding of (r)'s advancement on the Lower East Side.
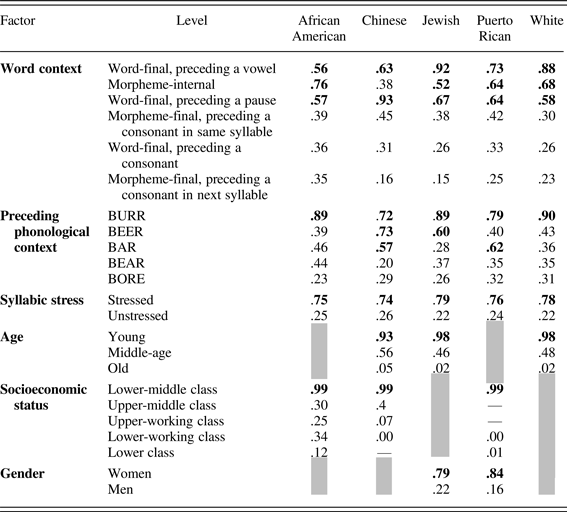
Table 6 summarizes the results of five separate regression models by ethnic group.
Five regressions for each ethnic group, main effects
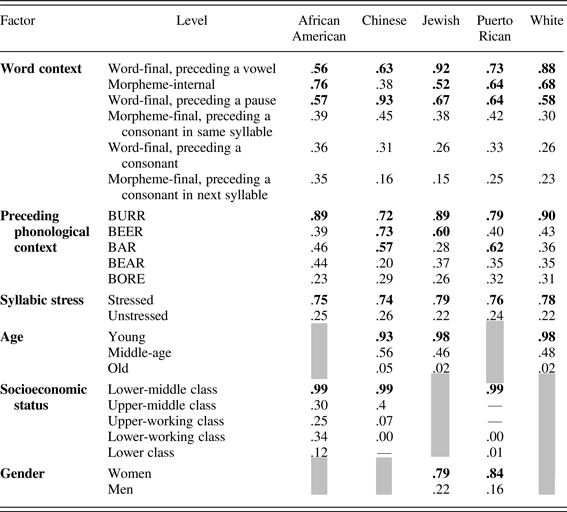
Note: Factors that were not selected in a run are grayed out. The factors lexical and word length are not included here as they were not selected as significant for any group. For factors that were selected, only the factor weights are reported for comparison purposes. Levels that favor [r-1] are in bold.
INTERNAL CONSTRAINTS
A comparison of the internal constraints on variable nonrhoticity finds a high level of similarity across ethnic groups. The number of significant internal factors is the same for all ethnic groups. In each ethnic group, word context is the most significant predictor of [r-1], followed by preceding context and syllabic stress. No runs selected lexicality or word length as a significant predictor.
Within factors, the ordering of levels is also similar across groups, although not identical. In the word context factor, African American, Jewish, Puerto Rican, and white speakers all agree on the levels that favor [r-1]—word-final /r/ before a vowel, morpheme-internal /r/, and word-final /r/ before a pause—and those that disfavor [r-1]. Chinese speakers differ in that word-final /r/ before a pause is the most favoring context for [r-1], whereas morpheme-internal /r/ disfavors [r-1]. African Americans also differ from other ethnic groups in their treatment of linking r (word final /r/ preceding a vowel) in that it is not the most favoring context for [r-1], but only weakly favors [r-1] (FW = .56). Labov (Reference Labov1972a) argued that the infrequent use of linking r by African Americans was a reason to consider this group separately from white New Yorkers, and here as in that study, African Americans use far less linking r than their white counterparts do. However, whereas the African Americans in 1970s Harlem used almost no linking r, here African Americans do favor [r-1] in the linking context, a finding that differs from the prior literature and aligns with the behavior of the other groups here.
For preceding context, the burr class is a highly favoring context for [r-1] for all ethnic groups. Some groups show a sharp division between burr and the other vowel classes, such that burr is the only favoring context for [r-1] (African Americans and whites), whereas other groups show a more graded constraint ranking (Jewish and Puerto Rican speakers). Chinese speakers differ from other groups in that a full vowel, beer, most strongly favors [r-1], though burr strongly favors [r-1] as well. Although the mid-vowels bear and bore are disfavoring contexts for [r-1] for all ethnic groups, and beer and bar are often favoring contexts for [r-1], no overall pattern for preceding full vowels is evident.
The similarities for internal constraints across New York City ethnic groups become more apparent when compared with the broad overview of quantitative studies of (r) in North American English presented in Nagy and Irwin (Reference Nagy and Irwin2010). Based on their meta-analysis, the effect of stress (that stressed syllables favor [r-1]) is universal, and so should not be taken as evidence of dialect similarity. In contrast, inconsistent results have been found for word context and preceding vowel, and the authors concluded that these factors operate differently in different communities and can be used to diagnose dialect similarity. In the data here, the finding that these factors are significant for all five groups, and that the ordering within levels is consistent within factors, is a strong indication that these five ethnic groups share the same system of variable nonrhoticity.
EXTERNAL CONSTRAINTS
Although the ethnic groups are similar in terms of the internal patterning of constraints on (r), the social predictors are less comparable. Only three groups select age as a significant predictor of [r-1], with young speakers leading in an apparent time change in the direction of rhoticity: Chinese, Jewish, and white speakers. The runs for African Americans and Puerto Ricans, on the other hand, do not select this factor. Although the full sample regression found that age was a highly significant predictor of [r-1], and Figure 4 confirms a change in apparent time for the sample, a closer look reveals that only Chinese, Jewish, and white speakers are participating in the change to rhoticity.
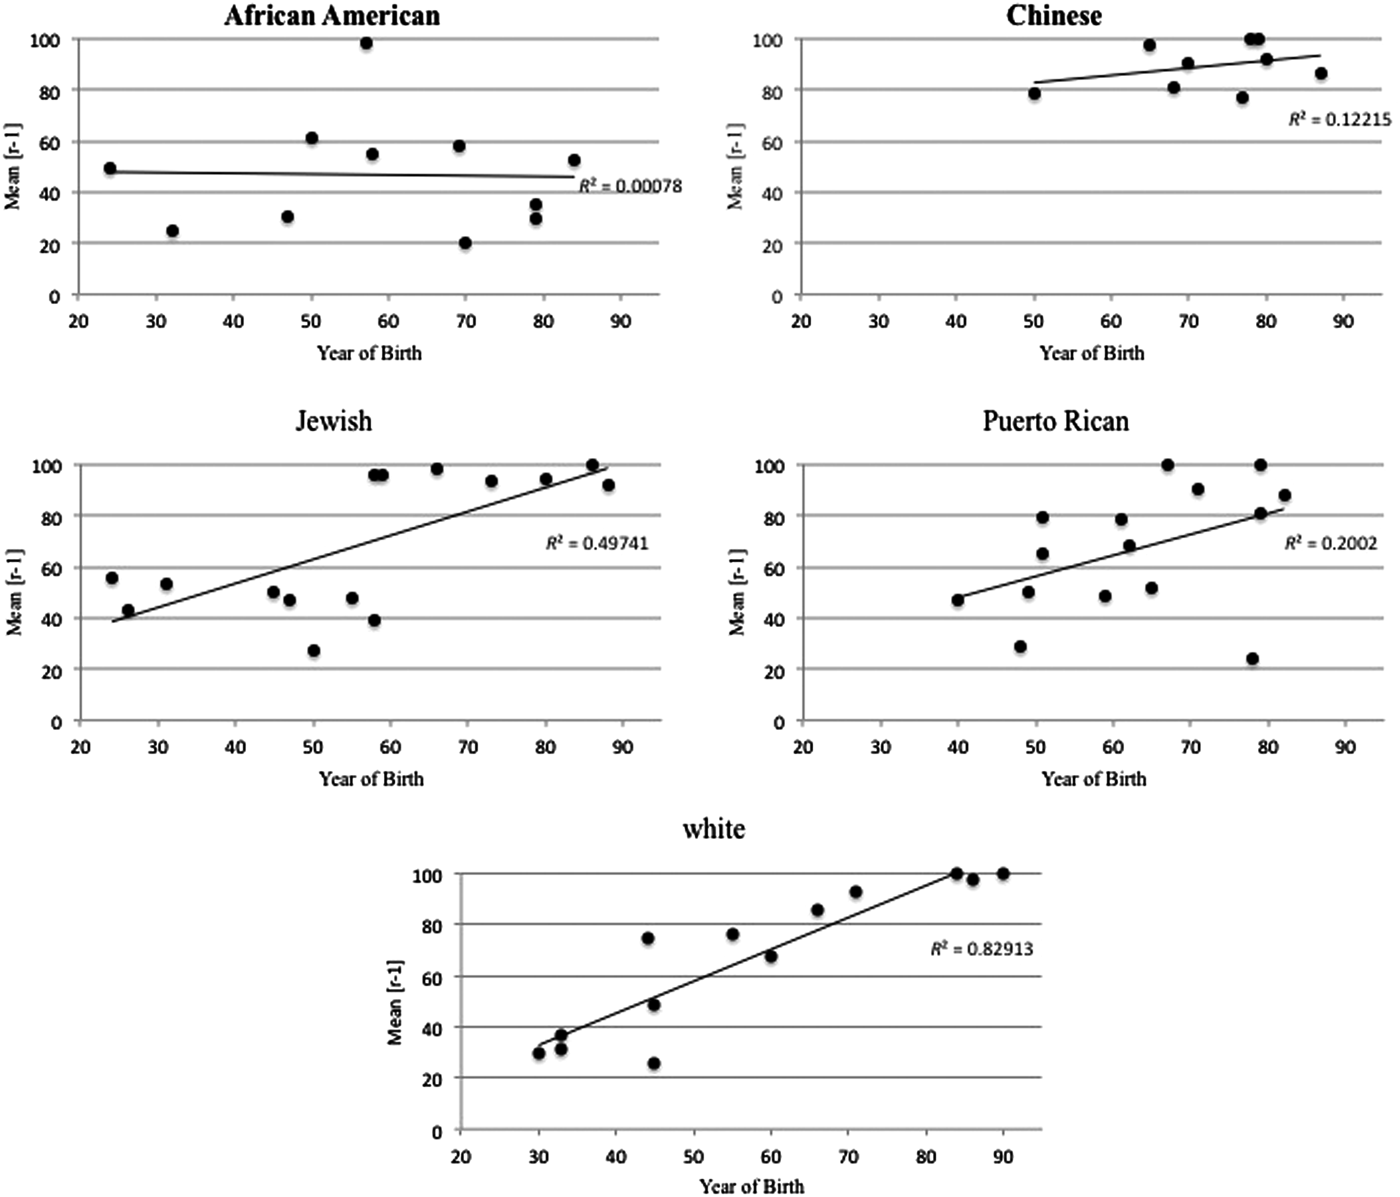
Figure 5 plots the speakers from each ethnic group in separate panels, showing their [r-1] indexes by year of birth. Two ethnic groups show a significant positive correlation between [r-1] and age, with [r-1] increasing as a function of year of birth—white speakers (r 2 = .83, p < .000) and Jewish speakers (r 2 = .50, p = .002). It appears that Jewish speakers born before 1960 demonstrate a generational break with lower mean [r-1]s in contrast to speakers born after 1960 who all show mean [r-1]s above [r-90]. This break corresponds roughly to the noted turning point of World War II as a catalyst for the change to rhoticity. There is a weak positive correlation for Puerto Rican speakers that is not significant (r 2 = .20, p = .080). There is an even weaker correlation for Chinese speakers that is also not significant (r 2 =.12, p = .180), although the visual trend is positive. The lack of a significant correlation for Chinese speakers, despite the selection of age as a significant predictor in the regression analysis, may be a result of the relatively truncated sample of Chinese speakers across years of birth, with only one speaker born before 1950. Finally, African American speakers show almost no correlation between year of birth and [r-1] (r 2 < .00, p = .480).
Mean [r-1] by speaker year of birth for five ethnic groups.
In addition to the findings for age, a theme that emerges in the comparison of social factors is a confirmation of the prestige of [r-1]. Socioeconomic status is a significant predictor of [r-1] for African American, Chinese, and Puerto Rican speakers, and for all three groups the lower-middle class strongly favors [r-1], whereas all other class groups disfavor it. Socioeconomic status is not a significant predictor of [r-1] for Jewish or white speakers, a finding that is particularly interesting given the importance of socioeconomic status for the speakers of European ancestry analyzed in Labov (Reference Labov1966). Instead, gender is a significant predictor of [r-1] for Jewish speakers, and for Puerto Rican speakers, with women favoring [r-1] and men disfavoring it. The findings that women and the lower-middle class lead in [r-1] production are classic indications of the overt prestige of a variable, both of which are well documented in the sociolinguistic literature.
Labov (Reference Labov1994) has also suggested that when women and the lower-middle class lead in apparent time, there is a change in progress from above. However, without the concomitant selection of age as a significant predictor, the fact that these groups are in the lead can only confirm that [r-1] is a prestige variant for the ethnic groups in question. Most ethnic groups show some combination of factors that points toward prestige: for African Americans, the behavior of the lower-middle class; for Puerto Rican speakers, the behavior of the lower-middle class and women. For Chinese speakers, the behavior of the lower-middle class supports the picture of apparent time change that comes from the significance of age; the same is true for the favoring of [r-1] by women for Jewish speakers. For whites, age only is a significant social predictor of [r-1], which may be a sign that this group is at a later stage of change and does not indicate a lack of prestige for [r-1].
To summarize the comparison across ethnic groups, the similarity of internal factors and constraint rankings supports the use of an ethnically diverse sample in descriptions of NYCE. Speakers from both white and nonwhite ethnic backgrounds participate in the use of NYCE variable nonrhoticity through the use of similar patterns of internal constraints on (r). Although the similarity of social factors is less coherent, the prestige of [r-1] for these speaker groups is clear from the behavior of the lower-middle class and women in almost all groups. Less clear is the status of change for all ethnic groups: only white, Jewish, and Chinese speakers appear to be participating in the change to rhoticity based on apparent time analysis.
DISCUSSION
Ethnicity
The investigation of ethnolinguistic variation for (r) in NYCE finds that speakers from a range of ethnic backgrounds participate in the use of variable nonrhoticity. All five ethnic groups demonstrate coherence with respect to the internal factors and levels that condition (r). The regression analysis for each group selects the same three internal factors (word context, preceding vowel, and syllabic stress) as significant predictors of [r-1], and the levels within each factor are similarly ordered. Although prior literature has interpreted the use of variable nonrhoticity by African American speakers as evidence of ethnolectal behavior, the similarities between this ethnic group and New Yorkers from other ethnic backgrounds for internal constraints on (r) suggest that African Americans should be considered speakers of NYCE. Even the key context of linking r, though not the most favoring context for [r-1], is a favoring context for [r-1] in contrast to prior descriptions (Labov, Reference Labov1972a; Thomas, Reference Thomas2007). Chinese and Puerto Rican speakers are also consistent with other groups for internal constraints on (r). Furthermore, separate regression analyses identified social predictors that point to the overt prestige of (r) across ethnic groups: for Jewish and Puerto Rican speakers, the favoring of [r-1] by women; for African American, Chinese, and Puerto Rican speakers, the favoring of [r-1] by the lower-middle class. All of this bolsters the argument that a diverse speaker sample will more accurately reflect the use of variable nonrhoticity in NYCE.
The finding that Chinese Lower East Siders are participating in the change to rhoticity alongside Jewish and white Lower East Siders also highlights the need for ethnically diverse samples in dialectological research. Too little is known about variation in NAE for Chinese Americans. Here, they use the highest mean [r-1] of any ethnic group, and they participate in both internal constraints on NYCE (r) and the change in progress toward rhoticity. Chinese New Yorkers have also been found to participate in the change in progress away from use of another salient NYCE feature, raised bought, and to associate use of that variable with a “classic New Yorker” persona (Becker, in press; Wong & Hall-Lew, Reference Wong and Hall-Lew2014). Taken together, these findings highlight the need for more research on Chinese New Yorkers and the role they play in variation and change for NYCE.
African Americans differ from the full sample in two important ways. First, they use far less [r-1] than other groups do, confirming the general finding that African Americans are more nonrhotic than coterritorial whites are (Thomas, Reference Thomas2007). Second, neither African American nor Puerto Rican speakers are participating in the change to rhoticity based on apparent time evidence. Prior studies (Labov, Reference Labov1968; Wolfram, Reference Wolfram1974) have argued that Puerto Rican Americans adopt features used by African Americans in northern urban locales where the two groups often share social circumstances. This perspective is supported here given the similarities between the two groups for apparent time change. Although these behaviors could point to an ethnolectal interpretation of African Americans' use of (r) in NYCE, the similarities across ethnic groups for internal constraints is strong evidence of a shared system. One potential explanation comes from the suggestion that (r) is a “shared” feature for African Americans, both dialectal and ethnolectal (Wolfram, Reference Wolfram2007). Here, Africans Americans use NYCE constraints on variable nonrhoticity, but they contribute to ethnolinguistic variation in the maintenance of (r) in apparent time. Regardless of interpretation, the findings here suggest it is crucial that African Americans, as well as other nonwhite Americans, be included in dialectological research on variable nonrhoticity in NYCE and elsewhere.
The Lower East Side, like New York City as a whole, is not majority white. As such, any accurate picture of regional dialect usage, variation, and change should incorporate speakers beyond the traditional group of native residents of European ancestry. By incorporating ethnicity as a social variable in ways similar to sociolinguists' treatment of age, gender, and socioeconomic status, researchers can begin to address the intersectionality of these social factors in the sociolinguistic patterning of variables.
Apparent time results
Although speakers of all ethnic backgrounds use variable nonrhoticity in NYCE and abide by similar linguistic constraints on its use, not every ethnic group is participating in the change to rhoticity based on apparent time analysis. African Americans and Puerto Ricans are not participating in the change, although both groups are sensitive to the prestige of (r) in ways that could be indicative of change from above. In contrast, the regression analyses for white, Jewish, and Chinese speakers select age as a highly significant predictor of [r-1], with younger speakers favoring [r-1] more than older speakers do.
For white speakers, age is the only significant social predictor of [r-1]. A similar pattern was found by Baranowski (Reference Baranowski2007) for (r) in Charleston, South Carolina, where it was seen as evidence that change is at a later stage. Similarly, the change to rhoticity is most likely at a later stage for white New Yorkers than for other speaker groups. If this is the case, it is tempting to conclude that the change to rhoticity originated in white speakers groups and has since diffused to New Yorkers of other ethnicities. However, the coherence of the internal constraints on variation across ethnic groups again points to a shared system that has progressed by transmission, as diffused systems are characterized by a simplification of internal constraints (Labov, Reference Labov2007), which is not the case here. In addition, Jewish speakers are not at an advanced stage of change given the significant effect of gender, so that these two white ethnicities are not opposed to nonwhite speakers for progress of the change.
For the full sample, (r) remains the showcase variable for change from above in apparent time. Age, socioeconomic status, and gender are all significant predictors of (r), with young people, the lower-middle class, and women leading in the use of [r-1].
Real time results
The Department Store Studies have provided a rare opportunity to track change for (r) in real time. The simplicity of the rapid anonymous methodology—a brief, quantifiable interaction, with data that can be collected in a single day—means that a true trend study can be conducted by any trained fieldworker. However, as noted, the data collected by Fowler (Reference Fowler1987) and Mather (Reference Mather2012) are limited in the picture they can provide of (r)'s progress. Here, data from sociolinguistic interviews allows for hundreds of data points per speaker for a full picture of variation and change for (r). But the difference in data means that these results cannot be compared directly to the Department Store Studies and their specific predictions about (r)'s progress in real time. The closest real time comparison is with Labov (Reference Labov1966), but the current fieldwork is not a true trend study of that community sample. That being said, the mean [r-1] of [r-68] for the full sample clearly demonstrates an increase in real time when compared with Labov (Reference Labov1966). This real time progress is confirmed in the apparent time analysis, which identifies the highly significant predictor of age in the full sample and for white, Jewish, and Chinese speakers.
In the case of African Americans, real time evidence does not match with apparent time evidence. From the perspective of apparent time, there is no evidence of change. However, the [r-1] index of [r-47], although much lower than that of other ethnic groups, is dramatically higher than the rates reported in Labov (Reference Labov1972a) for interview speech, which ranged from a high of [r-25] for middle-class adults to a low of [r-0], which was the norm for Harlem youth (Labov, Reference Labov1972a:39). There has clearly been a quantitative change in real time in the use of rhoticity for African American New Yorkers. The same results were found by Shousterman, Blake, and Kelley (Reference Shousterman, Blake and Kelley2009) in their analysis of African American New Yorkers: The overall rate of [r-1] was much higher than what has been reported for African American New Yorkers in prior work, but there was no evidence of apparent time change. Although it is clear that more research is needed on African Americans and NYCE (r) to resolve this mismatch, it is worth noting that the same pattern was found in the Department Store Study comparison. In both Labov (Reference Labov1966) and Fowler (Reference Fowler1987), there was no evidence of apparent time change, yet the real time comparison led to the conclusion that progress had been made in the direction of rhoticity.
For all speakers, there has been a dramatic increase in the use of [r-1] in interview speech when compared with Labov (Reference Labov1966) and the ANAE, a finding that contradicts the suggestion that (r) remains a superposed feature restricted to formal speech. Furthermore, the fact that lower-middle-class speakers lead in [r-1] production in the full sample and for African American, Chinese, and Puerto Rican speakers, and that women lead in [r-1] production in the full sample and for Jewish and Puerto Rican speakers, indicates that rhoticity carries prestige in interview speech and is not just attended to in more formal styles. The presence of so much rhoticity in data that come entirely from interview speech and not from more formal styles indicates overwhelmingly that (r) can no longer be considered superposed.
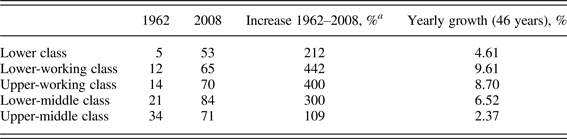
The fact that rhoticity is no longer restricted to formal speech may shed light on its acceleration in NYCE. Labov (Reference Labov1972b) argued that rhoticity was never acquired as a part of speakers' vernaculars because only adult New Yorkers were sensitive to the negative prestige of their dialect and began to use [r-1]. If rhoticity has made inroads into more vernacular speech, as these results confirm, then the rate of change will likely accelerate. Although it is not a perfect comparison, Table 7 presents a comparison of data from style B from Labov (Reference Labov1966) with the present data for five class groups. Labov (Reference Labov1966) did not report an overall [r-1] index for the full sample to compare to the mean of [r-68] for the sample here, but each class group can be compared and a growth rate calculated as with the Department Store Study comparison. In all cases, the rate of percentage of yearly growth is much higher than the rates reported in prior literature. The highest rates are found in the lower-working and upper-working classes, and the lowest rate is for the upper-middle class. All these rates notably exceed the 1.5% per year increase reported in the ANAE.
Mean [r-1] for five socioeconomic class groups, 1962 and 2008
Note: aAlthough the time period for fieldwork spanned 2006–2009, the majority of interviews were conducted in 2008, so this year was selected for comparison purposes.
The change to rhoticity was characterized as slow in part because variable nonrhoticity was still robust in NYCE, in contrast to the South where the change to rhoticity has gone to completion. Here, even using the lower-middle class's rate of 6.52% (neither the lowest nor the highest rate for a socioeconomic class group) as an approximation of the current rate of change, it would take less than seven years for the change to go to completion. If the change to rhoticity goes to completion in less than a decade, its progress should no longer be characterized as slow.
The use of percentage of yearly growth as a measure of the progress of the change assumes that change progresses in a linear fashion. In fact, most scholars assume that change progresses in a logistic fashion, starting out slowly, accelerating to a maximum, and slowing down at the end (Labov, Reference Labov1994, Reference Labov2001; Labov, Rosenfelder, & Fruehwald, Reference Labov, Rosenfelder and Fruehwald2013; Weinreich, Labov, & Herzog, Reference Weinreich, Labov, Herzog, Lehmann and Malkiel1968). This trajectory is commonly referred to as the “s-curve” for the shape of the logistic curve. Given the higher rates of change documented here when compared with the 1960s data, a reasonable assumption is that the change toward rhoticity is currently in mid-course. If this is an accurate picture, then a further assumption is that the change will begin to decelerate as it nears its end. An s-curve model also aids in the interpretation of the results from the separate ethnic groups. Jewish and Chinese, who show social patterning for (r) in addition to age, may be in mid-course for change, whereas white speakers, for whom age is the only social predictor of [r-1], may have decelerated and be at a later stage of change. Overall, the real time comparison supports an s-curve characterization of the change for the full sample, one that was slow at the early stage of documentation in Labov (Reference Labov1966), has since accelerated, and should slow down as it nears completion in New York City.
CONCLUSIONS
The negative stigma associated with NYCE is well established both inside and outside of New York City. U.S. residents rate New York City as one of the places where the worst English is spoken, viewing it as both “incorrect” and “unpleasant” relative to other North American locales (Niedzielski & Preston, Reference Niedzielski and Preston2003; Preston, Reference Preston and Schneider1996). These evaluations, working in combination with New Yorkers' own linguistic insecurity (Labov, Reference Labov1966), perhaps explain why scholars found the slow change to rhoticity in NYCE in the second half of the 20th century so notable. If nobody likes NYCE, including New Yorkers, why did they not drop a salient feature such as nonrhoticity as quickly as possible? The rate of change was surprising too in the context of the rapid change to rhoticity in Southern English, the other NAE dialect consistently rated poorly by U.S. residents.
One possible explanation comes from the finding from Becker (Reference Becker2009) that New Yorkers identify nonrhoticity with positive social meanings related to place identity. That study identified a significant increase in nonrhoticity when Lower East Side residents discussed local neighborhood topics, even for those speakers who were participating in the change in progress. If New Yorkers find value in the use of nonrhoticity to express local authenticity, then a more nuanced picture of (r)'s prestige in New York City may be necessary. Quantitative analyses of large datasets, such as those presented here, often miss the local indexical associations between variables and social meanings that are not reflected in macrodemographic categories such as age, gender, and socioeconomic status. Investigations of individual speaker practice and the social meanings of nonrhoticity in NYCE could shed light on the relatively long time it has taken for the change to advance. In addition, a focus on the ethnolinguistic variation identified here, in particular the finding that African American and Puerto Rican New Yorkers maintain variable nonrhoticity in apparent time, might also be fruitful in better understanding (r)'s progress in NYCE.
Although an explanation for the relatively slow advancement of the change to rhoticity is beyond the scope of this paper, the acceleration of the change is confirmed through a combination of real- and apparent time analysis. (r) is also found to be a systematic feature of informal speech used by speakers from a diverse range of ethnic backgrounds. Future studies will test the predictions made here regarding the impending completion of the change to rhoticity. Only real and apparent time will tell if (r) is a thing of New York City's past.