At the turn of the twentieth century, large parts of the world experienced widespread industrialization. The adoption of existing technologies as well as new technological breakthroughs profoundly altered the economic and social composition of local communities. On the one hand, these advances led to positive outcomes such as productivity growth and higher incomes. On the other hand, benefits were not equally distributed and there were short-term adjustment costs as well as a permanent loss of certain types of jobs. For better or for worse, technological progress affected local labor markets and different types of workers in different ways and continues to do so today.
In a historical setting, these later waves of industrialization are often associated with positive outcomes brought about by skill demand (Goldin and Katz Reference Goldin and Katz1998; Katz and Margo Reference Katz, Margo, Boustan, Frydman and Margo2014). Evidence of skill-biased technical change suggests that the gains from industrialization only benefited certain groups of workers, those that possessed the skills that were in demand. Another source of inequality in opportunity was related to location, as the level of development and sectoral specialization varied regionally and was related to the local supply of labor and other factor endowments (Kim and Margo Reference Kim, Margo, Henderson and Thisse2004; Kim Reference Kim2007). However, due to the gradual development of technologies, it is often not possible to go beyond description and identify relationships between technological improvements and relevant economic outcomes. For that reason, we make use of a quasi-natural experiment to identify the impact on local economic conditions and occupational outcomes for workers with different skills and backgrounds.
We provide evidence of the heterogeneous impact of rapid technological development by exploiting the expansion of hydropower technology in Norway from 1890 onward. Electrification and dam construction have been used to study historical data in other applications (see, for instance, Severnini Reference Severnini2014; Kitchens and Fishback Reference Kitchens and Fishback2015; Lewis Reference Lewis2018). Several features of the hydropower expansion in Norway suggest that it is independent of other economic activity. First, hydropower production depends on specific geographical properties—the terrain must be suitable (with a sufficient slope) and there must be enough water flow. Many of the facilities were located in remote areas with mostly agrarian production. Second, the transmission technology was still in its infancy. Hence, electrical power had to be used close to where it was produced (Vogt Reference Vogt1971; Hughes Reference Hughes1993).Footnote 1 These conditions point to a strategy of comparing outcomes across municipalities with different natural attributes. To test the validity of the approach, we apply several estimation strategies to deal with confounders. We use a geographical instrument to predict the location of hydropower production, which displays no significant relationship with municipality pre-trends. We also apply fixed effects (FE) methods and sample restrictions.
There are several reasons why Norway is a suitable context for studying changes to the local economic conditions using electrification as a quasi-independent driver of industrialization. In 1890, at the beginning of the period we study, the Norwegian economy had undergone only a limited industrial revolution (Venneslan Reference Venneslan2009). Over the next 30 years, more than 140 hydroelectric power plants would be constructed, mostly in rural areas. The technology was imported from abroad and partly financed with foreign capital. The historical circumstances make it less likely that the results are affected by unobserved characteristics and more likely that investors established power plants based on the geography of Norway. In addition, access to rich population-wide census data makes it possible for us to go further than many other studies.
To investigate the local effects of hydropower technology adoption, we proceed in two steps. First, using municipal data, we investigate how labor force size and sectoral employment shares were affected by hydropower technology. These analyses are informative in themselves and are also used to motivate and interpret subsequent analyses. Second, we examine how general and intergenerational occupation mobility varied across hydropower and non-hydropower municipalities. For this purpose, we use linked census microdata and distinguish between workers belonging to different occupational groups. We find that municipalities that adopted the new technology show signs of faster structural transformation, as hydropower municipalities display a relative expansion in employment in manufacturing at the expense of the agricultural sector. The construction of power plants and changes in the industrial structure are found to be related to the occupational mobility of workers, especially at the lower end of the skill distribution. Low-skilled manual workers were more likely to obtain higher-skilled positions in hydropower municipalities, and the intergenerational mobility of sons of unskilled workers was relatively high in these municipalities.
RELATED LITERATURE
This paper draws on several strands of literature in historical economics, the first of which provides evidence of the importance of energy technology and energy resources and tends to emphasize regional changes in sectoral composition, specialization, and productivity, as well as changes in employment and population. The second chronicles the opportunity to advance in society during periods of industrialization and technological change. We follow both avenues of investigation using plausibly exogenous variation in the implementation of new energy technology, which yields a more comprehensive understanding of the societal and economic processes taking place.
The importance of energy technology and location of energy resources for industrialization is at the core of this paper. One prominent tradition within economic history places coal at the center of the industrialization process, as it fueled the groundbreaking steam-engine and the smelting industries. In a historical setting, proximity to coal deposits and production has been studied in relation to population growth and manufacturing activity (Crafts and Mulatu Reference Crafts and Mulatu2006; Fernihough and O’Rourke Reference Fernihough and O’Rourke2014); however, there is evidence of the association turning negative in the longer run (Matheis Reference Matheis2016; Clay and Portnykh Reference Clay and Portnykh2018).Footnote 2
In contrast, the literature on the impact of dams on economic development tends to find positive effects both in the short and longer term. For instance, Kline and Moretti (Reference Kline and Moretti2014) examine the local effects of “big push” infrastructure development (under the Tennessee Valley Authority in the United States) from the 1930s onward. They find strong local effects on agricultural employment in the short run and manufacturing employment growth in the long run from such investments. Similarly, Severnini (Reference Severnini2014) finds short- and long-run growth effects on employment and population from dam construction in the United States in the first half of the twentieth century. Other contributions in the field focus on the availability of electricity and the process of electrification.Footnote 3 Kitchens and Fishback (Reference Kitchens and Fishback2015) find positive effects on rural development and agricultural productivity due to extensions of the electricity grid in the United States in the 1930s. Studying the electrification of rural areas in the United States during 1930–1960, Lewis and Severnini (Reference Lewis and Severnini2017) find increases in agricultural employment, population, and property values and Lewis (Reference Lewis2018) finds a decrease in infant mortality. Using U.S. census data from 1920 to 1940, Gaggl, Gray, and Morin (Reference Gaggl, Gray and Morin2015) show that electricity expansion leaves the population size unchanged and leads to re-allocation of workers from farms to factories with upward movement in the earnings distribution for transitioning workers.Footnote 4
We contribute by investigating changes to population and sector employment following hydropower adoption, at a detailed geographical level with full-count census data and a stringent estimation strategy. In our strictest specifications, we both impose local FE and employ an instrumental variable (IV) approach to deal with endogenous placement of plants and unobserved municipality growth paths. This yields some novel results. Also, in contrast to many of the papers in this field, the variation we are exploiting originated from a technological breakthrough interacted with local natural characteristics instead of changes being spurred by policy.
When it comes to changes in living conditions during industrialization, a key point of disagreement in the literature is when and how living standards improved following growth in the aggregate economy.Footnote 5 A seminal paper by Goldin and Katz (Reference Goldin and Katz1998) shows that the gains from technological advancements in the early twentieth century were not equally distributed among all types of workers. They provide a framework for understanding technology-skill complementarity. Using data on U.S. industries between 1909 and 1940, they find that industries that used more capital employed higher-educated workers and paid higher education premia. This contrasts with research on earlier periods, in particular, nineteenth-century Great Britain, where high-skilled workers and capital appear to have been substitutes (Acemoglu Reference Acemoglu2002). Acemoglu (Reference Acemoglu2002) argues that this difference stems, in part, from the high supply of unskilled labor in Great Britain in the nineteenth century, which provided an incentive for the development of technologies using low-skilled labor. Later, increases in the supply of skilled workers led to development of skill-complementary technologies.
Recent studies, using U.S. data from the nineteenth and twentieth centuries, show a more complex relationship between skills and new technology. Studies show that there has been a polarization of job distributions (“hollowing out”): a decrease in jobs with intermediate returns and an increase in high- and low-return jobs (Gray Reference Gray2013; Katz and Margo Reference Katz, Margo, Boustan, Frydman and Margo2014). Due to limitations in historical data, these changes are typically studied in the aggregate, as it is not possible to follow individuals over time.Footnote 6 This hollowing out pattern is also found in contemporary data (see, for instance, Autor, Katz, and Kearney 2006; Goos, Manning, and Salomons Reference Goos, Manning and Salomons2009, Reference Goos, Manning and Salomons2014), which may suggest that this has become a persistent trait of technological change.
What evidence there is on changes in individual economic trajectories (as opposed to general growth) in the period we study is generally limited to occupational outcomes. The aim of this paper is to expand on the national evidence and study regional differences in mobility. This study’s contributions to the literature are made possible by two favorable properties of the dataset. First, it stands apart by investigating occupational mobility using full-count individual data for the early twentieth century, as such data are typically not available for this period. Second, the geographical detail allows for relatively high match rates over time for workers and father-son dyads and investigation of localized effects.
The extent of occupational mobility in Europe during industrialization is generally thought to have been limited. Long and Ferrie (Reference Long and Ferrie2013) document that while intergenerational occupational mobility in the United States was high in the nineteenth century, it was much lower in Great Britain. Mobility in Norway was also low (but increasing) in the late nineteenth century (Semmingsen Reference Semmingsen1954); by most measures, Norway was less mobile than both Great Britain and the United States (Modalsli Reference Modalsli2017). To our knowledge, no previous studies have examined how intergenerational mobility is affected by place-specific technology and industrialization shocks.Footnote 7 For the same reason, little is known about changes in individual occupational trajectories (intragenerational mobility) in response to industrial development in this period. In this paper, we also contribute to the scarcer evidence of the consequences of industrialization outside of the core industrializing countries.
BACKGROUND, DATA, AND EMPIRICAL STRATEGIES
Hydroelectricity and Industrialization in Norway
Norway was a relatively late industrializer compared to the rest of Western Europe. By the end of the nineteenth century, 11.9 percent of the population was employed in manufacturing, compared to 8 percent in 1875 (Statistics Norway Reference Norway1978, p. 36). Manufacturing was mostly an urban phenomenon; this is attributed by Hodne and Grytten (Reference Hodne and Grytten2000, p. 210) to several attractive non-agricultural employment options in rural areas, including fisheries and employment at sea.
Waterfalls had been used for economic production for a long time; sawmills powered by water (“oppgangssager”) were established in the early sixteenth century (Helle et al. 2006, p. 160), and river flour mills were in use even earlier (Tvedt Reference Tvedt2000). The conversion of water potential into electrical energy greatly expanded its possible applications. The first hydropower installation in Norway (and in Europe) was constructed at Senjens Nickelworks in 1882 and had a production capacity of a meagre 6.5 kW. In Norway, the first electric plant that also functioned as a supply station for subscribers was established at Laugstol Works, a woodworking company, in 1885 (Bjørsvik, Nynäs, and Faugli Reference Bjørsvik, Nynäs and Faugli2013). Initially, the small power plants were mainly used for lighting in manufacturing plants, privately owned houses, and streets. This changed dramatically over time. Venneslan (Reference Venneslan2009) documents that total energy consumption in manufacturing from electricity-driven operations rose from 1.2 percent and 5.8 percent in 1896 and 1905 to 44.6 percent and 79.8 percent in 1910 and 1920, respectively.
The establishment of the electro-chemical industry was one of the forces that pushed the Norwegian economy into more extensive industrialization. It started at the turn of the century with the production of carbide.Footnote 8 At the time, there was a widespread fear of a world shortage of nitrogen, which was crucial to the production of fertilizer and explosives (Hodne Reference Hodne1975). Using a new electro-chemical technique to produce potassium nitrate developed by Birkeland and Eyde, in 1905, the company Norsk Hydro built the Svælgfos power plant, the largest of its kind in Europe (Jensen and Johansen Reference Jensen and Johansen1994). The invention had global economic significance, as it was critical for assuring agricultural production. Exports of saltpeter from Norway amounted to 70,900 tons in 1913 and increased to 117,000 tons by 1920 (Hodne Reference Hodne1975).
Science advanced, and new patents on the use of electrolysis for metal smelting became known. Norway had a comparative advantage in applying these methods because of its favorable hydropower production conditions, which led to the establishment of an electro-metallurgical industry. The industry produced refined iron, zinc, nickel, steel, and aluminum at competitive prices. The first aluminum production in Norway started in 1906, while the first electrical steel smelter was built in 1909 (Jensen and Johansen Reference Jensen and Johansen1994).
These hydropower-related industries boomed during World War I, and many new local industry communities were established. The cause of this upswing appears to have been the inflow of capital from abroad and increased demand for electro-chemical and electro-metallurgical products for the war machine. The rationing of coal and petroleum products also led to higher household demand for the relatively cheap electricity for use in cooking, lighting, and heating. The expansion of municipality-owned hydropower plants did not accelerate until 1905. The older municipality-owned plants were mostly located in cities and were small. In 1900, every tenth household had electric lighting, while two-thirds were covered in 1920 (Jensen and Johansen Reference Jensen and Johansen1994).
The new technology dramatically enhanced the value of previously non-exploitable waterfall resources (Bergh et al. Reference Bergh, Hanisch, Lange and Pharo1981). Norway lacked the technological competencies and financial institutions to handle the endeavors, so a substantial part of the financing came from abroad. There was a current account deficit of between 16 and 33 percent of gross investment in the period 1895–1914, and 39 percent of listed manufacturing firms were foreign owned in 1909 (Hodne and Grytten Reference Hodne and Grytten2002, p. 44). In 1909, 85 percent of the capital in chemicals, 47 percent in electricity production, and 44 percent in paper and pulp production was foreign owned (Bergh et al. Reference Bergh, Hanisch, Lange and Pharo1981).
The interest of foreign investors points to the geography of Norway being crucial to the establishment of hydropower plants. Foreign owners’ main interest is profit, whereas governments are more likely to also be concerned about the general supply of electricity and local investors may, to some extent, be steered by attachment to places and patriotism. Foreign investors are likely to compare the Norwegian waterfalls with waterfalls in other nations when deciding where to invest. Other evidence suggesting that foreign investors bought the best of the Norwegian waterfalls comes from the legal realm. Around 1905, there were public reactions against foreign penetration in the economy and the loss of the best waterfalls to foreign interests. Laws restricting private and foreign ownership of waterfall rights were enacted in 1917, mandating reversion to government ownership after 60–80 years. As a result, there were fewer private and more public projects after this year (Hodne and Grytten Reference Hodne and Grytten2002, p. 28).
Population Data, Municipal Structure, and Hydroelectric Production
In our data, the locations of hydropower plants and individuals are recorded at the municipal level. At the time, Norwegian municipalities were small units originally based on church parishes. Local government was established in Norway in 1837, with 392 municipalities. During the remainder of the nineteenth century, many municipalities split, and by 1900, there were 594. Municipalities were responsible for a range of local policies (such as schools and poverty support) and were the basic statistical accounting unit in censuses and other official publications. Urban municipalities (cities) had more extensive responsibilities.
In the period of interest for this paper, there were complete censuses of the Norwegian population in 1891, 1900, 1910, and 1920. Data on population size, employment, and sectoral employment shares were published in contemporary reports.Footnote 9 Summary statistics of selected variables from the aggregate analysis are shown in Table 1, which also displays how the means changed over time. From 1891 to 1920, the average labor force size and the employment shares in manufacturing and service sectors grew, while the primary sector share decreased.
SUMMARY STATISTICS FOR MUNICIPALITY LEVEL ANALYSES

Source: Information on population size and industry employment shares are from the Norwegian census 1891–1920. Further details are in the text and in Online Appendix A.3. Information on hydropower plants are collected from the Norwegian Water Resources and Energy Directorate (1946) and other sources, see Online Appendix A.1.
To minimize the role of confounding factors, we focus on rural areas.Footnote 10 We omit cities and municipalities adjacent to them from the sample and end up with 455 municipalities.Footnote 11 The average population of the rural municipalities in 1900 was 2,775 (std. dev. = 1,741) and the average size was 654 km2. For 1900 and 1910, we have access to full-count records of all individuals resident in Norway; we return to these data below. Descriptive statistics of all the variables used in the municipal and individual datasets can be found in Online Appendix A.
There was substantial out-migration from Norway to the United States in the period we study. The validity of our results is limited to those who are present in Norway in the census years that we consider. We note that in their study of Norwegian–U.S. migrant selectivity, Abramitzky, Boustan, and Eriksson (Reference Abramitzky, Boustan and Eriksson2012) find no evidence of any systematic selection of migrants from rural areas in Norway to the United States.Footnote 12 For this reason, we do not expect international migration to impose any substantial bias on our results. We do, however, control for emigration (aggregate emigration numbers are available at the municipality level as annual or sometimes 5-year aggregates) in our baseline econometric specifications, as detailed below.
The data on hydropower plants are taken from detailed tabulations published by the Norwegian Water Resources and Energy Directorate (1946). The publication provides information on start year and generator capacity. We omit very small plants with generator capacities of less than 500 kW, as they are not expected to have an effect on the local labor market.Footnote 13
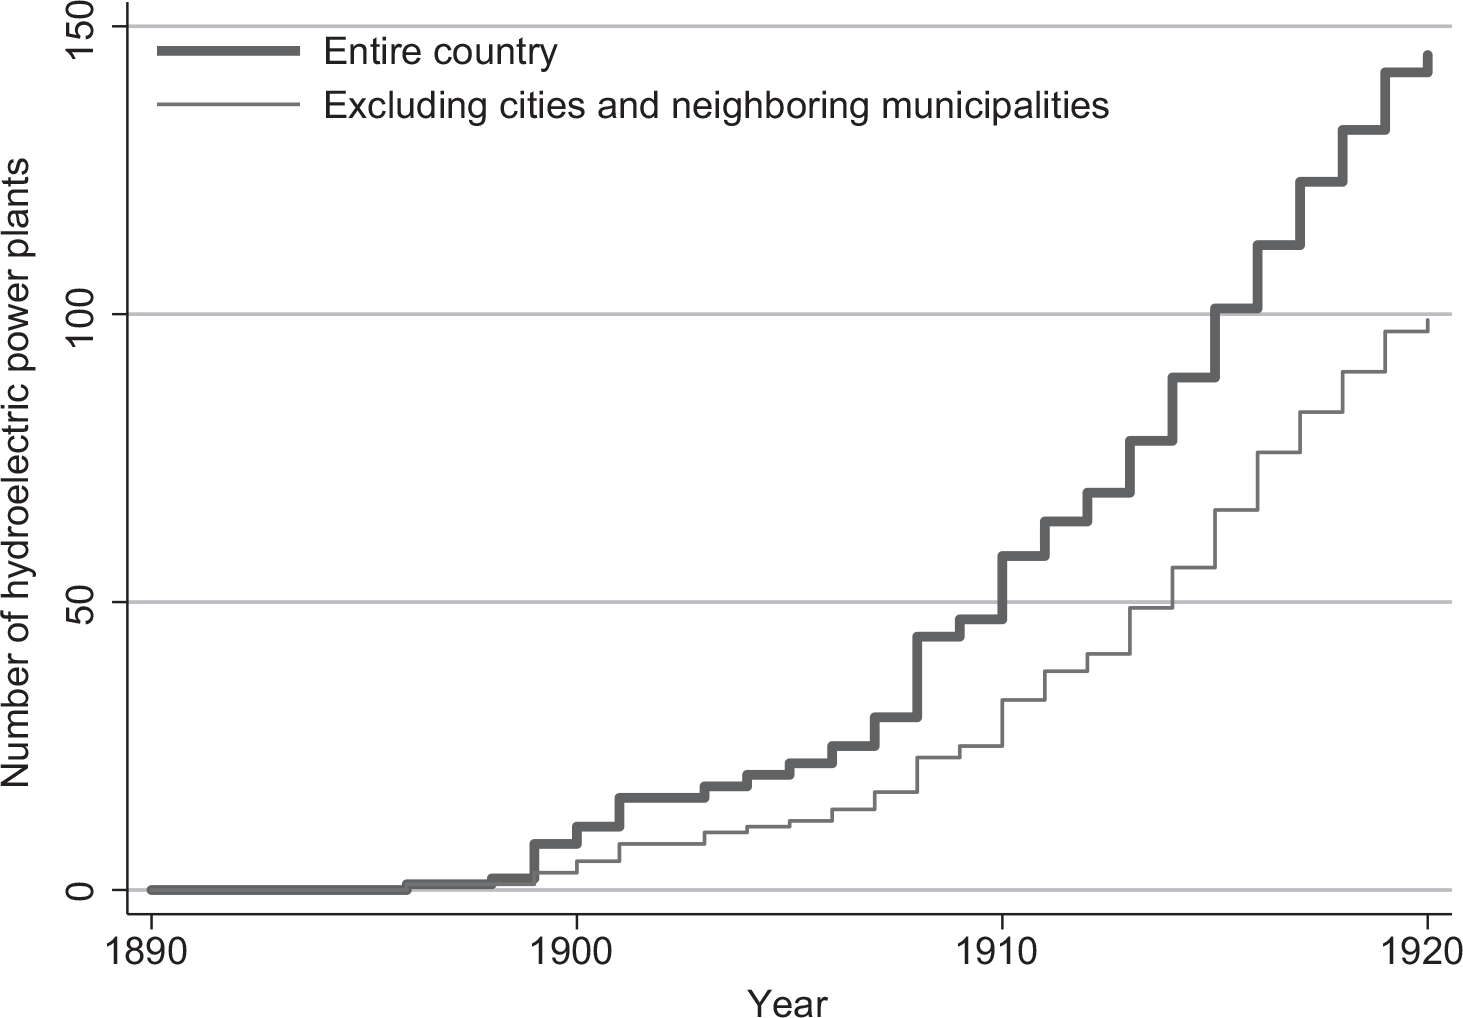
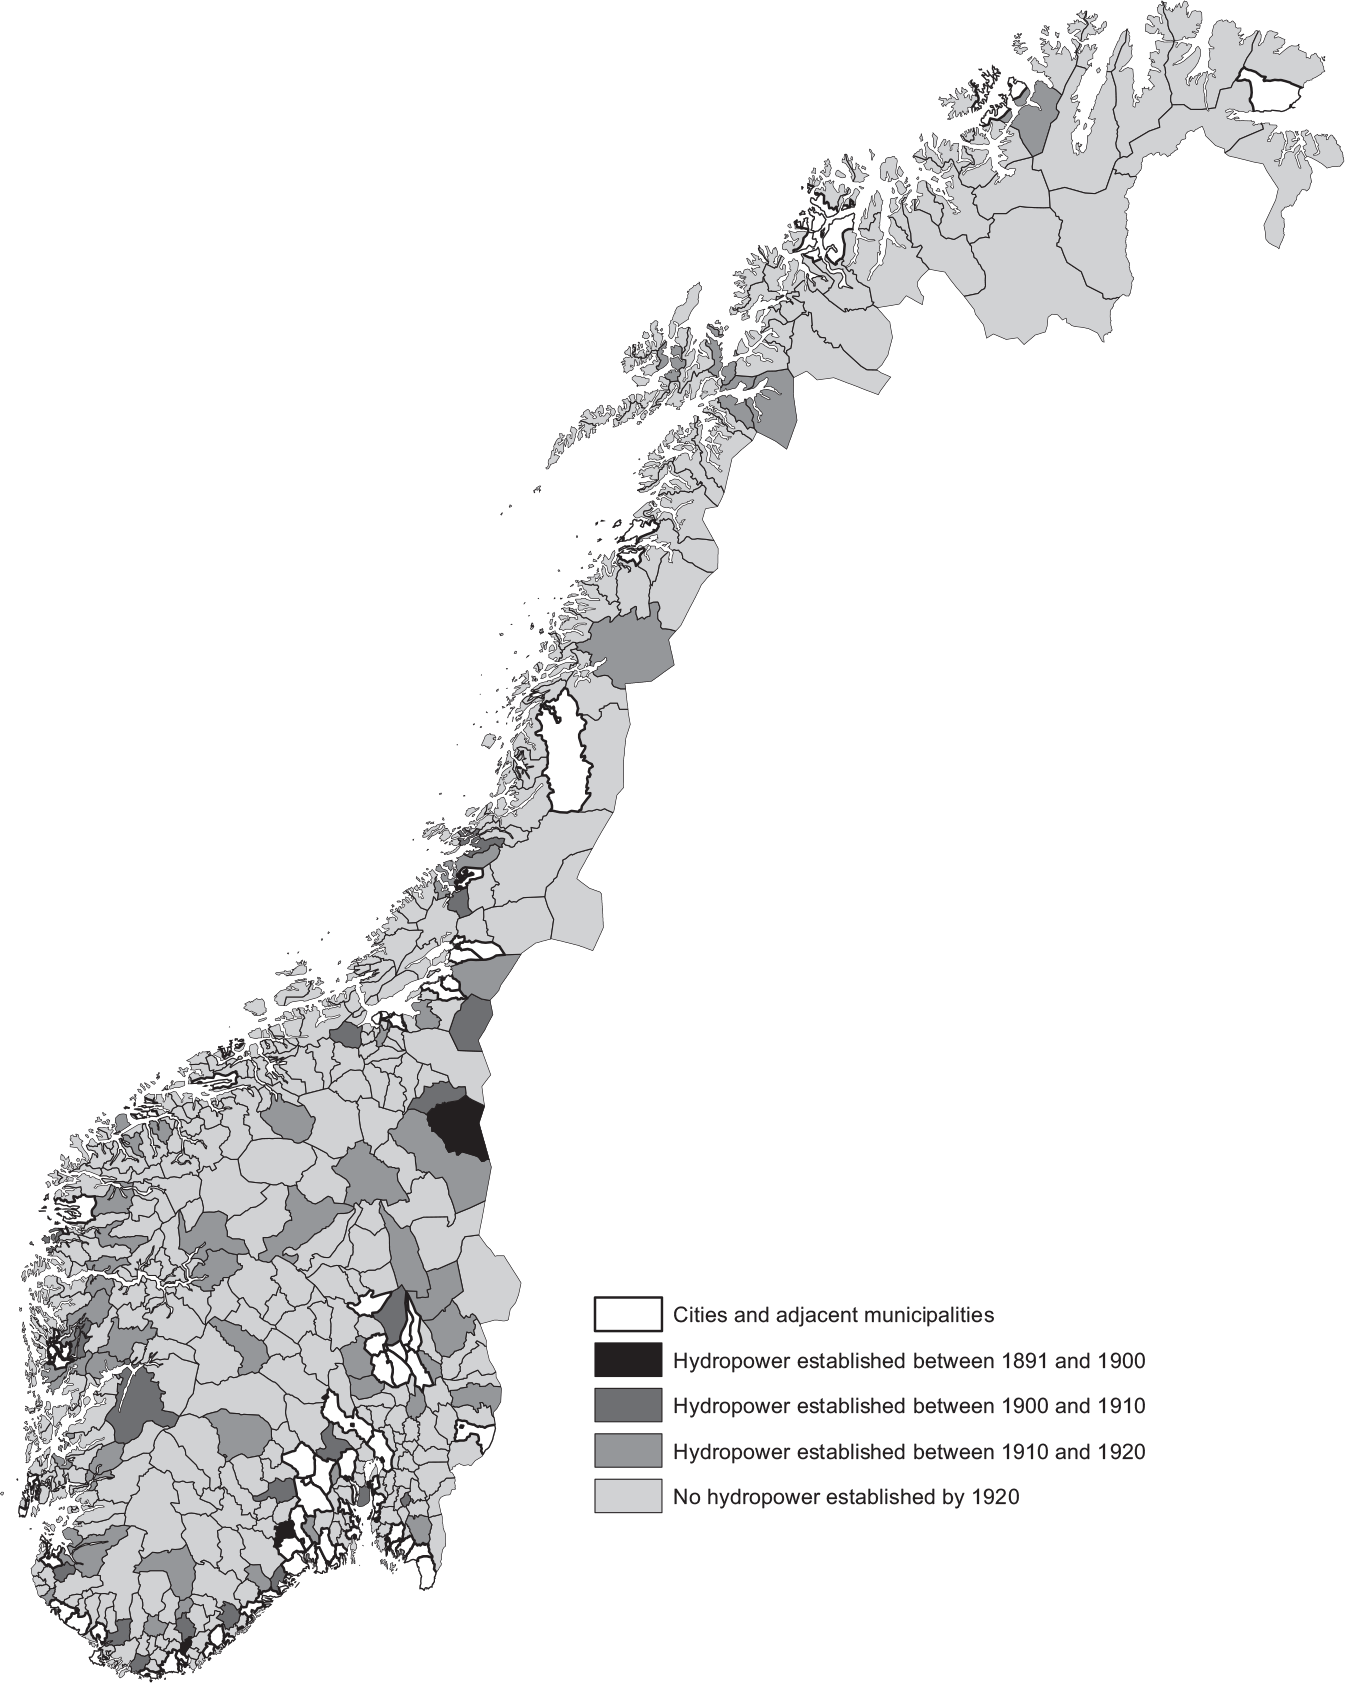
As illustrated in Figure 1, in our sample (which excludes cities and neighboring municipalities), there are 3 power plants in 3 municipalities in 1900, 25 plants in 23 municipalities in 1910, and 97 plants in 74 municipalities in 1920. The geographical distribution and start period can be seen in Figure 2. By 1920, the plants are distributed across the entire country.
NUMBER OF HYDROPOWER PLANTS, BY YEAR

ILLUSTRATION OF HYDROPOWER TECHNOLOGY ADOPTION IN NORWAY, 1891–1920

Linked Micro Data
All individual records in the censuses of 1900 and 1910 have been transcribed and made available through a collaboration between the Norwegian National Archives, the Norwegian Historical Data Centre, and the IPUMS (Minnesota Population Center 2017; The Digital Archive 2008, 2011). The records contain information on names, ages, places of residence, and occupations (coded in the HISCO standard) of all individuals resident in Norway in those two years. Of special interest is the occupation information, as it provides valuable information about individuals’ status and their place in the economy. When a parallel is drawn between occupations and standards of living, there is an underlying assumption that high-skilled occupations are better paid than unskilled occupations. Crude tabulations of incomes across the broad occupations, identical to those used in the present paper, support this assertion for Norway in the early twentieth century.Footnote 14
We linked the individual records using an algorithm that evaluates similarities in name, year of birth, and place of birth for all pairs of records in 1900 and 1910. The algorithm is presented in detail in Modalsli (Reference Modalsli2017); a summary is given in the Online Appendix Section B. The use of linked micro data in studies of economic history has recently been increasing, though most studies have been of census data from the United States (Bailey et al. Reference Bailey, Cole, Henderson and Massey2018). The methodology used here takes advantage of some special characteristics of the Norwegian data, notably that complete-count samples are available for both years and that birthplace is reported at a very detailed level (municipality).Footnote 15 It also handles the challenge that Norwegian surnames were not completely standardized in this period, so that fathers’ names and place names of origin are also taken into account. As is now common in the literature, we allow for dissimilarities in the spelling of names, as well as inaccuracies in the reporting of birth years and birth locations. In principle, a composite score for any combination of records from 1900 and 1910 is created, based on similarity in each of the four variables (first name, surname, birth year, and birth municipality). A match is accepted if it is sufficiently good (i.e., if the characteristics are similar) and at the same time unique (for instance, there are no other good candidates in either year for each of the observations). In this way, 44 percent of all men above the age of 25 in 1910 can be linked to a household in 1900.
From the linked data, we obtain information on an individual’s occupational mobility (change in occupation over these ten years) for older individuals and intergenerational mobility (comparison between the individual’s occupation and that of his father) for younger individuals. The link between father and son is obtained by observing them in the same household in 1900. The same individual linkage process for the censuses of 1865 and 1900 is used in supplementary analyses.
While the link rate in this study is substantially higher than those in other historical studies (e.g., Abramitzky, Boustan, and Eriksson Reference Abramitzky, Boustan and Eriksson2012; Long and Ferrie Reference Long and Ferrie2013), some selectivity concerns remain. As there was substantial international migration in the period under study, mainly from Norway to North America but also some return migration to Norway, knowing the “true” match shares (what one would get with 100 percent match rates) is not possible.Footnote 16
As a baseline occupation classification, we use the four categories proposed by Long and Ferrie (Reference Long and Ferrie2013): white collar, manual skilled, manual unskilled, and farmers. One way of interpreting the classification is that the first three groups constitute a hierarchy with white-collar occupations at the top. Farmers can be thought of as standing beside this occupational ladder, as their earnings potential is possibly more related to the nature of the farm (which is unobservable in our data) than to human capital. For this reason, we do not consider farmers in our baseline measure of mobility.
Skilled manual occupations feature a wide range of highly specific occupation titles and require some sort of training or formal education, while unskilled occupations are often more generic.Footnote 17 The farmer group comprises only owner-occupiers and tenants with full legal rights. The linked worker sample is restricted to workers between the ages of 20 and 50 in 1900, while for the linked father-son sample, we omit pairs where the son is below 20 or over 40 years old in 1910.
Estimation Strategies
First, we discuss how to examine changes in aggregate employment as a result of hydropower technology adoption, before turning to the investigation of occupational changes of individual workers. Let y mt denote the relevant outcomes (labor force size and employment shares in the primary sector, manufacturing, and services) in municipality m in a given year t (t = [1891, 1900, 1910, 1920]). HP mt is an indicator of hydropower production in the municipality at time t. Hydropower production is only feasible in places where certain natural features are present. If these natural features are independent of our outcome variables, hydropower production status provides as-good-as-random variation and we can estimate the average treatment effect, β 1, by ordinary least squares (OLS):
 $${y_{mt}} = \beta _0^1 + \beta _t^1 + \beta _m^1 + \beta _1^1H{P_{mt}} + {{\bf{X}}_{mt}}{\delta ^1} + \varepsilon _{mt}^1$$
However, if there were places that were perceived as more or less suitable owing to natural and other municipality characteristics, for instance, factors that affect general productivity, housing supply elasticities, and our employment variables, this would obstruct this estimation strategy. To deal with heterogeneity at the municipal level, we first control for observable characteristics of the municipalities (Xmt). This vector of municipality characteristics includes area size (km2), an indicator of coast and emigration share.Footnote 18 As infrastructure has been related to sectoral skill demand (Michaels Reference Michaels2008), infrastructure items that pre-date 1891 are also included in the vector: coach stops, railway stations, and ship and steamboat routes. Second, we include FE for each municipality (β m). The variable of interest is then identified from the within variation of municipalities, at the cost of making the results more prone to attenuation bias due to measurement error. For this reason, we report additional results where the municipality FE are replaced with 18 county FE. β t represents census FE and ε is an error term assumed to have the usual properties.
If plant locations are, to some extent, ruled by strategic decisions rooted in unobserved characteristics that also affect the municipality growth paths, the estimated relationships might be biased. For instance, the hydropower industry and other industries are likely to locate where the most appropriate supply of labor can be found. To deal with endogenous placement and confounders, we instrument hydropower production status with a measure of hydropower potential.Footnote 19 The measure is based on the geographical properties of rivers, and detailed descriptions and tests of instrument relevance and excludability can be found in the next section. The identification assumption is that conditional on observed municipality characteristics, municipality, and census FE, hydropower potential does not affect employment in the municipality except through the likelihood of hydropower plants being established.
We allow hydropower potential z m to have a different impact in each decade by interacting the measure with census FE. We expect the establishment of hydropower plants to follow a rational schedule, where the most suitable locations are developed first and marginally less suitable locations follow in subsequent steps. The first-stage results, reported later in the paper, show that this expectation is warranted with hydropower potential having an increasing impact over time. The first-stage equation is specified in the following way:
 $$H{P_{mt}} = \beta _m^2 + \beta _t^2 + {\alpha _1}{z_m}1(1900) + {\alpha _2}{z_m}1(1910) + {\alpha _3}{z_m}1(1920) + {{\bf{X}}_{mt}}{\delta ^2} + \varepsilon _{mt}^2$$
Second, we use micro data to investigate how hydropower production affected the probability of upward occupational mobility for workers over time and across generations. Individual data are only available for the years 1900 and 1910. Since the upward mobility of workers is dependent on an individual’s own or his father’s occupation in 1900, we are left with a cross section of occupational histories at the individual or “dynasty” (family) level. We omit workers who are resident in a hydropower municipality in 1900 and estimate the following specification:
 $${y_{im}} = \beta _0^3 + \beta _c^3 + \beta _1^3H{P_m}{\rm{ + }}\,{{\bf{X}}_{m,1900}}{\delta ^3} + {{\bf{X}}_{i,1900}}{\gamma ^3} + \varepsilon _{im}^3$$
Let y im be an indicator for change in occupation consistent with upward mobility for individual i. We focus on manual unskilled workers/fathers in 1900, who will have experienced upward mobility if they/their sons belong to a manual skilled or white-collar occupation in 1910.Footnote 20 In the baseline specification, HP m is an indicator of obtaining hydropower production between 1900 and 1910 in the 1900 municipality of residence.
It is not feasible to include municipality FE in the cross-sectional dataset. However, we can mitigate the influence of more aggregated area characteristics by adding county FE β c. In addition, we include the observed municipality characteristics (Xm, 1900) of the 1900 municipality of residence. Worker/son characteristics may be correlated with the opportunity to experience occupational advancement, and these traits might differ across municipalities with and without hydropower plants. We, therefore, include a vector of 1900 worker/son characteristics (Xi, 1900) that include age, age squared, indicator of being married, number of children, and an indicator of not being resident in municipality of birth. We also instrument hydropower production by hydropower potential to deal with the issues of endogenous placement of hydropower plants and unobserved confounders. The exclusion restriction is now that conditional on observed municipality characteristics, county FE, and individual characteristics, hydropower potential does not affect upward occupational mobility except through the increased probability of hydropower plants being established.
Hydroelectric Potential as an Instrument
Our measure of hydropower potential is based on natural characteristics and is similar to the instrument used in Borge, Parmer, and Torvik (Reference Borge, Parmer and Torvik2015). It is defined as follows:
 $$HydroPotentia{l_m} = {z_m} = {{\mathop \sum \nolimits_{v = 10}^{v = 750} (River{4_{vm}} \times v)} \over {Are{a_m}}}$$
The hydropower potential of a municipality is determined by the slope of the landscape, water flow, and river length. The Norwegian Water and Energy Directorate has classified rivers in Norway into water volume classes, v.Footnote 21 The gradient of each stretch of river is calculated with GIS software using a terrain model with 50 × 50-meter grids obtained from Norway Digital. Like Borge, Parmer, and Torvik (Reference Borge, Parmer and Torvik2015), we focus on river stretches with a gradient of 4 degrees or more. River4vm is meters of river with water volume class v in terrain with a slope of 4 or more in municipality m. Next, for each river class, we multiply meters of river by maximum water flow in that class. Finally, we take the sum of these products and divide by the total area (km2).Footnote 22
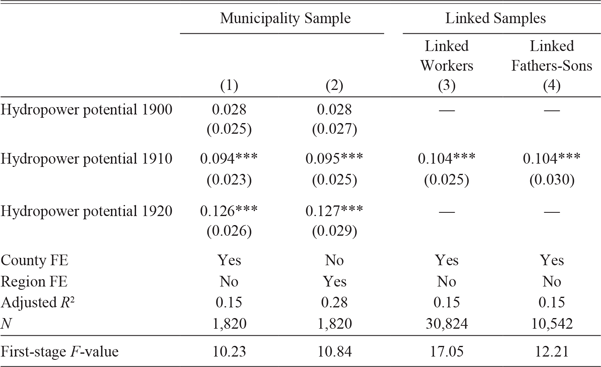
Norwegian municipalities vary widely in geographical size. We adjust the measure of hydropotential by the size of the municipality to obtain a scale-independent measure that does not favor large municipalities. To make sure that the estimated relationships are not directly affected by size, the regressions include area of land in the municipality as a covariate. The measure of hydropower potential in the municipality is time-invariant. By allowing the influence of hydropower potential to differ between census years, municipality fixed-effect estimations are feasible. This specification fits better with the expected data generation process. There is strong persistence in the location of hydropower plants, and we expect the effect of the instrument to increase and be more sharply estimated as more of the suitable locations are developed. Table 2 displays the first-stage results from the municipality and individual regressions. As can be seen, all coefficients are positive, supporting the theory that higher hydropower potential increases the probability of obtaining hydropower technology. Using the linked worker results in Column (3), increasing hydropower potential by 0.55 (e.g., one standard deviation) leads to 0.104 · 0.55 = 0.057 percentage points higher probability of residing in a hydropower municipality in 1910.Footnote 23 The impact of the instrument increases over time as the most suitable waterfalls are exploited. The first period instrument, with only a few established hydropower plants, does not provide a significant result conditional on the other instruments. However, the joint significance, demonstrated by the first-stage F-value, is high. It is also worth mentioning that the instrument coefficients are similar across the regressions carried out using the municipal panel dataset and the linked datasets.
FIRST-STAGE RESULTS, HYDROPOWER PRODUCTION AND POTENTIAL

Notes: Data from Norwegian censuses of 1891, 1900, 1910, and 1920. Columns (1) and (2) display first-stage results for the municipality regressions, while Columns (3) and (4) display the results from the linked samples. Dependent variable: indicator of hydropower production in the municipality (of residence). Variable of interest: hydropower potential per thousand (interacted with census year). All specifications control for geographical size of municipality (km2), indicators of coast, historical infrastructure variables, and lagged emigration share. In Columns (1) and (2), the regressions also control for year FE. In Columns (3) and (4), the regressions include 1,900 worker (son) characteristics: age, age squared, indicator of being married, number of children, and indicator of not being a resident in municipality of birth. Robust standard errors clustered on municipality are in parentheses. Significance levels: *** p < 0.01, ** p < 0.05, * p < 0.1.
Source: Authors’ calculations from Statistics Norway, IPUMS, ICPSR, and the Norwegian Water Resources and Energy Directorate. See text and Online Appendix A for further details.
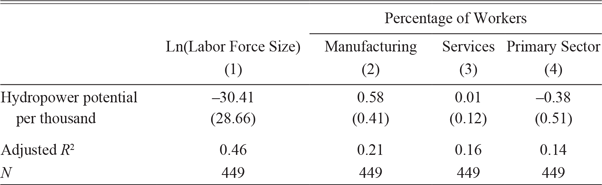
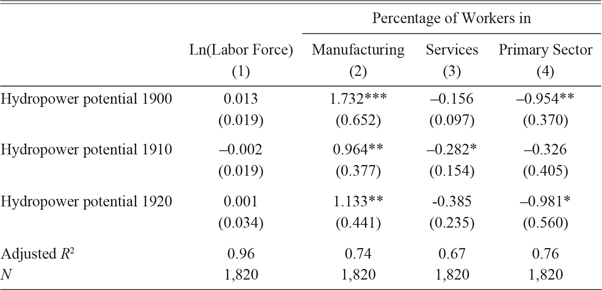
Is hydropotential a valid instrument? The exclusion condition is that, conditional on covariates, hydropower potential affects labor force size, structural transformation, and upward occupational mobility only through its effect on the likelihood of a municipality obtaining hydropower plants. In other words, hydropower potential should not be correlated with unobserved factors in the structural equation and, thereby, the error term. This condition cannot be checked directly, as it involves a relationship between the error term and the instrument(s). We argue that this restriction is likely to hold; the mechanical river power technology was small-scale compared to hydroelectric technology where rivers of greater size and steepness could be exploited. To test the excludability argument, we conduct an indirect test. We use the instrument to estimate changes in outcomes in the period 1890–1900, a period when few municipalities had established hydropower technology. We exclude municipalities with hydropower in 1900 and those that were constructing plants at that time. As shown in Table 3, the instrument (per thousand) has no significant effect on labor force size or workers in different sectors. These results strengthen the claim that the exclusion restriction holds.
ESTIMATIONS OF RELATIONSHIP BETWEEN INSTRUMENT AND LABOR FORCE SIZE AND SECTOR SIZE IN THE PRE-PERIOD, 1891–1900

Notes: Data from Norwegian censuses from 1891 and 1900. Dependent variables: natural logarithm of the labor force size (inhabitants 15 years and older) and percentage worker shares in manufacturing, services, and primary sectors. Data on sectoral affiliation are available for persons aged 15 and older and who were present at the census count. Regressions control for county FE, geographical size of municipality (km2), indicators of coast, lagged emigration share, and infrastructure variables. The regression omits municipalities that had established hydropower plants or were constructing such in 1900 or earlier.
Robust standard errors are in parentheses. Significance levels: *** p < 0.01, ** p < 0.05, * p < 0.1.
Source: Authors’ calculations from Statistics Norway, IPUMS, ICPSR, and the Norwegian Water Resources and Energy Directorate. See text and Online Appendix A for further details.
HYDROELECTRICITY AND STRUCTURAL TRANSFORMATION
The new technology made it possible to produce electrical power from waterfalls; consequently, some areas gained production advantages. In the first part of the analysis, we will investigate whether municipalities that adopted the new hydropower technology experienced a higher degree of labor force growth and structural transformation. Changes in the local labor force are determined by both demand and supply factors. If the local demand for workers exceeds the local supply, we might observe an influx of workers. Labor market changes will be harder to detect if the new enterprises absorb a local surplus of labor. In the case where workers display low geographical mobility, we might only observe substitution from one sector to another. With new technology and production processes, we expect the treated municipalities to shift from primary sector production to manufacturing production. We might also observe shifts toward the service sector if the adoption of hydropower technology caused increased local economic activity of a certain magnitude.
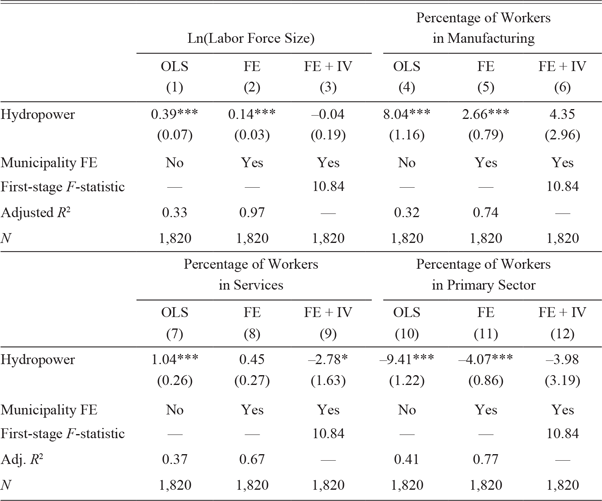
The estimated relationships between hydropower status, labor force size, and sectoral employment shares are displayed in Table 4. For each outcome, we estimate the relationship on the basis of the three specifications described above: OLS, municipality FE, and FE with IV estimation.
HYDROPOWER PRODUCTION, LABOR FORCE SIZE AND INDUSTRY COMPOSITION

Notes: Data from Norwegian censuses from 1891, 1900, 1910, and 1920. Dependent variables: natural logarithm of the labor force size (inhabitants 15 years and older) in Columns (1)–(3) and percentage worker shares in manufacturing, services, and primary sectors in Columns (4)–(12). Data on sectoral affiliation are available for persons aged 15 and older. Regressions control for year FE, county FE, geographical size of municipality (km2), indicators of coast, infrastructure, and lagged emigration share. Instruments are hydropower potential interacted with decade indicators. Robust standard errors clustered on municipality are in parentheses. The formulation of the cluster-robust covariance matrix for the IV estimates follows Arellano (Reference Arellano1987). Significance levels: *** p < 0.01, ** p < 0.05, * p < 0.1.
Source: Authors’ calculations from Statistics Norway, IPUMS, ICPSR, and the Norwegian Water Resources and Energy Directorate. See text and Online Appendix A for further details.
First, we observe that according to the FE and OLS models, municipalities where hydropower technology was implemented experience labor force expansion. These models show effect sizes of 39 and 14 percent, respectively. The effect size in the FE model is only one-third that in the OLS model, suggesting potential selection effects: The OLS result also captures underlying differences between municipalities with different natural endowments, while the FE model corrects for such differences provided they are time-invariant. The IV + FE estimate in Column (3) is non-significant and has a point estimate close to zero. If we look at the reduced form in Column (1) of Table 5, the estimate is also insignificant. Accordingly, places that obtained hydropower experienced population growth in typically working ages, but this effect might be driven by the unobservables that characterize the potential endogenous placement of plants. The result is in line with the study of Gaggl, Gray, and Morin (Reference Gaggl, Gray and Morin2015), which finds no population effects from electrification.
REDUCED FORM RESULTS. RELATIONSHIP BETWEEN NATURAL HYDROPOWER POTENTIAL, LABOR FORCE SIZE, AND SECTOR EMPLOYMENT SHARES

Notes: Data from Norwegian censuses of 1891, 1900, 1910, and 1920. Dependent variables: potential labor force size and sector employment sizes. The instruments are scaled per thousand. Estimator: OLS. All specifications control for geographical size of municipality (km2), indicators of coast, historical infrastructure variables, lagged emigration share, and municipality and census FE. Robust standard errors clustered on municipality are in parentheses. Significance levels: *** p < 0.01, ** p < 0.05, * p < 0.1.
Source: Authors’ calculations from Statistics Norway, IPUMS, ICPSR, and the Norwegian Water Resources and Energy Directorate. See text and Online Appendix A for further details.
Second, municipalities that obtain hydropower production display a substantial increase in the manufacturing employment share with the OLS and FE models (Columns (4) and (5)). Again, moving from an OLS to a FE specification reduces the coefficient estimate; the estimate falls from 8 to 2.7 percentage points, respectively. The IV + FE estimate in Column (6) is positive and indicates that the manufacturing employment share expands by 4.35 percentage points following the establishment of hydroelectric power. The estimate is, however, not statistically significant at conventional levels (p-value of 0.14). There is also other evidence supporting the reliability of hydropower-induced changes to manufacturing employment: We find positive and significant effects with the FE + IV specification for alternative definitions of manufacturing employment. Online Appendix Table D.4 shows that hydropower production increases manufacturing employment (number of workers), with 0.79 of a standard deviation, and in Online Appendix Table D.5, where manufacturing is more narrowly defined to the sizeable industries, hydropower adoption leads to 2.9 percentage points higher manufacturing employment share.
Table 3 suggests that there is no relationship between hydropower potential and sector employment in the period before the technological breakthrough. However, for each of the decades following the technological breakthrough, the reduced form result shows a positive impact of hydropower potential on the manufacturing employment share (see Column (2) of Table 5). Specifically, a standard deviation increase in hydropower potential corresponds to a 0.4- to 0.7-percentage-point increase in the manufacturing employment share in each decade.Footnote 24 The reduced form specification possesses several beneficial properties compared to the FE+IV specification. It is a less elaborate estimation strategy and it is not dependent of the accuracy of the historical hydropower plant data, which might be somewhat imprecise in respect to timing of construction and location.
Estimates of the change in the employment share in services are not very robust across specifications, as seen in Table 4. The OLS result in Column (7) suggests an increase of 1 percentage point in the employment share in services in hydropower municipalities. The FE specification does not provide a significant result, while the FE + IV specification yields a negative result (at 10-percent confidence). The reduced form results in Table 5 are also not very clear, with a slight negative effect in the decade preceding 1910.Footnote 25
The greatest employment share change is found for the primary sector. The OLS and FE specifications in Columns (10) and (11) of Table 4 suggest decreases of 9.4 and 4.1 percentage points in the primary sector employment share in hydropower producing municipalities, respectively. The FE + IV coefficient of hydropower is also negative but not statistically significant. The reduced form results suggest that there may be a decline in this sector in two of the three periods with the technology available. Investigating the change in the number of workers in the primary sectors in Online Appendix Table D.4, the decline is substantial and highly significant. Overall, the results suggest hydropower-induced structural transformation with a decline in the primary sector, while the size of the manufacturing sector increases.Footnote 26 IV + FE estimations provide rather imprecise results, but the conclusions are supported by the reduced form results and the results from the change in the number of workers in each sector in hydropower municipalities.
OCCUPATIONAL MOBILITY IN HYDROPOWER MUNICIPALITIES
Upward Occupational Mobility over Careers and Generations
The previous section shows how the adoption of hydropower technology in early twentieth-century Norway was linked to structural transformation at the local level. Before this second wave of industrialization, the mostly agrarian economy of rural areas offered little opportunity for occupational mobility. That might have changed with the hydroelectric technology breakthrough, adoption of these techniques, and the concomitant industrialization process.
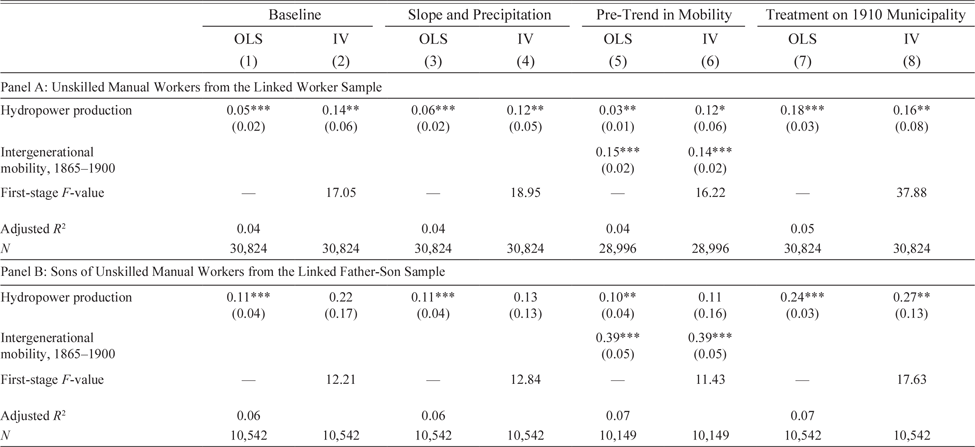
Panel A of Table 6 shows the estimated probability of upward occupational mobility for unskilled workers, depending on the hydropower status of the municipality. We compare an individual’s stated occupation in the 1900 census with the occupation stated in the 1910 census. For unskilled workers, we define “upward mobility” as transitioning to a skilled manual occupation or a white-collar occupation.
UPWARD MOBILITY FOR UNSKILLED WORKERS IN HYDROPOWER MUNICIPALITIES. BASELINE AND SENSITIVITY OF RESULTS

Notes: Data from Norwegian censuses of 1900 and 1910. Panel A displays results for unskilled manual workers in the linked worker sample, while Panel B shows results for unskilled manual workers in the linked father-son sample. Columns (1) and (2) provide baseline results. In Columns (3) and (4), we control for the share of land with a gradient of more than 4 degrees and average precipitation in the municipality. In Columns (5) and (6), historical intergenerational mobility (1865–1900) is added. In Columns (7) and (8), hydropower status is allocated to municipality of residence in 1910. In the regressions, we control for the following characteristics of worker (son) in 1900: age, age squared, indicator of being married, number of children, and indicator of not being resident in municipality of birth. All regressions include an indicator of coast, area of land, infrastructure variables, emigration share, and county FE. Robust standard errors clustered on municipality are in parentheses. Significance levels: *** p < 0.01, ** p < 0.05, * p < 0.1.
Source: Authors’ calculations from Statistics Norway, IPUMS, ICPSR, and the Norwegian Water Resources and Energy Directorate. See text and Online Appendix A for further details.
In the OLS estimation in Column (1), the unskilled workers display a higher propensity for upward occupational mobility as a result of hydropower production in the municipality.Footnote 27 The adoption of hydropower technology translates into a 5-percentage-point higher probability of upward mobility. There is no significant relationship between upward occupational mobility and hydropower adoption for farmers and skilled workers (see Online Table D.10). For farmers, owning and renting land is presumably a disincentive for occupational movement. For skilled manual occupations, the insignificant result may reflect increased employment in manufacturing and services, rather than a general shift to occupations of even higher status.Footnote 28
As mentioned earlier, the endogenous location of hydropower plants due to unobserved factors is a concern. To mitigate the influence of confounders we instrument hydropower status in the residence municipality of 1900 with hydropower potential. With IV estimation in Column (2), the point estimate of hydropower production almost triples, to 14 percentage points. However, the standard errors are also inflated, so that the IV estimates might just be slightly higher than the OLS estimates. The larger effect might be a product of attenuation bias in the OLS estimates. However, we believe that it is more likely related to catch-up. The complier municipalities may have a larger potential for upward mobility if the drivers of endogenous location of hydropower plants are correlated with higher upward mobility in an earlier period for non-compliers.
Mobility may decrease with worker experience, as occupation-specific human capital is accumulated. Focusing on workers’ occupational transitions may, thus, lead to underestimation of the mobility changes taking place in industrializing hydropower municipalities. To capture a fuller picture, we also investigate occupational mobility across generations: whether a son displays upward occupation mobility relative to his father’s occupation. We expect intergenerational mobility to be less restricted by the timing of treatment; consequently, we expect the coefficients to be higher. As can be seen from Columns (1) and (2) in Panel B of Table 6, that is the case. In the OLS specification, intergenerational upward mobility is over twice as large as intragenerational mobility. Similarly, IV estimation yields an estimate that is 8 percentage points higher but not statistically significant. There are not many unskilled fathers in hydropower municipalities in the sample (4.6 percent), which might explain the imprecise estimate.
The upward occupational mobility of unskilled workers in hydropower municipalities may be related to increased demand for skills. Goldin and Katz (Reference Goldin and Katz1998) demonstrated a positive relationship between formal skills and worker outcomes in the United States, more or less in the same time period as that covered by our study. In contrast, Norwegian workers had a low level of formal training, though a high level of basic human capital (reading and writing skills). This may explain the relatively rapid adjustment during the decade, if other specific skills could be acquired by means of on-the-job training.
There are several ways in which we can investigate the results further. First, we consider whether there are insufficient controls for underlying municipality differences. The instrument is based on river gradient and water flow, which might be correlated with the general gradient and precipitation in the municipality. These municipality characteristics might affect productivity and upward occupational mobility. In Columns (3) and (4), we control for measures of average gradient and precipitation, effectively identifying changes in hydropower status from river features that are conditioned on general municipality geography. The results are robust to these inclusions.
Because of the cross-sectional structure of the data, we are not able to observe directly whether hydropower-adopting municipalities displayed a positive pre-treatment trend in upward mobility. The best we can do is to test the impact of historical intergenerational mobility on the results. With micro data for the year 1865, we can calculate intergenerational mobility between 1865 and 1900, using the father-son matching procedure. For each municipality, we calculate the average likelihood of upward mobility. This variable is then included in Columns (5) and (6) of Table 6. The estimated coefficients of upward mobility are slightly lower for all specifications, but the overall conclusions are not changed by the inclusion of municipality-level historical mobility trends. All trends are positively and strongly correlated with mobility.Footnote 29
Occupational and Geographic Mobility
The propensity for upward mobility may be different for locals and newcomers, for instance, if locals have established networks that can assist in job search or if movers are a selected group with superior ability that makes them more sought after. This issue has implications for the allocation of treatment. In Columns (7) and (8) of Table 6, we allocate treatment to the 1910 municipality of residence, instead of the 1900 municipality. Rather than belonging to the control group, workers relocating to hydropower municipalities between 1900 and 1910 contribute to the effect. In the OLS specifications in Column (7), the estimated coefficients are higher, in line with the selected mover hypothesis. In Column (8), the IV estimate for unskilled workers is not significantly different from the baseline. However, the corresponding estimate for the father-son sample is relatively higher and significant. The latter result probably reflects both selection and that there are initially few unskilled fathers in the rural municipalities that adopt hydropower technology.
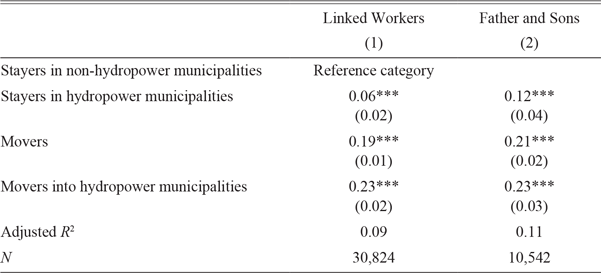
To further study selection, we investigate how the propensity for upward mobility from unskilled status in our two samples is dependent on the geographical mobility and hydropower status of the sender and receiver municipalities. The results are displayed in Table 7. Relative to stayers in non-hydropower municipalities, stayers in hydropower adopting municipalities have 6- and 12-percentage-point higher probabilities of upward mobility in the linked worker and linked father-son samples, respectively. Movers have about a 20-percentage-point higher probability of upward mobility compared to stayers in non-hydropower municipalities, with approximately a doubling of this probability if the person moves into a hydropower municipality instead of a non-hydropower municipality. The evidence suggest that movers are a selected group and/or relatively better matched to the labor market in destination municipalities and that there are better opportunities for advancement in hydropower municipalities.
UPWARD MOBILITY FOR UNSKILLED WORKERS BASED ON GEOGRAPHICAL MOBILITY. INVESTIGATION OF SELECTION EFFECTS

Notes: Data from Norwegian censuses of 1900 and 1910. Column (1) displays upward occupational mobility for unskilled manual workers in the linked worker sample, while Column (2) shows results for unskilled manual workers in the linked father-son sample. Controls are the same as in Column (1) in Table 6. Estimator: OLS. Robust standard errors clustered on municipality are in parentheses. Significance levels: *** p < 0.01, ** p < 0.05, * p < 0.1.
Source: Authors’ calculations from Statistics Norway, IPUMS, ICPSR, and the Norwegian Water Resources and Energy Directorate. See text and Online Appendix A for further details.
The baseline effect can be interpreted as an intention-to-treat effect. Table 7 shows that movers into hydropower municipalities have a high propensity for upward mobility. In our baseline specification, this group does not contribute to the effect, as it is considered non-treated. The inclusion of this group in the regression attenuates the effect by increasing the probability of advancement for the overall group of non-treated. However, omitting this group from the regression seems unattractive, as stayers may also be selected on unobservables. Allocating treatment to the 1900 municipality of residence of the worker shifts movers into hydropower municipalities from the control to the treatment group. The effect of hydropower on occupational mobility also reflects positive selection, as the likelihood of advancement might be considered in the relocation decision. In a Lewis-style model of the economy, this latter effect, with selection included, might come closer to a general equilibrium effect. In that sense, the two approaches can provide upper and lower bounds for the impact of hydropower production on upward mobility.
Regional Heterogeneity, Treatment Intensity, and Timing of Plant Opening
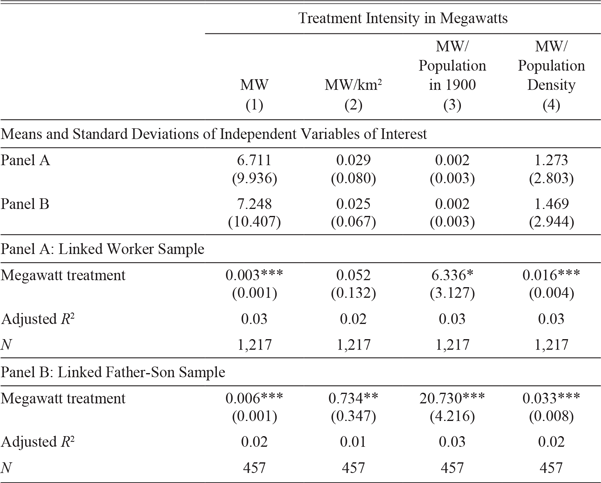
Alternative tests of the estimates’ robustness can be performed by investigating how the effects vary with treatment intensity. Using a publication by Den kgl. Vandfalkommission (1914), we can allocate power production (megawatts) in 1914 to all but 5 hydropower plants. In Table 8, we restrict the sample to municipalities with positive values of produced power. We experiment with different specifications of the variable based on megawatts produced in 1914. This is a strict test as it reduces the sample size considerably, but a positive result would ease our concern that unobserved municipality heterogeneity might affect the result. For the linked worker sample in panel A, the level of megawatts and megawatts relative to municipality size and municipality population density in 1900 yields positive results. Using the result in Column (1) of panel A, we derive that increasing the megawatts produced by one standard deviation increases the probability of upward mobility by 0.03 percentage points. The same conclusions hold when the linked father-son sample is used (panel B), where all specifications are positive and significant at the 5 percent level. The effects are larger in the father-son sample than in the linked worker sample, indicating less adjustment costs across generations than across careers.Footnote 30
UPWARD OCCUPATIONAL MOBILITY FOR THE UNSKILLED GROUPS WITH DIFFERENT TREATMENT INTENSITY

Notes: Data from Norwegian censuses of 1900 and 1910. Panel A displays results for unskilled manual workers in the linked worker sample, while Panel B shows results for unskilled manual workers from the linked father-son sample. The sample is reduced to workers in treated municipalities, and the variables of interest are measures of treatment intensity based on megawatts produced in the municipality. In the regressions, we control for the following characteristics of workers (sons) in 1900: age, age squared, indicator of being married, number of children, and indicator of not being resident in municipality of birth. All regressions include an indicator of coast, area of land, infrastructure variables, and emigration share. Robust standard errors clustered on municipality are in parentheses. Significance levels: *** p < 0.01, ** p < 0.05, * p < 0.1.
Source: Authors’ calculations from Statistics Norway, IPUMS, ICPSR, and the Norwegian Water Resources and Energy Directorate. See text and Online Appendix A for further details.
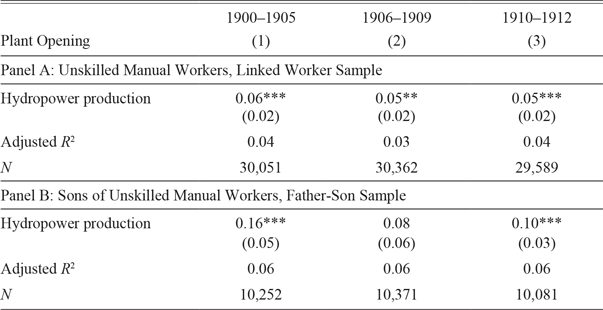
The results presented so far are measured only in 10-year intervals, as there is no comprehensive record of the population between census years. However, using the annual resolution of the hydropower plant data, we can gain some insight into the timing of the changes in the labor market in response to the development of new plants.
The record does not usually provide information on when the construction of hydropower plants started; we only know the first year of operation. If we assume that plants were constructed fairly rapidly, we still cannot observe how the labor markets were affected by signals and expectations of a booming local economy. Therefore, we may underestimate the upward mobility in hydropower municipalities of workers positively affected before occupation was observed in 1900. In addition, workers treated late in the period have shorter exposure time and are, therefore, less likely to conduct occupational changes. Both timing effects provide a downward bias, suggesting that we estimate a lower bound for the effects. We investigate these issues in Table 9.
TIMING OF HYDROPOWER ADOPTION AND THE LIKELIHOOD OF UPWARD MOBILITY

Notes: Data from Norwegian censuses of 1900 and 1910. Panel A displays results for unskilled manual workers in the linked worker sample, while Panel B shows results for sons of unskilled workers in the linked father-son sample. Dependent variables: indicators of upward mobility. Variable of interest: indicator of hydropower production in the years in question. Estimator: OLS. Controls are the same as in Column (1) in Table 6. Robust standard errors clustered on municipality are in parentheses. Significance levels: *** p < 0.01, ** p < 0.05, * p < 0.1.
Source: Authors’ calculations from Statistics Norway, IPUMS, ICPSR, and the Norwegian Water Resources and Energy Directorate. See text and Online Appendix A for further details.
In Columns (1) and (2), we allocate treatment on the basis of opening years of the plants and exclude observations that are in municipalities that receive treatment earlier or later in the 1900–1909 period. The variable of interest is then an indicator that is equal to unity if plants were opened in a given period. As there are few treated municipalities, we conduct the analyses with simple OLS and not IV estimation. Although all specifications provide positive coefficients, the occupation groups show a higher effect from treatment in the early period (1900–1905) than in the later period. The result for the father-son sample in the later period is not significantly different from zero. In Column (3), the variable of interest is given as treatment in the years immediately after 1909. Here, too, we see a positive coefficient, suggesting that the construction of hydropower plants or signals of improving economic conditions lead to changes in local labor markets.
Did Upward Occupational Mobility Cause a Hollowing Out of the Skill Distribution?
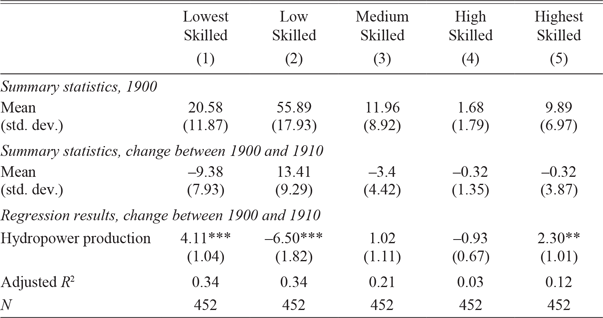
So far, we have established that upward occupational mobility improved substantially for workers in manual unskilled occupations when hydroelectricity was established. This is in line with the results of Goldin and Katz (Reference Goldin and Katz1998) using U.S. data for the early twentieth century, showing that technology has a skill bias. Recent works have found that technological change may contribute to a hollowing out of the occupation distribution (Gray Reference Gray2013; Katz and Margo Reference Katz, Margo, Boustan, Frydman and Margo2014). We investigate whether this is also the case for Norway in the early twentieth century. We go beyond the two-way grouping of manual occupations used in the previous section and rather apply the Duncan Socioeconomic Index (SEI) to the individual occupation codes to obtain a status rank for each individual.Footnote 31 Based on these values, we split the sample of workers into five status classes, which are further described in Online Appendix Section A.5.
We start by examining the overall changes in the occupational distribution for rural Norway as a whole. The distribution of the workforce across five skill categories in 1900 is given in the first row of Table 10, while the second row describes the change from 1900 to 1910. In the aggregate, there is no hollowing out; over time, there is an increase in the share of individuals in the second-lowest skill category and a decrease in the lowest category.Footnote 32
HYDROPOWER ADOPTION AND CHANGE IN WORKER OCCUPATION SHARES

Notes: Data from Norwegian censuses of 1900 and 1910 are used to create a linked sample of workers belonging to detailed occupational categories. The five occupation classes are derived using the SEIUS measure. The measure ranks occupations using U.S. data on income and education from 1950. The classes have the following cutoffs: 9, 15, 20, and 25. Means and standard deviations for occupation shares in 1900 and change in occupation shares between 1900 and 1910 are provided in the top two panels. The lower panel shows regressions results where the variable of interest is obtaining hydropower status between 1900 and 1910. Municipalities that received this status earlier are omitted. Estimator: OLS. Dependent variables: change in detailed occupation shares between 1900 and 1910, in percent. In the regressions, we include an indicator of coast, area of land, share of emigrants in the decade preceding 1900, historical infrastructure variables, and county FE. Robust standard errors are in parentheses. Significance levels: *** p < 0.01, ** p < 0.05, * p < 0.1.
Source: Authors’ calculations from Statistics Norway, IPUMS, ICPSR, and the Norwegian Water Resources and Energy Directorate. See text and Online Appendix A for further details.
Of more interest, however, is a comparison of the municipalities that obtain hydroelectric plants between 1900 and 1910 and those that do not, using the specification in Equation (3). The coefficient on hydroelectricity is shown in Table 10. In this comparison, there is evidence of “relative” hollowing out, in that the lowest- and highest-skilled groups increase more in size when hydroelectric plants are established. The other groups have negative or small growth in employment shares, and the difference is statistically significant. If we instead restrict our analysis to only manual occupations (shown in the Online Appendix), the pattern is less clear with a statistically significant increase also in the medium-skilled category (with negative coefficients for the second and fourth categories).
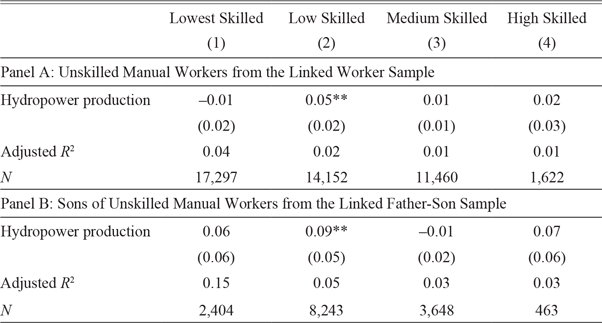
We also investigate how the mobility responses to the new technology differ across the skill distribution, as measured by the share of individuals with manual occupations in each category that move to a higher-ranked occupation. As can be seen from Panel A in Table 11, there is little systematic variation in upward mobility across skill groups. There is a positive and significant upward mobility coefficient for those in the second lowest skill category in both samples. However, for the linked sample, the coefficient is not significantly larger than that for the lowest-skilled group. Moreover, the results are somewhat sensitive to the regression specification and choice of control variables. For this reason, we cannot conclude that the introduction of this new technology in the early twentieth century was associated with any hollowing out of the skill distribution.
HYDROPOWER ADOPTION AND THE LIKELIHOOD OF UPWARD MOBILITY FOR MANUAL WORKERS IN DIFFERENT SKILL CLASSES

Notes: Data from Norwegian censuses of 1900 and 1910. Panel A displays results from the linked worker sample, while Panel B shows results from the linked father-son sample. Dependent variables: upward mobility indicators for manual workers in four different skill classes. The skill classes are derived using the SEIUS measure. The measure ranks occupations using U.S. data on income and education from 1950. The classes are based on the following cutoffs: 9, 15, 20, and 25. Controls are the same as in Column (1) in Table 6. Robust standard errors clustered on municipality are in parentheses. Significance levels: *** p < 0.01, ** p < 0.05, * p < 0.1.
Source: Authors’ calculations from Statistics Norway, IPUMS, ICPSR, and the Norwegian Water Resources and Energy Directorate. See text and Online Appendix A for further details.
The conclusions are similar when a different occupational status measure based more directly on (U.S.) wages, OCSCORUS, is used. Online Appendix Table D.12 replicates Table 11 for this measure and shows statistically significant coefficients of hydropower establishment for the “low” and “medium” skill categories, as well as for the lowest skilled in the linked sample. To conclude, while there are some indications of asymmetric differences across the skill distribution in response to new technology, we do not find any decisive evidence that some groups are systematically left behind.
CONCLUDING REMARKS
As technological change often takes place gradually, it is difficult to identify and quantify how technology change affects local economic conditions and workers of different backgrounds and skills. These questions are of great importance for understanding both the historical and the modern setting, and for forming realistic expectations of the future. This paper contributes by providing new evidence on the impact of the adoption of hydropower technology on local outcomes in Norway in the period 1891–1920. Few studies investigate the impact of the shift to hydropower outside the setting of the core industrializing countries, and there is little evidence on such an early period. Norway is a suitable setting for such a quasi-experiment, as the country had undergone limited industrialization, the hydropower technology breakthrough was abrupt, and only some municipalities had natural features that lent themselves to the introduction of the technology.
The relationship between industrialization and the implementation of hydropower technology in Norway has previously been described only using national-level data. With our regional perspective, we find that the industrialization process was not distributed equally across the country. Hydropower municipalities experienced structural transformation; the manufacturing sector grew at the expense of the primary sector. Manufacturing employment growth is in line with what is found in the related literature (Kline and Moretti Reference Kline and Moretti2014), whereas the same strand of literature tends to find positive employment results for the primary sector. A possible explanation is that expansion in this sector was demanding, employment in the agricultural sector in rural areas was already high, and land may have been scarce (something the emigration in this period testifies to) and made scarcer by competing sectors. The Norwegian experience suggests that the new energy technology shifted local labor markets to industrial sectors.
The findings indicate that the adoption of hydropower technology and the concomitant industrialization process had an equalizing social gradient, as they caused upward mobility of workers and families at the low end of the skill distribution. Specifically, manual unskilled workers experienced upward occupational mobility and sons of unskilled workers experienced upward intergenerational mobility.
The results place industrial development in early twentieth-century Norway firmly in the skill-bias category, similar to the more industrially developed United States in the same period, rather than in the unskill-biased framework of nineteenth-century Great Britain. Acemoglu (Reference Acemoglu2002) argues that the difference between the two can be partly explained by the general skill level in the population, with British cities having a large reserve of unskilled workers. In 1900, there was not yet a large manufacturing sector in Norway and the Norwegian labor force had a high share of farmers and unskilled laborers, making it superficially similar to other countries earlier in the industrialization process. However, there was a comprehensive elementary-school system and likely a high level of latent human capital in the population (Sandberg Reference Sandberg1979).
One possible interpretation of these observations is that the changing occupational distributions reflect a reallocation of a population with basic skills from unskilled to skilled occupations. While we do not know the details of this reallocation, there are several possible channels that could be investigated with other sources of data, such as how important literacy was, the role of formal training, and to what extent workers were trained on the job. The specific case of hydroelectricity and industrialization may not be directly applicable to present-day industrializing countries, as long-run transmission of electricity through high-voltage lines is now routine. The results do, however, paint a clear picture of industrialization at the turn of the twentieth century as skill biased and with substantial positive effects, increasing social mobility.