The idea that economic conditions influence election outcomes and voting behavior is hardly novel and would appear to be close to uniformly accepted, especially in the case of American presidential elections. Beginning with the early aggregate studies (Arcelus and Meltzer Reference Arcelus and Meltzer1975; Bloom and Price Reference Bloom and Price1975; Kramer Reference Kramer1971; Tufte Reference Tufte1978) and the important individual-level work that followed soon thereafter (Kiewiet Reference Kiewiet1983; Kinder and Kiewiet Reference Kinder and Kiewiet1979, Reference Kinder and Kiewiet1981; Fiorina Reference Fiorina1981), election scholars have devoted considerable attention to the influence of the economy on voting behavior and election outcomes. Although the findings are many and sometimes disparate, a few general conclusions have emerged: economic voting is incumbency oriented rather than policy oriented (Fiorina Reference Fiorina1981; Kiewiet Reference Kiewiet1983); at the individual level, evaluations of the national economy are more closely tied to vote choice than are evaluations of personal finances (Kiewiet Reference Kiewiet1983; Kinder and Kiewiet Reference Kinder and Kiewiet1979, Reference Kinder and Kiewiet1981; Kinder, Adams, and Gronke Reference Kinder, Adams and Gronke1989); and, with the exception of 2000, the incumbent party is habitually returned to office when economic times are good and tossed out when economic times are bad (Campbell and Garand Reference Campbell and Garand2000).Footnote 1 In short, we know a lot about how the economy influences voters and elections, and it would seem that there are few issues left to resolve.
FACTORS AFFECTING THE LEVEL OF ECONOMIC VOTING
The 2008 election represents an interesting case study for a number of potentially countervailing reasons: the prevailing dire economic conditions, an open-seat contest with no representation from the incumbent administration, and the historic nature of the election, featuring the first-ever African American major-party nominee. Within the theoretical framework of priming, all of these factors could have played a role in shaping the importance of economic evaluations on vote choice. The theoretical underpinnings of the priming effects are quite straightforward. People typically pay little attention to such things as politics and economics and, as a result, rely on information shortcuts for decision making (Popkin Reference Popkin1994; Delli-Carpini and Keeter Reference Delli-Carpini and Keeter1997). One important shortcut is accessibility, or to utilize that information that is most readily available (Zaller Reference Zaller1992; Zaller and Feldman Reference Zaller and Feldman1992). The media, by providing more coverage of some issues than others, make those issues more accessible and, as a consequence, voters will rely on them more heavily as a basis for evaluating the president (Iyengar and Kinder Reference Iyengar and Kinder1987, 63–65; Valentino, Hutchings, and White Reference Valentino, Hutchings and White2002). Alternatively, it may be that increased media attention acts as a priming agent not by increasing the accessibility but by elevating the salience, or perceived importance of the information, which leads voters to assign relatively greater weight to that information when making decisions (Miller and Krosnick Reference Miller and Krosnick1998; Nelson, Clawson, and Oxley Reference Nelson, Clawson and Oxley1997). The key point is that voters are susceptible to influence due to their relative lack of information, and they will give more or less weight to issues to the extent that the information context of the election encourages them do so.
Economic News
As might be expected, negative economic news turns voters away from the incumbent party, and positive economic news generally leads people to support the incumbent party (Holbrook Reference Holbrook2001; Nadeau et al. Reference Nadeau, Niemi, Fan and Amato1999; Shah et al. Reference Shah, Watts, Domke, Fan and Fibison1999). Of course, it is also plausible from the priming perspective that more economic news encourages economic voting and less economic news discourages it. This idea finds some support in the existing literature on presidential approval (Edwards, Mitchell, and Welch Reference Edwards, Mitchell and Welch1995) and voting behavior (Hetherington Reference Hetherington1996), which has shown that increased media attention to economic issues heightens the importance of those issues as determinants of presidential approval and vote choice. Given the sour economic context of the 2008 elections, and especially given the financial meltdown and subsequent policy discussions in the fall campaign, it is reasonable to assume that the economy was a paramount consideration for voters in 2008 and that it should have played a more prominent role than in other recent elections.
Alternative Arguments: Incumbency and Race
One potentially complicating factor is incumbency, which can also be thought of as an important source of priming for economic evaluations. Relatively recent research suggests that the task of economic accountability may be most difficult in open-seat presidential elections, when the president does not stand to reap reward or punishment for existing conditions (Campbell Reference Campbell2008; Holbrook Reference Holbrook2008; Nadeau and Lewis-Beck Reference Nadeau and Lewis-Beck2001; but see Abramowitz Reference Abramowitz2008). Nadeau and Lewis-Beck argue that the presence of an incumbent candidate makes economic voting easier: “[a] president running for reelection is the economic manager personified. Voters can look at his or her economic record in office and cast a ballot accordingly. In contrast, a party running for reelection is more abstract, especially when considered as an economic manager” (Reference Nadeau and Lewis-Beck2001, 169). This highlights an important means by which incumbency might prime voters to assign more weight to economic consideration—by making it easier to frame the election as a referendum on the incumbent president's performance. Given that the 2008 election represented the first time since 1952 that the incumbent party was not represented by either the president or vice president, the incumbency frame should have been harder to sell and retrospective voting may have played a weaker role than if the president himself had been on the ticket.
Finally, it is also possible that the historical nature of the 2008 contest could have influenced the level of economic voting. Given that racial attitudes can play a significant role in elections featuring two white candidates (Kinder and Sanders Reference Kinder and Sanders1996), it is reasonable to assume that they took on more importance in the 2008 election, in which the Democratic nominee, Barack Obama, was African American, and the Republican candidate, John McCain, was white. To the extent that voters place greater emphasis on racial considerations, doing so may have crowded out economic considerations.
So we have alternative, countervailing, and highly plausible expectations for the impact of economic evaluations in the 2008 presidential election. On one hand, since economic conditions were so dire, and news about the economy seemed to dominate (data to follow) during the fall campaign, economic considerations should have played a prominent role in vote choice; on the other hand, given the open nature of the 2008 election, coupled with heightened attention to racial considerations, economic evaluations might have mattered less than might be expected. Lamentably, it is probably not possible to provide a definitive answer on which of these perspectives is correct, or even which one provides the most accurate portrayal of the 2008 vote. Instead, I focus the analysis on documenting the unique economic environment in 2008 and providing a comparison of the role of economic evaluations in 2008 in contrast to the role they played in other recent elections.
DATA ANALYSIS
It is difficult to imagine a more challenging economic environment for the incumbent party than 2008. Public perceptions of the economy were negative going into the election year, and the volume of economic news grew more and more dominant as the campaign unfolded. The first point of comparison is the distribution of economic evaluations in other election years. The data in Table 1 show the distribution of retrospective evaluations in the fall of every presidential election from 1980 to 2004 (see Figure 1).Footnote 2 These data show the relative frequencies from the classic retrospective question, “Would you say that over the past year the nation's economy has gotten better, stayed about the same or gotten worse?” Response categories range from 1 (much better) to 5 (much worse). These data show what John McCain was up against as the representative of the incumbent presidential party: the distribution in economic evaluations in 2008 was so skewed toward negative reactions that there was really very little variation in the electorate to speak of. Economic attitudes in the other years were sometimes negative (1980, 1992), but nothing comes close to the context of the 2008 election. The near uniform agreement about the state of the economy in 2008 was truly unprecedented.
A Logit Model of Vote for the Incumbent Party Candidate in (Mostly) Two-Party Presidential Elections, 1984–2008

1 In 2000 the ANES used a split sample for ideology and asked the seven-point item for just half the sample. Excluding these observations led to a very small sample for the model, so I imputed values of ideology for the remaining sample based on multiple demographic and political items that one might expect to be strongly related to ideology. The impute routine from STATA10.0 was used for the imputation.
Retrospective Economic Evaluations in Presidential Election Years, 1980–2008
Note: data taken from ANES cumulative data file and the ANES 2008–2009 panel study

The negativity of economic attitudes presumably was compounded and perhaps fed by the volume of economic news. A cursory examination of news coverage of the economy in 2000, 2004, and 2008 verifies what should be obvious to everyone who experienced the 2008 campaign. Using front page New York Times stories as the barometer (Figure 2), it is clear that there was much more coverage of economic affairs during the 2008 campaign than any of the previous two-year election cycles. The differences are truly staggering: in 2008 there were more than four times as many articles than in 2000 and more than 10 times as many than in 2004. Clearly, the economy took on more salience in 2008 than is typically the case and economic information was abundant and available for consumption.
Number of Front Page NYT Stories about the Economy, August 1 to Election Day, 2001–2008

Although there was much more coverage of the economy in 2008, the level of coverage was by no means constant throughout the campaign. Popular discussions tend to focus on the collapse of Lehman Brothers, which filed for bankruptcy on September 15, as the critical point at which the media shifted attention and the economy became more salient. The data in Figure 3 take a closer look at New York Times coverage of the economy, displaying the five-day moving average of the number of front-page stories from August 1 through Election Day. Several things are apparent from this figure. First, the level of coverage varied a great deal from August through Election Day. Second, while coverage did spike after Lehman's collapse, it had started to increase in the week or so prior to this, with increasingly dire news about the credit crisis, the rescue of Fannie Mae and Freddy Mac, and warning signs from Lehman Brothers. Third, the emphasis on economic news waned a bit as October progressed, only to pick up during the last few days of the campaign.
New York Times Coverage of the Economy during the 2008 Presidential Campaign

The ANES 2008–2009 panel data allow us to compare the mean daily economic evaluation during June and October (Figure 4) to get a sense of how economic attitudes might have changed during these time periods. The first thing to note is that economic evaluations were very negative in both months (high values indicate negative evaluations), though they were somewhat more negative in October (mean = 4.7) than in June (mean = 4.4), indicating that events of the fall did little to move economic sentiment. Second, there is no appreciable movement in evaluations during either June or October, also indicative of an electorate that had made up its mind about the economy.
Economic Evaluations in June and October, 2008 (Daily Means)

The Economic Vote
Given the level of media coverage, as well as the overall level of discontent in 2008, it seems a foregone conclusion that the economic vote was an important contributor to Obama's victory. However, due to the open nature of the election, as well as the possibility that race and racial issues took on new importance, the economic vote might not have mattered as much as one would expect. The best way to get a sense of how much the economy mattered is to go beyond an analysis of the 2008 election and contrast voting in 2008 to voting behavior in other comparable elections. Toward that end, Table 1 presents a simple vote model tested for the most comparable set of elections from 1984 to 2008, those in which the choice was essentially between the two major-party candidates. Data are also available for the 1980, 1992, and 1996 elections but these elections are excluded because they occurred in years in which there were substantial third-party votes, making them a bit more difficult to compare to the 2008 election.
The model in Table 1 is not meant to be an exhaustive depiction of the vote, but does provide a core set of variables that are typically thought to structure vote choice. The model includes two economic indicators: the standard five-point retrospective question and a three-point prospective question that asks (with slight variation in some years), “Do you expect the economy, in the country as a whole, to get worse, stay about the same, or get better?” As is evident from the slopes and associated standard errors, retrospective evaluations have a much stronger impact on vote than do prospective evaluations. In fact, prospective evaluations have a significant effect only in 1984; whereas retrospective evaluations are significant in every election year, though just barely in 2000.
To get a relative sense of how the vote was influenced by economic evaluations in 2008, Figure 5 plots the predicted probability of voting for the incumbent candidate as a function of retrospective economic evaluations, with all other variables held constant at their mean values. Here we see evidence of a fairly strong relationship, as the slope for 2008 is steep and shows a decline in support for McCain from .87 among those who said the economy was doing much better to .41 among those who said the economy was doing much worse. This relationship is nearly identical to the pattern for 1984, when views of the economy were much different and favored the incumbent party. A couple of other things are worth noting from this figure. First, economic evaluations were a decidedly stronger influence on vote choice in 2004 than in any other year. Although 2004 is not often described as the “year of the economy,” it was a year in which an incumbent with middling approval was running, which may have made it a more generally retrospective election. It is also clear that economic evaluations mattered much less in 1988 and 2000 than in other years, and the relationship is particularly weak for 2000. The slope for 2000 confirms that Al Gore had a difficult time (perhaps for lack of effort) translating a relatively positive economic environment into votes.
Retrospective Economic Evaluations and Vote for the Incumbent Party Candidate in (Mostly) Two-Party Presidential Elections, 1984–2008

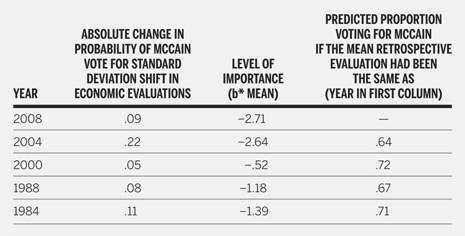
While the slope for 2008 has the appearance of a strong relationship, it is also a somewhat deceptive representation. The problem is that there are so few observations in the first three categories of the independent variable (just 6%) that the relationship can hardly be thought of as showing how variation in economic attitudes influences the probability. Simply put, there isn't much variation. To get a fairer sense of the relative impact of economic evaluations across years, it is probably better to take into account the variance in the key independent variable. Table 2 does this by showing the absolute change in the probability of an incumbent party vote for a change in economic evaluations from −.5 to +.5 standard deviations around its mean value (a shift of one standard deviation). Here we see the elasticity of economic evaluations is roughly the same in 2008 as it was in 1988 and just a bit weaker than it was in 1984. Once again, 2004 emerges as the year with the strongest effects and 2000 shows very little evidence of economic voting. In short, the impact on individual votes in 2008 was significant but not remarkable in comparison to other years.
Measures of the Individual and Aggregate-Level Effects of Economic Evaluations

However, given the skewed and pessimistic distribution of economic attitudes in 2008, even a modest individual-level relationship could produce a substantial aggregate-level effect on the vote. One way to get a sense of this is to calculate something akin to the “level of importance” indicator that Achen (Reference Achen1982) recommends for ordinary least squares regression. By multiplying the slope for economic evaluations times the mean evaluation we get a measure of how much this variable contributed to the aggregate outcome (the cumulative logit in this case). The greater the absolute magnitude of this measure, the more important it was in determining the aggregate outcome. The second column in Table 2 presents the level-of-importance statistics for all elections analyzed in Table 1. As is apparent, despite their unremarkable individual-level effects, economic evaluations had a higher level of importance in 2008 than in any other year. Another way of appreciating the important aggregate consequences of economic evaluations in 2008 is to simulate how the election might have turned out if the average economic evaluations from the other years were substituted for those that actually occurred in 2008. The results of this simulation are presented in the third column of Table 2 and in every case the predicted outcome is a decisive McCain victory. Many of these predicted outcomes are implausible, as they suggest landslides of magnitudes heretofore not experienced. However, setting the precise magnitude aside, what the findings do indicate is that, given the relationship between evaluations and vote in 2008, substituting mean evaluations from any of the other years (all of which were more positive than 2008) would likely have led to a McCain victory.
At the beginning of this article, I discussed the competing contextual influences of an environment that was saturated with economic news and one in which the standard incumbency cues were presumably weaker while racial cues were stronger. Unfortunately, this analysis cannot speak directly to which of these factors had the greatest role in shaping the influence of economic evaluations in 2008. No doubt they all played some role. However, I close by arguing that, given the distribution of economic evaluations, it is surprising that the individual-level relationship is as a strong as it is. As shown earlier in Figure 1, the overwhelming majority of respondents are clustered in the response categories “somewhat worse” and “much worse,” with a full 78% choosing the latter. What this suggests is that dissatisfaction with the economy was not just the majority position, but the nearly uniform position, even among those who might normally be supporters of the Republican ticket. This assumption finds support in Figure 6, which displays the distribution of economic evaluations by party identification. As expected, negative evaluations dominate in all partisan groups. Even among Republicans, the modal response was “much worse” and virtually all other responses were “somewhat worse.”
The Distribution of Economic Evaluations across Partisan Groups, 2008
Note: data taken from the October wave of the ANES 2008–2009 panel study

While political independents and Democrats might gladly have translated their discontent into a vote for Obama, Republicans could have been expected to resist. In other words, in 2008 more than in other years, a substantial share of those expressing economic discontent had strong party-based reasons to ignore that discontent when casting their votes. The lack of variation in economic evaluations probably explains the why they didn't matter more as an explanation for individual-level voting, while the negative consensus of the distribution of those evaluations explains why they mattered so much to the aggregate outcome.