Introduction
During the last 50 years, the Belgian Blue breed has evolved from a dual-purpose breed to a beef type with exceptional muscularity (Hanset, Reference Hanset1982), as a result of selection for the myostatin gene in double-muscled animals (Grobet et al., Reference Grobet, Poncelet, Royo, Brouwers, Pirottin, Michaux, Ménissier, Zanotti, Dunner and Georges1998). There are practically no data dealing with milk production of Belgian Blue double-muscled (BBDM) beef cows. In general, muscular hypertrophy may reduce milk production by about 15% to 30% (Ménissier, Reference Ménissier1982). However, this decreased milk production is more than compensated by the improved value of BBDM animals (>€750 for a newborn calf). Furthermore, calves are often artificially reared to reduce the calving interval of the BBDM cow, which is generally longer than in non-double-muscled cows (Fiems et al., Reference Fiems, Boucque and De Campeneere1997). This longer calving interval may be a consequence of a suckling-induced anoestrus (Williams, Reference Williams1990; Wettemann et al., Reference Wettemann, Lents, Ciccioli, White and Rubio2003) but the interval may also be lengthened because of caesarotomy in BBDM cows (Vandeplassche and Bouters, Reference Vandeplassche and Bouters1982).
Freetly and Cundiff (Reference Freetly and Cundiff1998) reported a higher milk production in first-calf-crossbred heifers of Belgian Blue sires in comparison with Angus, Hereford and Piedmontese sires. Yield of Belgian Blue offspring averaged 8.1 and 5.7 kg/day in early (50 to 100 days) and late (150 to 200 days) lactation, respectively. Several authors emphasised the importance of milk production, as it is significantly correlated with pre-weaning calf gain (Miller et al., Reference Miller, Wilton and Pfeiffer1999) or weaning weight (Freking and Marshall, Reference Freking and Marshall1992). However, this relationship may vary considerably. Robison et al. (Reference Robison, Yusuff and Dillard1978) reported a correlation between weaning weight and total milk yield of 0.63. Lower correlations were given by Marston et al. (Reference Marston, Simms, Schalles, Zoellner, Martin and Fink1992), ranging from 0.30 in Angus cows to 0.47 in Simmental cows.
This report deals with factors such as energy level in winter (70% to 100% of the requirements) and cow parity on milk production of BBDM cows. The effect of milk intake on pre-weaning calf performance and the relationship between the milk energy intake and the total dietary energy intake are also investigated. In this study, calf milk intake was identified with cow milk production, although Le Neindre (Reference Le Neindre1974) and McMorris and Wilton (Reference McMorris and Wilton1986) reported that the calf may not make use of all the available milk at high levels of milk yield.
Material and methods
Animals and housing
During a 5-year period, milk production was investigated using 64 BBDM cows over 127 lactations and 511 individual milk intake (IMI; kg/day) measurements. Cow parity ranged between 1 and 6, and averaged 2.3 ± 1.2. Cows were suckled by their calves, which were abruptly weaned at 16 weeks of age. Births of surviving calves amounted to 7, 15, 19, 12, 13, 12, 10, 4, 10, 8, 4 and 6 in the respective months of the year. Half of the calves were born during the indoor period, with 3 June as the mean calving date. Calving date was postponed from year to year because the mean calving interval averaged 428 ± 47 days. Because of a prolonged calving interval, cows were bred the year round, using mating bulls. During the indoor period cows and calves were housed in tie stalls. They were turned out to pasture from end of April where they remained until November. Rotational grazing on perennial ryegrass swards was applied. Annual nitrogen dressing averaged 400 kg/ha.
Diets
Cows were divided into four comparable groups at the start of the experiment, based on initial age, body weight and body condition. During a 140-day indoor period, starting on the first Thursday of December, they were fed 100%, 90%, 80% or 70%, respectively, of their total energy requirements (maintenance and a supplement for lactation, gestation or growth, if necessary). Feeding levels were based on the requirements for dairy cattle as described by Van Es (Reference Van Es1978). Once the cows were allotted to one of the experimental groups, they were always fed the same energy level during the subsequent indoor periods. The diet consisted of maize silage and straw (80 : 20 on a dry matter basis), supplemented with soya-bean meal and urea to fulfil protein requirements, and 0.5 kg/day of a mineral–vitamin pre-mix. Afterwards (re-alimentation period), all cows grazed in identical circumstances. During the milk-production measurement in summer, cows were offered 0.5 kg daily of a mineral–vitamin pre-mix, maize silage ad libitum and a limited amount of urea to prevent a negative protein balance in the rumen. Calves were individually offered concentrate and grass hay during the winter period and during the measurement of milk intake in summertime. The same concentrate was available during the summer period, but individual concentrate intake was not recorded. Calf concentrate and hay were chemically analysed and net energy was calculated. A net energy value of 1.84 MJ/kg was assumed for cow milk.
Measurements
IMI was measured every 4 weeks by the weighing–suckling–weighing technique, as described by Beal et al. (Reference Beal, Notter and Akers1990). Chemical composition of the milk was not determined. Average milk intake (AMI; kg/day) was calculated as the mean of the four IMIs of each calf (n = 120). During the grazing period, cows and calves were confined in tie stalls for 2 days to measure milk intake. The first day was used as an adaptation to the accommodation, while measurements took place on the second day. Body condition scoring (BCS) of dams, as described by Agabriel et al. (Reference Agabriel, Giraud and Petit1986), and weighing of cows and calves occurred at 4-week intervals.
Statistical analyses
The effects of dietary energy level of the dams and animal factors on milk production and calf performance were investigated, using an analysis of variance. Values were given as least-square means. Regression analysis, using Statistical Packages for the Social Sciences (2002), was applied to predict milk intake and to study the substitution of milk by solid feed. Dummy variables were used for month, dam parity and calf sex.
Results
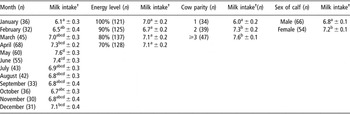
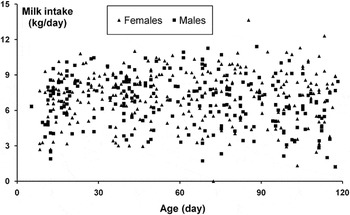
Mean calving date was not different between diets, parities and sexes. IMI averaged 7.0 ± 2.2 kg daily. As there were no interactions, only main effects are shown (Table 1). Month exerted a significant effect on IMI (P = 0.040), with a maximum IMI of 7.6 kg/day in May and a minimum of 6.1 kg in January. Energy level during the indoor period did not affect IMI (P = 0.579). If the data from the last 2 months of the restriction period (March–April), where the effect of the energy restriction might be maximal, were considered, there was no effect of energy level on milk intake. IMI increased with increasing cow parity (P < 0.001). Female calves showed a tendency to consume more milk than male calves (P = 0.044), using month, energy level and cow parity as covariates. A regression equation based on time of the year (January, March, April, May, June and December, using dummy variable = 1 for the respective month and 0 for other months), parity (P: dummy variable = 1 for primiparous cows and 0 for multiparous cows), post partum dam weight (DWp), dam BCS, calf age (day), calf weight (CW; kg), calf birth weight (CWb) and calf sex (M: dummy variable = 1 for males and 0 for females) only explained 0.20 of the variation: IMI (kg/day) = 1.052 – 0.632 January + 0.371 March + 0.664 April + 0.769 May + 0.533 June + 0.499 December + 0.007 DWp + 0.012 CW + 0.016 CWb − 0.678 P − 0.397 M; R 2 = 0.202; P < 0.001; r.s.d. 1.92. Dam age, dam weight and calf age were excluded from the model for reason of collinearity. No clear lactation curve with a peak yield was observed (Figure 1).
Factors affecting individual milk intake (n = 511; kg/day ± s.e.)

a,b,c,dValues in the same column having the same superscripts are not different (P > 0.05).
†Calculated using energy level, cow parity and sex of calf as covariates for month; using month, cow parity and sex of calf as covariates for energy level, using month, energy level and sex of calf as covariates for cow parity and using month, energy level and cow parity as covariates for sex of calf.
Milk intake from birth to weaning at 16 weeks.

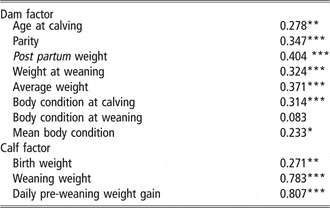
Effects of energy level and parity on AMI (figures not shown) were similar with those on IMI. AMI amounted to 7.1 ± 1.7 kg/day. Differences between males and females were not significant. AMI was not different between cows with two parturitions or three and more and averaged 7.4 ± 1.6 kg/day, being higher (P = 0.001) than in primiparous cows (6.2 ± 1.7 kg). There were 16 cows which were suckled during three subsequent lactation periods. AMI was not affected by lactation period and energy restriction level and there was no interaction when dam age at calving, calf sex and month of birth were used as covariates. Daily milk production, calculated without covariates, averaged 6.4, 7.5 and 7.6 kg, respectively, for the subsequent lactation periods. Yields in the first period were lower than in the subsequent periods (P = 0.048). Using month of calving, energy level and calf sex as covariates did not modify the results. Differences were no more significant (P = 0.271) when age of dam at calving was introduced as a supplementary covariate. Milk production during the second and the third lactation periods was poorly correlated with the milk yield during the first lactation period (r = 0.273; P = 0.306 and −0.311; P = 0,241, respectively). Milk production during the third lactation period was negatively correlated with the milk production during the second lactation period (r = −0.584; P = 0.018). Dam and calf characteristics affecting calf AMI are given in Table 2. Dam factors were only weakly correlated with AMI. Calf weaning weight (CWw) and pre-weaning weight gain were better correlated with AMI (r > 0.75). DWp was best related to AMI (r = 0.404), explaining 16% of the variation in milk yield. However, if only primiparous cows were used (n = 34), a linear relationship could explain 0.33 of the variation in AMI: AMI = −1.519 + 0.014 DWp (R 2 = 0.335; P < 0.001; r.s.d. 1.0).
Correlation coefficients (r) between average daily milk intake and dam and calf factors

*P = 0.05; **P = 0.01; ***P = 0.001.
A regression equation based on CWb, month of birth (February, March, April, June and July, using dummy variable=1 for the respective month and 0 for other months), calf sex (M: dummy variable = 1 for males and 0 for females), DWp, and dam BCS at parturition (BCSp) and parity (P: dummy variable = 1 for cows with three or more parturitions and 0 for other cows) could explain 0.36 of the variation in AMI: AMI (kg/day) = −0.593 + 0.060 CWb – 0.514 M + 0.893 February + 1.512 March + 1.378 April – 0.591 June + 0.742 July + 0.005 DWp + 0.535 BCSp + 0.533 P; R 2 = 0.362; P < 0.001; r.s.d. 1.5.
Dividing cows into classes according to BCSp (BCSp ⩽ 1.5 (n = 62); 1.5 < BCSp ⩽ 2 (n = 41); BCSp > 2 (n = 17)), using dam parity and calf gender as covariates, AMI amounted to 6.7, 7.5 and 7.3 kg/day, respectively. The difference between the first two classes was significant (P = 0.017). BCSp averaged 1.23, 1.74 and 2.42 and was different between classes (P < 0.001).
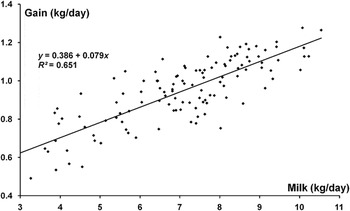
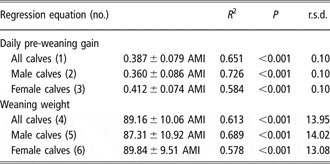
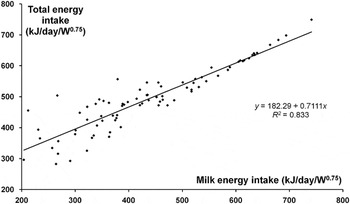
The fact that AMI was better correlated to CWw (r = 0.783) than to CWb (r = 0.271) may suggest that calf performance is largely dependent on milk intake. Indeed, a linear relationship (r = 0.807) between AMI and daily live-weight gain was found (Figure 2), with a slightly better relationship for male (r = 0.852) than for female calves (r = 0.764). The relationship between pre-weaning gain and AMI is presented in Table 3. These results show that 7.44 and 7.94 kg/day AMI correspond to a daily gain of 1 kg, respectively, for male and female calves (equations (2) and (3)). An additional kg weaning live weight can be realised when AMI is increased by 0.092 and 0.105 kg/day, respectively, for male and female calves (equations (5) and (6)). The fact that this gain was largely dependent on milk intake suggests that solid feed intake was of minor importance. Indeed, the total daily net energy intake per kg W0.75 (Y; kJ), registered during the indoor period, was closely related to the daily net energy intake per kg W0.75 from milk (X; kJ): Y = 182.28 + 0.71X; R 2 = 0.833; P < 0.001 (Figure 3). This means that energy from milk was only substituted for 29% by energy from concentrate and hay.
Relationship between daily milk intake and pre-weaning live-weight gain in suckling Belgian Blue double-muscled calves.

Relationship between average daily milk intake (AMI) and calf performance from birth to weaning (kg)

Relationship between total energy intake and milk energy intake in suckling Belgian Blue double-muscled calves.

Daily live-weight gain of the calves was not affected by the dietary energy level of their dams and varied between 0.94 and 0.96 kg (P > 0.05). Male and female calves gained 0.94 and 0.96 kg/day, respectively (P > 0.05). The largest difference was found between the offspring of primiparous cows (0.90 kg) and calves born out of dams with three or more parturitions (0.98 kg), although the effect was not significant (P = 0.195).
Discussion
There are only limited milk yield data available for BBDM cows. Milk production in the present study is fairly good, at least for a breed with excellent carcass meatiness such as the Belgian Blue, and taking into account that muscular hypertrophy may reduce milk production by about 15% to 30% (Ménissier, Reference Ménissier1982). The milk yields recorded in the present study are higher than the 4.3 kg that could be calculated for the initial 4 months from the data of Melton et al. (Reference Melton, Riggs, Nelson and Cartwright1967). The milk yields are also higher than reported for Hereford cows (Corah et al., Reference Corah, Dunn and Kaltenbach1975) or Hereford, Simmental and crossbred cows (McMorris and Wilton, Reference McMorris and Wilton1986; Shell et al., Reference Shell, Early, Carpenter and Buckley1995). A comparable yield is reported for Charolais cows (6.6 to 7.6 kg/day; Drennan and Fallon, 1998) and for daughters of Angus cows randomly mated to Hereford, Red Poll or Milking Shorthorn (approximately 7.0 kg/day; Clutter and Nielsen, Reference Clutter and Nielsen1987).
The milk intake by the calf from calving to 4 months post partum shows no indication of a peak yield in our study. This contrasts with most data from the literature, where yield peaked at week 8 of lactation (Jenkins and Ferrell, Reference Jenkins and Ferrell1984), 40 day (Shell et al., Reference Shell, Early, Carpenter and Buckley1995), 60 day (Clutter and Nielsen, Reference Clutter and Nielsen1987) or 85 to 120 days according to sire breed (Freetly and Cundiff, Reference Freetly and Cundiff1998). On the one hand, double-muscled calves may consume a high amount of milk because of their heavy birth weight (CWb). CWb has a significant effect on IMI and AMI. On the other hand, milk-production capacity of double-muscled cows may be restricted (Ménissier, Reference Ménissier1982), resulting in a flat lactation curve compared with non-double-muscled cows. Le Neindre (Reference Le Neindre1974) and McMorris and Wilton (Reference McMorris and Wilton1986) showed that dam milk is not always used by calf, but the lower milk-production capacity of double-muscled cows may reduce the remainder of milk still available after suckling. Although milk intake was relatively good (Figure 1), a large individual variation is found. Furthermore, it is difficult to accurately estimate milk production, as R 2 amounted to 0.202 using parity, DWp, CW and calf sex. This is considerably lower than the R 2 reported by Clutter and Nielsen (Reference Clutter and Nielsen1987), ranging between 0.59 and 0.76.
Parity, dam weight and dam age correlations with AMI are all low (Table 2). These dam characteristics also have a positive effect on milk yield in experiments of Mondragon et al. (Reference Mondragon, Wilton, Allen and Song1983), McMorris and Wilton (Reference McMorris and Wilton1986) and Clutter and Nielsen (Reference Clutter and Nielsen1987), while Rutledge et al. (Reference Rutledge, Robison, Ahlschwede and Legates1971) reported a quadratic effect of age on milk yield. The small positive correlation between body condition and milk yield in the present study contrasts with the findings of Mondragon et al. (Reference Mondragon, Wilton, Allen and Song1983), that fatter cows produced less milk in both the second and the third lactation. However, the results of the present study indicate that a BCS in BBDM of 1.5 or more may be beneficial for milk production. Consequently, BBDM cows can be restricted if their BCS is 1.5 or higher. This is confirmed by the fact that milk yield was not affected by cow nutrition during the indoor period in our experiment. This is not in agreement with results of Corah et al. (Reference Corah, Dunn and Kaltenbach1975), where a lower pre partum energy level reduced milk yield. This may be due to the fact that calves were born throughout the year in our experiment. However, there was no effect of energy level on calf milk intake during the last 2 months of the restriction period (March–April). The highest milk intake was recorded in May and June. This may be a consequence of the increased milk yield of the dams responding to increased nutrient intake due to the availability of good-quality grass in spring. Similar findings with regard to turn-out are reported by Le Neindre (Reference Le Neindre1974) and Grings et al. (Reference Grings, Short, Klement, Geary, MacNeil, Haferkamp and Heitschmidt2005). Furthermore, it is not excluded that the higher milk yield in May and June is due to a longer photoperiod (Dahl, Reference Dahl2003). Likewise, Shell et al. (Reference Shell, Early, Carpenter and Buckley1995) found no effect of pre partum nutrition on lactation performance. The effect of energy restriction on milk production may be related to the breeds involved. D’Hour and Petit (Reference D’Hour and Petit1998) showed that a low feeding level reduced milk yield in Limousin, but not in Salers cows.
AMI was better correlated to post partum weight in primiparous cows than in multiparous cows. Therefore, a good management of replacement heifers, enabling a proper weight and age at first calving, may be beneficial for milk production during the first lactation. Reports confirming this finding are scarce. Buskirk et al. (Reference Buskirk, Faulkner and Ireland1995) found that milk production increased in beef heifers as their weaning weight and post-weaning gain increased.
Milk intake was not highly dependent on CWb in our experiment (Table 2), although it was included in the models to estimate IMI and AMI. However, Adams et al. (Reference Adams, Staigmiller, Knapp and Lamb1993) reported that calves from high milk producing cow were heavier at birth. Rutledge et al. (Reference Rutledge, Robison, Ahlschwede and Legates1971) found a higher milk intake for heavier calves, using the calf suckling technique. These authors also found a higher milk yield for dams nursing female calves, which is in accordance with our results. Literature data show that milk intake is sometimes higher in males and other times it is higher in females, but the difference is mostly not significant (Melton et al., Reference Melton, Riggs, Nelson and Cartwright1967; Le Neindre, Reference Le Neindre1974; Robison et al., Reference Robison, Yusuff and Dillard1978; Daley et al., Reference Daley, McCuskey and Bailey1987; Marston et al., Reference Marston, Simms, Schalles, Zoellner, Martin and Fink1992).
The positive relationship between dam milk yield (or AMI in our experiment) and calf pre-weaning gain (r = 0.807) or weaning weight (r = 0.783) was in agreement with the findings reported by Neville (Reference Neville1962: r = 0.81). Most authors reported correlation coefficients that were lower than in our experiment (Robison et al., Reference Robison, Yusuff and Dillard1978: r = 0.63; Clutter and Nielsen, Reference Clutter and Nielsen1987: r = 0.60; Daley et al., Reference Daley, McCuskey and Bailey1987: r = 0.36 to 0.45; Lewis et al., Reference Lewis, Klopfenstein, Stock and Nielsen1990: r = 0 to 0.51; Marston et al., Reference Marston, Simms, Schalles, Zoellner, Martin and Fink1992: r = 0.30 to 0.47). Several explanations are possible for our high correlation coefficients. The suckling period is rather short and Clutter and Nielsen (Reference Clutter and Nielsen1987) reported that the correlation between dam milk yield and calf gain declined from 0.6 in the early lactation period to 0.2 later in the lactation period. Generally, milk is considered to be most important early in life and the good relationship between total energy intake and milk energy intake (Figure 2) confirms this consideration. McMorris and Wilton (Reference McMorris and Wilton1986) found that the calf cannot use all the available milk at a higher milk yield in machine-milked dams, resulting in an optimum level of milk yield. This was expressed in a quadratic effect of milk yield on weaning weight. Based on the present data we found a similar R 2 and residual standard deviation for a quadratic as for a linear relationship. The calves made an efficient use of milk: average daily gain increased 79 g/kg milk on average, with 86 and 74 g, respectively, for male and female calves (Table 3; equations (1) to (3)). This is considerably higher than the mean value of 27 g reported by McMorris and Wilton (Reference McMorris and Wilton1986) or 12 to 64 g in experiments of Brown and Brown (Reference Brown and Brown2002). Pre-weaning live-weight gain was not clearly affected by dam parity, but there was a small tendency for a linear increase with increasing parity (P = 0.152). The effect of parity can be explained by the effect on milk production, as the P-value rose to 0.452 when milk production was used as a covariate. The slightly higher milk intake by female calves (P = 0.071) did not result in a higher pre-weaning gain (P = 0.544), which can indicate a more efficient use of the milk by male calves. Indeed, energy intake per kg live-weight gain from milk and solid feed was lower in male calves.
The regression equation based on cow parity, calf age, CW and calf sex was a poor predictor of IMI. While early provision of solid feed may be desirable, our data from the indoor period show a small benefit of extra feed, as 83% of the variation in daily net energy intake from milk and solid feed was explained by the energy intake from milk.
In conclusion, the daily milk intake during a 16-week suckling period averaged 7.0 kg daily in BBDM calves. Individual variation is considerable, which complicates an accurate estimation of the intake. Therefore, the calf needs extra attention, as pre-weaning live-weight gain is largely dependent on milk intake. The consumption of solid feed did not compensate for a low milk intake. A threshold body condition score at calving of 1.5 seems desirable for a higher milk production.
Acknowledgements
This research was financed by the Ministry of Small Enterprises, Traders and Agriculture, Administration for Research and Development (DG6), Brussels. The authors greatly acknowledge Koen Desomviele, Kristof Pieters and Robert Coens for their skilled technical assistance.