


INTRODUCTION
Economic historians agree that technological change is among the most important determinants of long-run economic growth (Mokyr Reference Mokyr1992), but also a form of “creative destruction” that can have economically and societally disruptive effects (Schumpeter Reference Schumpeter1942). Does technological change also disrupt the distribution of political power in society? Different schools of thought, including modernization theory (e.g., Deutsch Reference Deutsch1961), the new institutionalism (e.g., Acemoglu and Robinson Reference Acemoglu and Robinson2006), as well as Marxist approaches (e.g., Boix Reference Boix2015), suggest that technological change can weaken entrenched political elites and strengthen political outsiders, representing a potentially powerful force for political turnover and democratization. However, empirical evidence for a linkage between technological change and political turnover is surprisingly scarce.
Drawing on a theoretical framework based on models of contests, this paper highlights three channels through which technological change can contribute to political turnover: (i) by increasing the financial capacity of politically excluded groups to contest political power, (ii) by strengthening their economic incentives to seek political representation, and (iii) by facilitating collective action. The channels are complementary, in the sense that increases in the wealth of a politically excluded group are more likely to result in improvements in its political representation if also accompanied by strengthened incentives to invest that wealth in competing for political power or greater efficiency of collective action.
To test the theoretical argument, this paper leverages a large-scale historical natural experiment: the impact of the green revolution on single-party dominance in India. In terms of its impact on agriculture, the green revolution was comparable in magnitude to the impact of the industrial revolution on manufacturing (Evenson and Gollin Reference Evenson and Gollin2003), making it a valuable large-scale historical natural experiment through which to investigate the political consequences of transformative technological change. Integrating the theoretical argument with historical evidence, this paper contends that the spread of high-yielding variety (HYV) crops contributed to the emergence of a rising commercial class of agricultural producers with the wealth, incentives, and collective action capacity needed to seek a greater share of political representation. In a context of rural exclusion from the urban- and elite-dominated leadership of the dominant Congress party (Lipton Reference Lipton1977; Rudolph and Rudolph Reference Rudolph and Rudolph1987), this contributed to the rise of agrarian opposition parties and played a pivotal role in India's historical transition from single-party dominance to multiparty competition, an important historical episode of democratic deepening or democratization.Footnote 1 Cumulatively, the political changes wrought by the green revolution represent a quintessential case of “political creative destruction,” with important theoretical implications for the political economy of growth and democratization.
To test the argument, this paper exploits district-level panel data on the share of agricultural land planted with HYV crops over time, geocoded to over 20,000 election races between 1957 and 1987 (covering the key decades of the green revolution as well the decade prior). Exploiting time variation arising from the introduction of HYV crops to India in 1967, together with district-level variation in suitability for the new crop technology based on the on the share of district land with a naturally occurring aquifer (HYV crop cultivation was water intensive and required capacity for irrigation), instrumental variables analyses show that the green revolution played a pivotal role in the decline of single-party dominance.
Looking at mechanisms, quantitative tests and case studies suggest that the new crop technology represented a potent force for political turnover because it impacted multiple complementary channels. HYV crops provided wealth to politically excluded agricultural producers by improving agricultural productivity. HYV crops provided incentives to rural groups to seek political representation by intensifying the dependency of agricultural profitability on government-provided inputs and subsidies. HYV crops also provided collective action capacity to the rural sector by exerting downward pressure on crop market prices, which provided a focal point for cross-class rural collective action. These economic changes created electoral conditions favorable to the rise of agrarian opposition parties promising subsidies for the agricultural sector and greater descriptive representation of rural groups. A comparison with the electoral effects of positive rainfall shocks, which increased rural wealth but did not change rural incentives to seek political power or capacity for collective action, suggests that a pure wealth effect would not have contributed to political turnover to the same extent.
The findings have important implications for the political economy of democratization. They demonstrate that technological change represents an important force for political turnover in political systems dominated by entrenched elites and parties. This is consistent with literature that highlights the important role that technological shocks play in long-run political development (e.g., Boix Reference Boix2015), including work that shows that technological changes in the agricultural sector can have important political consequences (e.g., Acharya, Blackwell, and Sen Reference Acharya, Blackwell and Sen2016). These dynamics also have important implications for the political economy of development. They support the idea that entrenched political elites possess strategic incentives to block or carefully manage technological change (e.g., Acemoglu and Robinson Reference Acemoglu and Robinson2006; King, Pan, and Roberts Reference King, Pan and Roberts2013), adding to an existing literature that highlights other barriers to technological change, including insecure property rights institutions (North Reference North1990), vested economic interests (Olson Reference Olson1982), and insufficiently long political time horizons (Simmons Reference Simmons2016).
The remainder of the paper is structured as follows. It first theoretically elaborates the channels linking technological change to political turnover. It then describes the role of these dynamics in the case of the green revolution in India. It then describes the data and empirical strategy before reporting the main results, testing mechanisms, and concluding.
TECHNOLOGICAL CHANGE AS POLITICAL CREATIVE DESTRUCTION
What links technological change to political turnover? As a form of “creative destruction,” technological change generates increases in productivity at the expense of old firms and technologies that are rendered obsolete by new ones (Schumpeter Reference Schumpeter1942). Acemoglu and Robinson (Reference Acemoglu and Robinson2006) argue that technological change therefore creates “societal turbulence,” weakening political incumbents; they then examine the implications for the equilibrium choice by incumbent political elites to block or permit technological change. But how exactly does technological change destabilize incumbents?
Broadly, existing theories of the impact on technological change on politics can be divided into at least three categories. First, modernization theory highlights the role of technological modernization in contributing to a teleological progression from tradition-bound political systems to more competitive ones characterized by mass political consciousness and greater political participation as well as competition (e.g., Deutsch Reference Deutsch1961). Second, institutionalist arguments highlight the role of technological change in the formation of rising commercial interests that seek representation to protect their wealth against sovereign expropriation (e.g., Acemoglu, Johnson, and Robinson Reference Acemoglu, Johnson and Robinson2005; Ansell and Samuels Reference Ansell and Samuels2010; North and Weingast Reference North and Weingast1989). Third, Marxist-inspired arguments highlight the role of technological change in contributing to collective action by new social forces that seek political power to advance their class interests (e.g., Boix Reference Boix2015). Marxist and institutionalist accounts have traditionally taken the historical experience of European political development as their inspiration, while modernization theorists have focused on explaining political change in contemporary developing countries.
In spite of their differences of emphasis, the modernization, institutionalist, and Marxist approaches share important similarities. All three approaches can be usefully integrated into a theoretical framework that views competition for political power between multiple groups in society as a zero-sum contest for a valuable prize (see, e.g., Skaperdas Reference Skaperdas1996).Footnote 2 The literature on contests is useful as a theoretical device because it abstracts away from specific institutional or historical contexts, and the specific protagonists emphasized as a result, highlighting instead the general idea that political power is divided between groups as an increasing function of their relative investments in the contest for power. Adopting the theoretical framework provided by contest models, it is clear that a technological shock can contribute to political turnover in at least three ways.
First, increases in the wealth of a politically excluded group due to benefiting from a new technology can increase its ability to finance political mobilization and therefore result in an increased share of political power at the expense of incumbents. This corresponds, for example, to arguments in the institutionalist literature that “rising economic groups’ newfound wealth improves their ability to successfully change the regime” (Ansell and Samuels Reference Ansell and Samuels2010, p. 6). Central to this line of argumentation is the presence of political credit constraints. In the absence of such constraints, competitors could simply borrow to finance political mobilization, a possibility sometimes ignored in literature assuming a straightforward connection between wealth and political power. In the absence of fully functioning political credit markets, however, wealth constraints affect groups’ ability to invest in political competition and technological shocks to group wealth can therefore shift the balance of political power.
Even when politically excluded groups possess sufficient wealth to mobilize politically, they may fail to do so without incentives to seek political power. A second channel through which technological change can contribute to political turnover is by strengthening the economic incentives of excluded groups to seek a greater share of political power, if political control is complementary to the productive potential of the new technology. In the framework of contest models, a new technology can increase the value of political control to politically excluded groups. The nature of this complementarity depends upon the specific context. Institutionalists, with their emphasis on the historical establishment of limited government in Europe, focus on the wealth defense motive, with commercial entrepreneurs mobilizing to establish property rights and protect their growing assets against sovereign expropriation (Acemoglu, Johnson, and Robinson Reference Acemoglu, Johnson and Robinson2005; Ansell and Samuels Reference Ansell and Samuels2010; North and Weingast Reference North and Weingast1989). By contrast, modernization theorists focused on interest group politics in developing countries highlight a more proactive attempt by mobilized entrepreneurial groups to capture government to advance policies complementary to their class, sectoral or ethnic interests (e.g., Deutsch Reference Deutsch1961; Bates Reference Bates1974). By increasing the economic returns to political control, technological change can therefore provide incentives for politically excluded groups to mobilize politically.
Third, new technologies can facilitate collective action. In the framework of contest models, technological changes can improve the efficiency of collective action, changing the “function” mapping investments by excluded groups to the probability of winning political power. Some technologies, such as cellular phones, have contributed directly to collective action by reducing the costs of political mobilization by rebel or excluded groups (see e.g., Pierskalla and Hollenbach Reference Pierskalla and Hollenbach2013). New military technologies are a classic example of innovations that can shift the balance of political power between rival groups by improving one side's effectiveness in conflict (see, e.g., Boix Reference Boix2015). Marxist arguments additionally emphasize the psychological effects of technological change in highlighting shared economic interests, providing a focal point for collective action by individuals otherwise divided by cross-cutting cleavages. Marx prognosticated about the role of immiserating industrialization in the development of class-consciousness among industrial workers, but the argument can be extended to the role of structural change in encouraging class- or sector-based political identification and collective action more generally. By reducing the costs of political mobilization or by providing a focal point for collective action around shared class or sectoral interests, technological change can facilitate collective action by politically excluded groups.
A clear requirement for the effects described above is that the technological shock primarily benefits a politically excluded or underrepresented group; a technological shock benefiting entrenched elites and incumbents would have the reverse effect of reinforcing the status quo. Additionally, the different mechanisms are clearly complementary, suggesting mutually reinforcing comparative statics. Increases in the wealth of a politically excluded group are more likely to result in improvements in its political representation if also accompanied by strengthened incentives to invest that wealth in competing for political power and greater efficiency of collective action. Conversely, without adequate incentives to invest in competing for political power or capacity for collective action, changes in wealth alone may fail to impact the existing balance of political power.
However, precisely because they threaten political incumbents, politically destabilizing innovations ought to remain “off the equilibrium path” altogether due to strategic obstruction. Acemoglu and Robinson (Reference Acemoglu and Robinson2006) develop a formal model of the “political replacement effect,” which elaborates the conditions under which rational incumbents are likely to block or permit the introduction of a new technology. In the model, extremely politically secure elites are more permissive of innovation because they are not likely to be displaced. The model also suggests that technological change is more likely in highly competitive political systems, where frequent turnover means that incumbent elites have relatively short expected tenures regardless of the choice to permit innovation. It is in the case of moderately entrenched elites, who are at risk of displacement and with considerable rents at stake, that technological change is most likely to be blocked. This suggests that, observationally, we will tend to see technological change in settings where the new technology is unlikely to threaten the incumbent or where its destabilizing effects are difficult to disentangle from preexisting high levels of political turnover.
However, in many cases, incumbents lack the capacity to block or fail to anticipate the long-run consequences of technological change, providing an opportunity to observe “political creative destruction” at work. History is replete with examples of technological innovations that had sweeping economic and political consequences that incumbents failed to block or anticipate. Important arguments suggest that technological revolutions such as advances in shipping, the emergence of cities, or the industrial revolution, resulted in economic as well as political revolutions (see, e.g., Acemoglu, Johnson, and Robinson Reference Acemoglu, Johnson and Robinson2005; Boix Reference Boix2015; Mokyr Reference Mokyr1992). Yet microlevel empirical evidence for a linkage between technological change and political turnover is surprisingly scarce. This paper aims to fill the gap by examining the political consequences of one of the most important technological transformations impacting the developing world in the twentieth century: the green revolution.
THE GREEN REVOLUTION AS A HISTORICAL NATURAL EXPERIMENT
HYV crops, highly productive “dwarf” cultivars developed by Norman Borlaug and scientists working in Mexico, revolutionized agricultural production across the developing world between the 1960s and 1980s, a transformation commonly known as the green revolution (Evenson and Gollin Reference Evenson and Gollin2003). Under ideal conditions, the new HYV crops, such as the IR8 variety of rice and Mexican modern varieties of wheat, could achieve yields more than double that of traditional varieties (Frankel Reference Frankel1975, 23). The green revolution reached India in 1966–67, when HYV seeds, at first primarily wheat and rice (but later other varieties as well), were finally adapted to Indian conditions and saw widespread uptake across the country over the following two decades.
Two features make the green revolution in India a likely candidate for a case of political “creative destruction.” First, HYV crops benefited a group, in this case agricultural producers, that was excluded from effective representation within the dominant Congress party. Second, the new crop technology provided this politically excluded group with wealth, incentives to seek political representation, and collective action capacity in precisely the manner that the theoretical discussion has suggested could result in political mobilization and turnover. Integrating the theoretical argument with historical research, this paper contends that the green revolution not only revolutionized agricultural productivity but also played a pivotal role in the rural political mobilization that contributed to India's historical transition from single-party dominance to multiparty competition.
HYV crops were introduced to India under a “new agricultural strategy” adopted in the mid-1960s, as a result of a combination of exogenous shocks (Varshney Reference Varshney1998, 48). First, the death of India's first prime minister, Jawaharlal Nehru, in 1964 brought to power Lal Bahadur Shastri, who was more ideologically committed to improving agricultural productivity through investment in new agricultural technologies. Second, the Indo-Pakistani war of 1965 heightened tensions with the United States, intensifying the desire among Indian political leaders to reduce dependence upon American food aid amid the Cold War. Third, droughts leading to a food production crisis in 1966 heightened concerns about national food production, spurring efforts to disseminate HYV crops throughout the countryside.
Once introduced to India, HYV crops overwhelmingly spread to districts either with preexisting irrigation infrastructure or capacity for irrigation, particularly in the form of aquifers, which individual cultivators could exploit directly by means of tube-wells (Rud Reference Rud2012). This was due to the fact that, for biological reasons, HYV crop cultivation required steady and intensive application of water; in the presence of controlled irrigation, HYV crops delivered yield increases of up to 200%, while in the absence of irrigation they delivered lower yields than did traditional strains (Frankel Reference Frankel1975). HYV crops were distributed technocratically, with the technical aid of international agencies such as the Ford and Rockefeller foundations as well as major domestic agricultural research centers and universities. Public distribution of HYV seeds occurred initially, before countrywide roll-out, via the Intensive Agricultural Districts Program (IADP), which targeted the 16 model' districts viewed as most agriculturally advanced and equipped with irrigation infrastructure to take advantage of the new seeds.
In districts impacted by the green revolution, HYV crop cultivation revolutionized agricultural productivity, resulting in a transition from subsistence to commercialized agriculture. This benefited an increasingly wealthy “middle peasantry” comprised of typically lower- and intermediate-caste farmers with sufficient landholdings and the economies of scale needed to take advantage of the new crop technology, a group that, according to various estimates, represented roughly 30% of the Indian population (Brass Reference Brass1980). Not only was the middle peasantry increasingly wealthy, but, as in nearly all countries affected by the green revolution, increasingly dependent on government-controlled economic policies. HYV crop cultivation required intensive usage of inputs, including fertilizer and pesticide, electrification for operating tube-wells, and equipment for mechanized cultivation. All of these inputs depended wholly or in part on government provision and subsidization (see e.g., Harriss Reference Harriss and Farmer1977, 256). Marketing crop surpluses required infrastructure investments, especially in roads for transportation and storage facilities. Moreover, the increased output of HYV crops placed downward pressure on crop market prices, making the level at which the government set crop procurement prices an increasingly visible issue affecting farmers’ profits.
These economic changes converted the previously quiescent countryside into a hotbed of political mobilization. The increasing wealth of cultivators made them capable of political mobilization independent of the vertical ties of patronage that characterized Congress party dominance in rural India (see e.g., Wilkinson Reference Wilkinson, Kitschelt and Wilkinson2007). The magnified impact of government policies on agricultural profitability provided incentives for agricultural producers to mobilize politically to demand subsidies. Falling prices, a grievance that resonated not only with the prospering middle peasantry but with small-scale farmers that were left out of the green revolution, provided a focal point for cross-class rural collective action. Initially, growing rural demand for policy influence took the form of protests at district headquarters and the national capital, organized by farmers’ associations to demand greater subsidies, investment, and remunerative prices for the agricultural sector (Varshney Reference Varshney1998, 81).
Over time, the green revolution created electoral conditions favorable to the emergence and success of agrarian and regional opposition parties. The growing articulation of rural “voice” in the wake of the green revolution benefited agrarian and regional opposition parties because rural and cultivating caste groups were heavily underrepresented in the urban and elite-dominated leadership of the dominant Congress party (Rudolph and Rudolph Reference Rudolph and Rudolph1987). By contrast, agrarian and regional opposition parties offered not only subsidies but descriptive representation for excluded rural groups. Gaining representation in state legislatures was important to gaining direct control over agricultural policies. On a more quotidian level, gaining representation in local district party branches, district boards, local cooperative societies, and elected village councils was also important, because these district-level institutions governed the local distribution of pesticide, fertilizer, agricultural credit, tube wells, seeds, and a variety of other inputs required for HYV crop cultivation (Brass Reference Brass1965).
In addition to defeating the Congress party at the state level, newly emergent agrarian and regional opposition parties played a pivotal role in the Janata coalition, which defeated the Congress party in national elections for the first time in India's history in 1977. By the 1980s, opposition parties drawing support from rural and cultivating caste groups had established multiparty competition in many of India's states, and also played an important role in the Janata Dal coalition, which defeated the Congress party for the second time in parliamentary elections in 1989, ushering in India's transition to multi-party competition at the national level.
The outburst of agrarian political mobilization is widely recognized as a key component of the dominant Congress party's long-run decline (e.g., Rudolph and Rudolph Reference Rudolph and Rudolph1987). Prominent arguments trace this rural political mobilization to the structural bias in favor of the rural majority in democracies (e.g., Varshney Reference Varshney1998). Others focus on the ethnic dimension of mobilization by lower-caste groups in opposition to the upper-caste bias of the Congress party's leadership (e.g., Jaffrelot Reference Jaffrelot2003). Both arguments have important synergies with those advanced in this paper. The presence of robust elections provided the institutional conditions through which rural interests could assert themselves; in their absence, technological change may have contributed to political change by conflictual means, as some observers feared contemporaneously (Frankel Reference Frankel1975). The rural-urban divide also corresponded to a conflict between cultivating “backward caste” groups and upper-caste groups. Caste associations provided an important basis for collective rural action, and the platforms of agrarian and regional opposition parties often fluidly combined ethnic as well as sectoral appeals to these overlapping politically excluded groups.
However, electoral institutions and ethnic rivalries cannot explain the timing of the Congress party's decline, as elections and ethnic rivalries existed prior to as well as following the green revolution. In the empirical analysis, unit fixed effects absorb electoral institutional characteristics and ethnic composition variables that are largely fixed over time. This paper instead traces the uneven rise of rural political mobilization over time squarely to the adoption of the new crop technology and its impact on the emergence of a rising class of agricultural producers with growing incentives and capacity to seek a greater share of political power.
EMPIRICAL STRATEGY
To estimate the political effects of the green revolution, in the basic specification, this paper estimates a panel fixed effects OLS regression of the form,
 $$\begin{equation*}
{Y_{rdit}} = {\gamma _{rd}} + {\rm{\ }}{\tau _{rt}} + \alpha HY{V_{rdt}} + {\rm{\ }}{\varepsilon _{rdit}},
\end{equation*}$$
where the outcome variable Yrdit is a measure of the dominant Congress party's election performance, in region r, district d, constituency i, and year t. The main outcome of interest is the election performance of the Congress party in state assembly elections, defined in terms of percentage point vote share and an indicator for winning the seat as well. The focus is on state elections because, as discussed, the decline of single-party dominance first occurred at the state level, which laid the groundwork for the later emergence of multiparty competition nationally. The variable HYVrdt is a district-level measure of HYV crop adoption, defined as the share of district-level agricultural land planted with HYV crops.
All specifications include district, γrd, and region-year, τrt, fixed effects. A panel fixed effects regression of this form estimates the effect of changes within districts over time in HYV crop adoption on the Congress party's performance in elections, while also partialing out any time-based shocks and trends common to constituencies within regions.Footnote 3 Region-year fixed effects ensure that the effects of HYV crop adoption are identified from over-time comparisons only between districts located within geographically and linguistically comparable regions. To account for the fact that HYV crop adoption is measured at the district level while election outcomes are observed at the assembly constituency level (multiple assembly constituencies fit contiguously within a district), for over-time correlation of errors within districts, and for regional spatial correlation in the diffusion of HYV crops, all analyses report robust standard errors adjusted for two-way clustering within districts and by region-years.
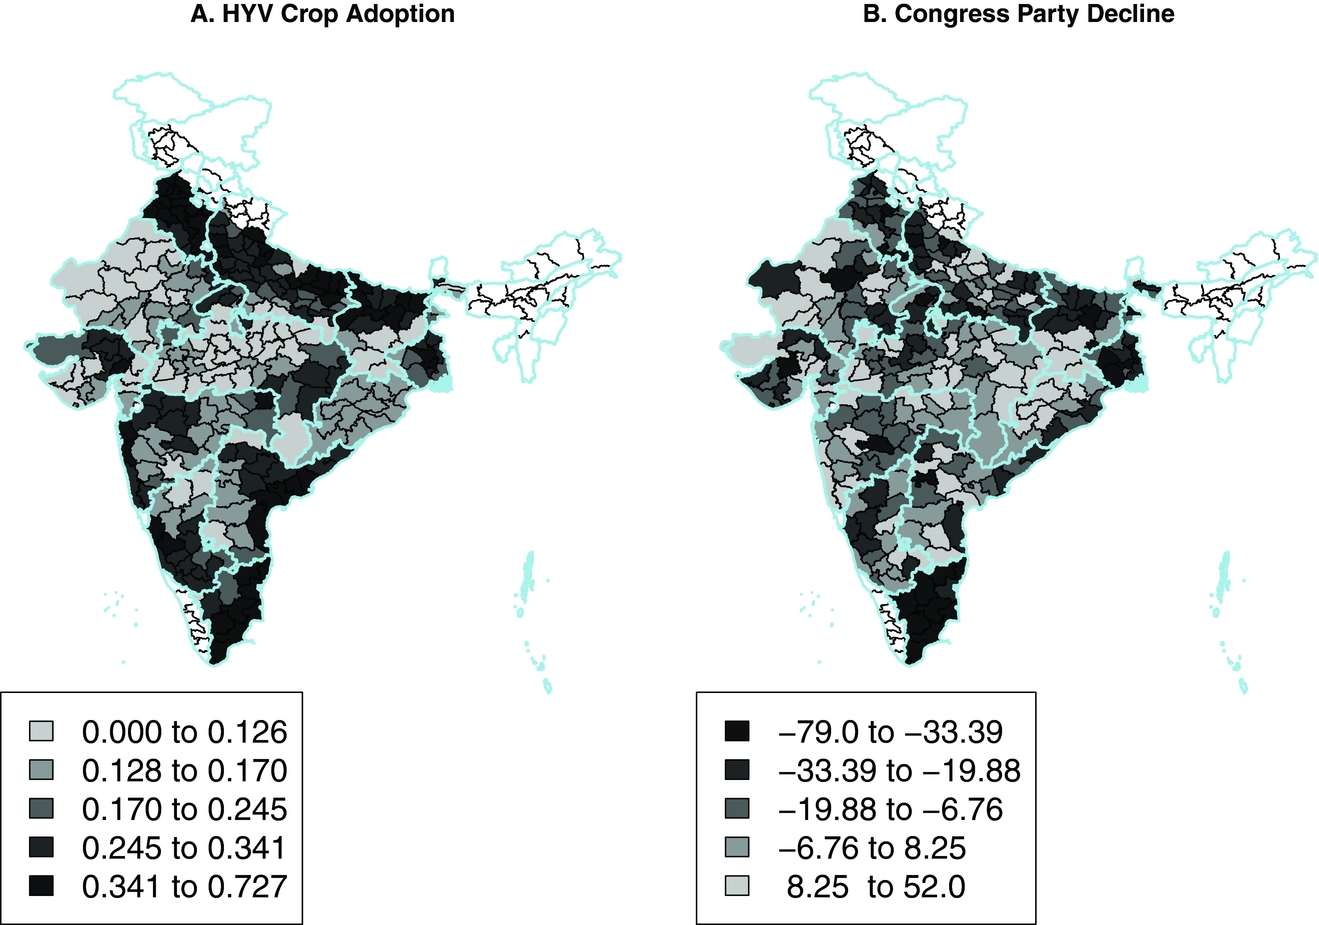
The election data are based on reports produced by the Election Commission of India, which were scraped by Jensenius (Reference Jensenius2013) for elections from 1961 onward. This paper extends this election dataset back in time by scraping the data for elections held in 1957.Footnote 4 The data on HYV crop adoption is based on annual district-level crop coverage and production statistics published by the Indian government, based on agricultural sample surveys conducted by local district-level officials. This data was compiled into a district-level panel dataset covering 270 districts across India's major states between 1957 and 1987 by Sanghi et al. (Reference Sanghi, Kavi Kumar and McKinsey1998).Footnote 5 Connecting the political and agricultural data yielded a panel dataset linking district-level HYV crop adoption data to constituency-level electoral data for over 21,000 state assembly election races across India's major states between 1957 and 1987. Figure 1 displays district-level maps of the data. Panel A displays mean HYV crop adoption between 1967 and 1987. Panel B displays over-time change in the Congress party's election performance, computed by subtracting the average percentage of seats won in elections after the introduction of HYV crops in 1967 (inclusive) from the average percentage of seats won before 1967.
Mean HYV Crop Adoption and Change in Congress Seat Share

A concern regarding a panel fixed effects OLS approach is that incumbent politicians may have strategically manipulated the diffusion of HYV crops over time, especially as agricultural policy became increasingly politicized as a result of rural political mobilization. The direction of the bias implied by such dynamic targeting is unpredictable, depending upon whether the Congress party targeted supporters, opposition areas, or swing voters (Dixit and Londregan Reference Dixit and Londregan1996). To address endogeneity in the diffusion of HYV crops, this paper utilizes an instrumental variables identification strategy. An instrumental variables identification strategy also eliminates downward bias in coefficient estimates resulting from measurement error, which is likely to be sizable, as a result of sampling error in the agricultural surveys from which the official statistics on HYV crop adoption are obtained, as well as the aggregated level, the district, at which HYV crop adoption is measured.
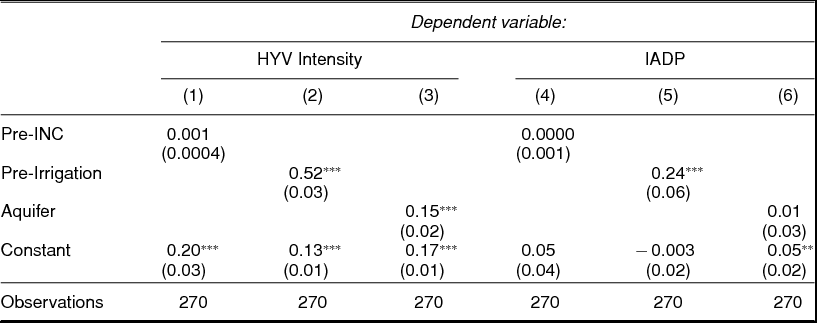
To construct an instrument for HYV crop adoption, this paper utilizes the fact that HYV crops, the cultivation of which required intensive and steady dosages of water, delivered yield improvement only in conditions of access to controlled irrigation. As Table 1 illustrates, for this reason, after their introduction, HYV crops overwhelmingly disseminated to districts with preexisting irrigation infrastructure or capacity for irrigation in the form of aquifers. The first stage regression takes the form:
 $$\begin{equation*}
HY{V_{rdt}} = {\rm{\ }}{\gamma _{rd}} + {\rm{\ }}{\tau _{rt}} + \beta Aquife{r_{rd}} \times Post_t^{1967} + {\rm{\ }}{\nu _{rdit}},
\end{equation*}$$
where Aquiferrd × Post 1967t is the instrument, a cross-sectional measure of the share of district land with a naturally occurring aquifer interacted with a dummy variable that “switches on”' for all districts with the introduction of HYV crops to India from 1967 onward. This paper uses aquifer coverage as the cross-sectional suitability measure since aquifers are naturally occurring and more clearly exogenous than preexisting irrigation infrastructure.Footnote 6 Lower-order terms are absorbed via district and region-year fixed effects, which also absorb time invariant omitted variables as well as region-specific time shocks. The second stage regression is the main OLS specification. The exclusion restriction requires that, conditional upon covariates, areas with greater aquifer coverage saw a larger over-time decline in the Congress party's election performance after 1967 only as a result of differentially higher rates of HYV crop adoption over time and not for other reasons. The plausibility of this assumption is discussed and tested following the main results.
Pretreatment Determinants of HYV Crop Adoption

Notes: Unit of observation is district. Outcomes: HYV Intensity is mean district-level HYV crop adoption, 1967–1987. IADP is an indicator for whether a district was selected for the Intensive Agricultural Districts Program. Explanatory variables: Pre-INC is pre-1967 average Congress seat share. Pre-irrigation is share of agricultural land with access to irrigation in 1966. Aquifer is the share of district land with a naturally occurring aquifer. Analysis estimated by OLS. * p < 0.1; ** p < 0.05; *** p < 0.01
To measure district-level aquifer coverage, this paper utilized historical groundwater maps published in the National Atlas of India, based on information from the Geological Survey of India. The advantage of utilizing historical maps, first published in 1977, is that they provide information about aquifers that was available contemporaneously as the green revolution was occurring. The maps contain detailed local outlines of three aquifer types in order of depth: (i) fairly extensive thick aquifers occurring beyond 150 meters, (ii) aquifers with limited extent occurring between 100 meters and 150 meters, and (iii) aquifers with restricted extent occurring up to 100 meters. To quantify district-level aquifer coverage, the groundwater maps were first geocoded to shapefiles of 1961 district boundaries. GIS software was utilized to generate polygons corresponding to aquifers and to compute the share of each district's surface area intersecting with an aquifer of any type. A snapshot of the coding process is depicted in Figure A1 of the Online Appendix.
REGRESSION RESULTS
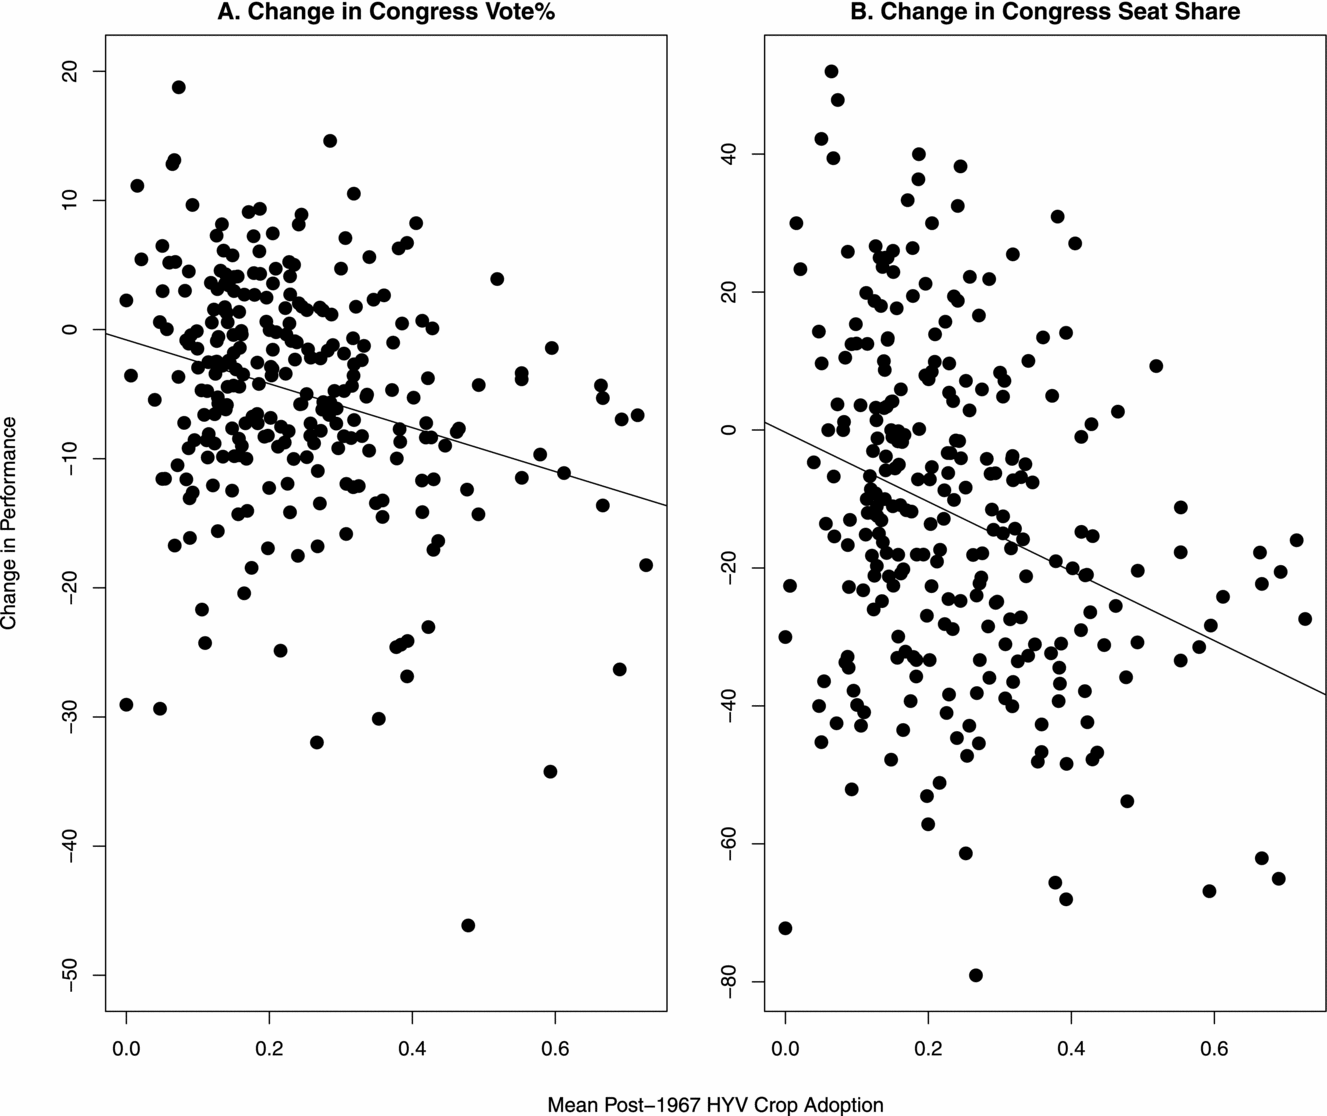
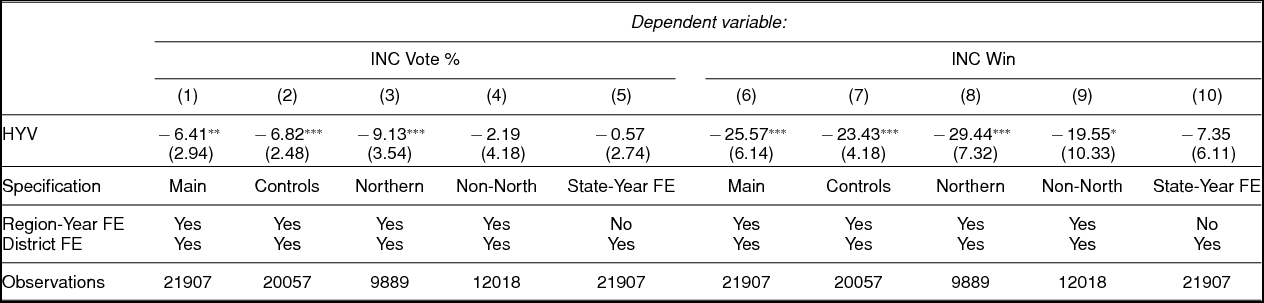
A simplified version of the OLS regression analysis is visualized in Figure 2, which depicts a scatter plot of change in Congress party vote share and seat share from the pre- to the post-1967 HYV crop introduction period against mean post-1967 HYV crop adoption. A large, negative relationship is apparent, providing preliminary evidence that districts that experienced the green revolution with greater intensity experienced a larger long-run decline in the dominant party's election performance. Table 2 reports the OLS regression estimates, based on panel data and using assembly constituencies as the unit of analysis. The coefficients suggest that the green revolution played an important role in the decline of single-party dominance in India. The results of the baseline specification, reported in columns (1) and (6), imply that a 10 percentage point increase in the share of agricultural land planted with HYV crops reduced the dominant party's vote share by 0.64 percentage points and the probability of electing a dominant party legislator by 2.6 percentage points.
HYV Crop Adoption and Congress Party Decline Across Districts

OLS Estimates: Effects of HYV Crops on Single-Party Dominance

Notes: Unit of observation assembly constituency-year for election years between 1957–1987. Outcomes: INC Vote % indicates Congress percentage point vote share and INC Win indicates whether Congress won seat. Explanatory variables: HYV crop adoption is district-level share of agricultural land planted with HYV crops. Standard errors adjusted for two-way clustering within districts and by region-year.
* p < 0.1; ** p < 0.05; ***p < 0.01
The average share of agricultural land under HYV crops across all district-years following the introduction of HYV crops to India was 0.24 (descriptive statistics for major variables are reported in Table A1 of the Online Appendix). This implies that, if we multiply this number by the estimated impact of HYV crops, the green revolution accounted for roughly a 1.54 percentage point reduction in Congress party vote share and 6.1 percentage point reduction in Congress party's seat share from the pre- to the post-green revolution period. These are very large estimates, accounting for roughly a third of the Congress party's observed decline of 5.8 percentage points in vote share and 16.9 percentage points in seat share from the pre- to the post-HYV crop introduction period in the sample under analysis.
The estimates are robust to a range of additional specifications. The specifications reported in columns (2) and (7) additionally control for year fixed effects interacted with a variety of pretreatment variables: a measure of initial district-level Congress party seat share in 1957, a measure of the urbanization rate according the 1961 census, an estimate of pre-green revolution agricultural productivity per rural capita (computed by multiplying district crop production statistics for the six major crops by real crop prices and dividing by the rural population according to the 1961 census), a dummy variable indicating historical exposure to direct British colonial rule, and a variable representing the share of land exposed historically to a colonial-era landlord-based land tenure system.Footnote 7 The estimates remain substantively large and significant, suggesting that the results are not driven by time trends related to these important variables.
Columns (3) and (4) and (8) and (9) split the sample into the northern and non-northern regions, to examine effect heterogeneity. Scholarship on the rise of agrarian mobilization in India often focuses on lower-caste and rural movements in the Hindi belt and northern India (see, e.g., Brass Reference Brass1980; Jaffrelot Reference Jaffrelot2003). The north of India is culturally distinct and, apart from Punjab, relatively less prosperous than other regions of the country, raising the possibility that the effects of the green revolution were perhaps unique to the specific context of this region. However, the argument advanced in this paper, tying political turnover to technological change, is not intrinsically region specific. This is supported by the data and analysis. The estimates are similar in both subsamples, demonstrating that the effects of technological change on political turnover can exist across heterogeneous social environments.
Finally, columns (5) and (10) control for state-year fixed effects to address potentially unobserved cross-state heterogeneity and limit the comparisons driving the estimates to over-time changes in HYV crop adoption across districts within the same state. While the estimated coefficients still possess the expected signs, the magnitude of the coefficients shrinks considerably. As discussed, however, this is potentially driven by the fact that the inclusion of a large number of fixed effects tends to attenuate OLS estimates in the presence of measurement error (see, e.g., Angrist and Pischke Reference Angrist and Pischke2008). A test of this is to compare OLS estimates with instrumental variables estimates, which are not biased downward due to measurement error or due to the potentially strategic distribution of HYV crops.
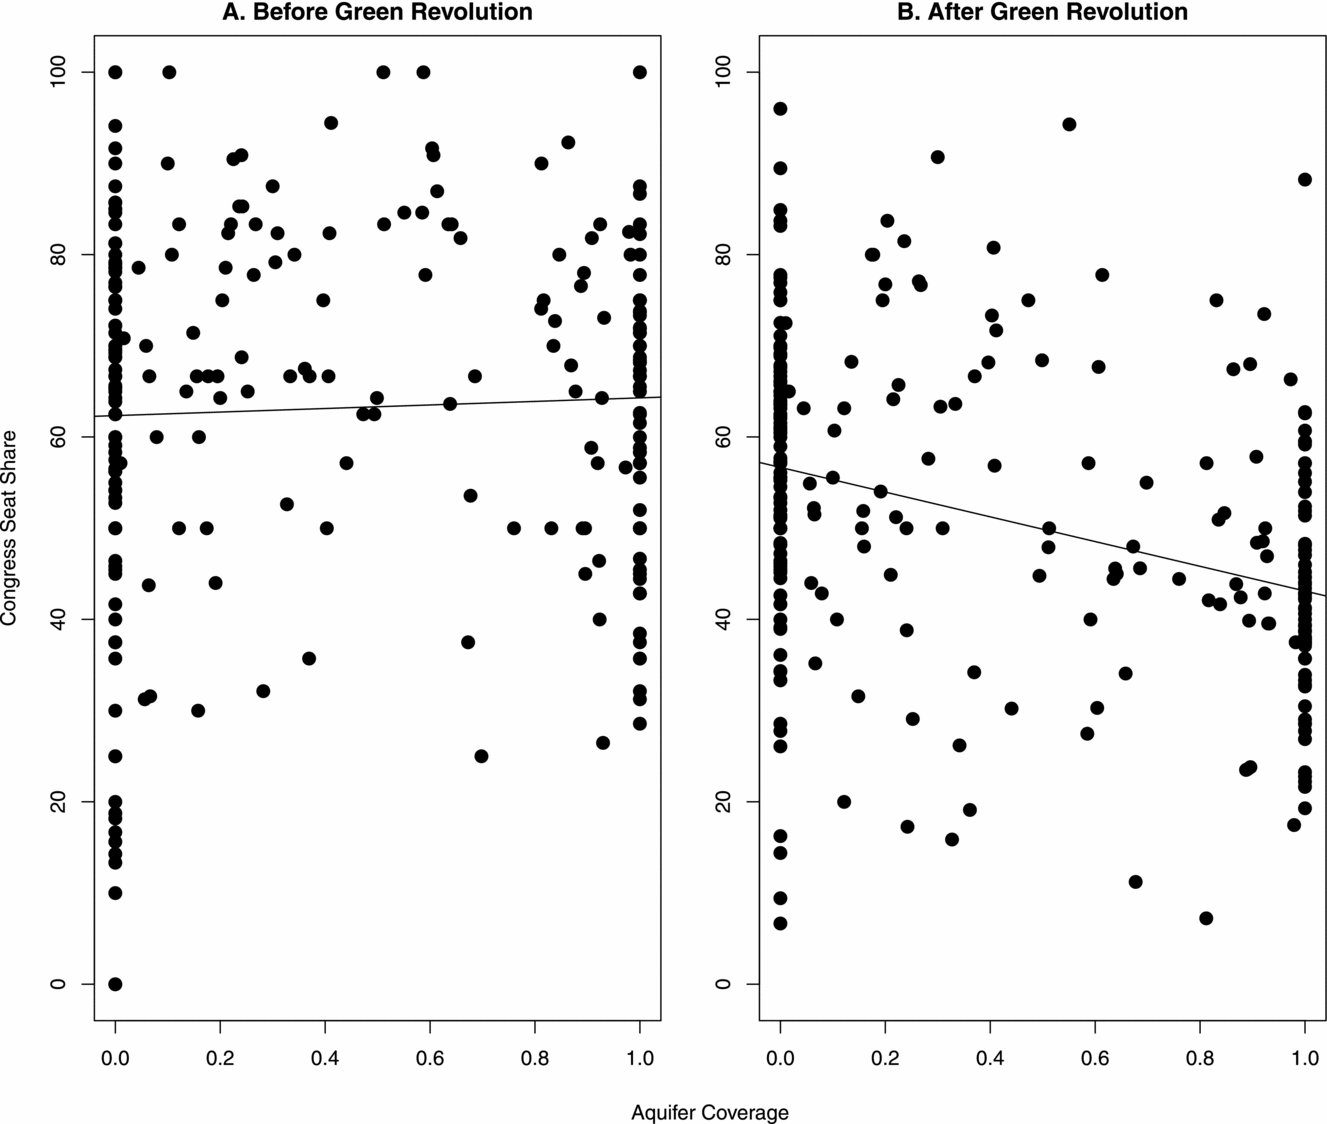
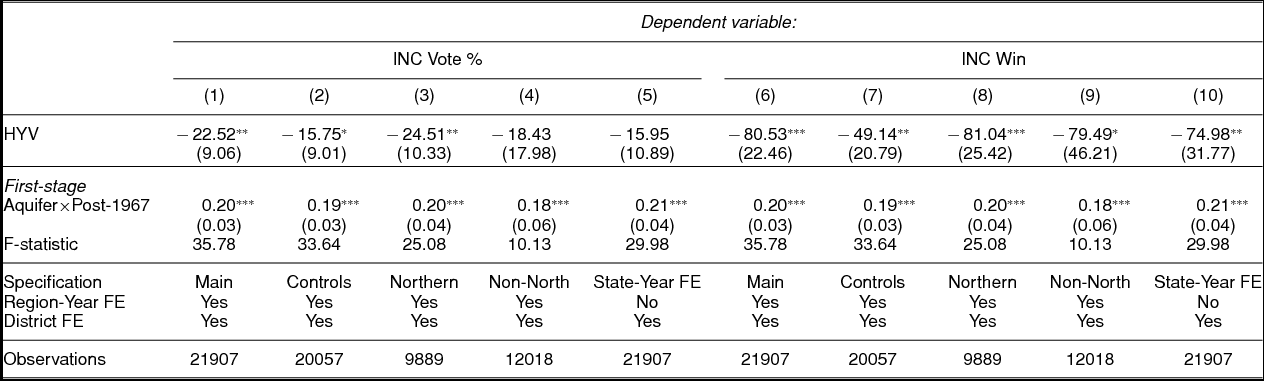
As discussed, the intuition behind the IV strategy is to examine whether areas that saw higher rates of HYV crop adoption from the pre- to the post-1967 period, as a result of greater suitability for the new technology, also experienced a larger over-time decline of single-party dominance. A simplified version of the analysis is visualized in Figure 3 in the form of two district-level plots. Panel A displays the absence of a relationship between aquifer coverage and the Congress party's election performance before the introduction of HYV crops in 1967. Panel B displays the negative reduced-form relationship that emerged following the introduction of HYV crops. Table 3 reports the IV regression estimates, showing that districts that experienced the green revolution with greater intensity due to greater aquifer coverage saw a much larger decline in single-party dominance. The baseline IV estimates reported in columns (1) and (6) suggest that a 10 percentage point increase in the share of agricultural land planted with HYV crops resulted in a 2.3 percentage point decline in Congress party vote share and 8.1 percentage point loss of seat share. The sign and magnitude of the estimates are robust across the inclusion of covariates and different subsamples of the data. The first stage estimates show a strong relationship between the instrument and HYV crop adoption across specifications.
Reduced Form Relationship between Aquifer Coverage and Congress Performance

IV Estimates: Effects of HYV Crops on Single-Party Dominance

Notes: Unit of observation assembly constituency-year for election years between 1957–1987. Outcomes: INC Vote % indicates Congress percentage point vote share and INC Win indicates whether Congress won seat. Explanatory variables: HYV crop adoption is district-level share of agricultural land with HYV crops. Instrument is district-level aquifer coverage interacted with a time dummy variable that switches on following the introduction of HYV crops to India in 1967. Analysis estimated by 2SLS. Standard errors adjusted for two-way clustering within districts and by region-year. * p < 0.1; ** p < 0.05; *** p < 0.01.
The magnitude of the IV estimates is substantially larger than that of the OLS estimates. This is likely due in part to measurement error attenuating the OLS estimates; consistent with this, the IV estimates show greater stability when a large number of fixed effects are introduced in columns (5) and (10) than do the OLS estimates. The impact on dominant party seat share is virtually unchanged, though the estimated impact on vote share shrinks very slightly. This suggests that the OLS results are likely biased downwards relative to the true effect of HYV crop adoption on dominant party decline. Another reason that the OLS estimates may be biased is if HYV crops were strategically distributed, particularly in later stages of the green revolution when agricultural policy became politicized. Finally, the IV estimates may also be larger because they represent the local effects of HYV crop adoption in a subpopulation, areas with aquifers, in which HYV crops were especially productive. The larger economic effects of HYV crops in this subpopulation, which are documented in later analyses, are consistent with larger political effects in these areas. Therefore, while the IV estimates provide evidence for a large, causal effect of HYV crop adoption on political turnover in India, the estimates may be larger than the “typical” or average effect of HYV crop adoption across all districts.
The validity of the IV estimates rests on several important assumptions, perhaps most importantly, the exclusion restriction. The difference-in-differences setup of the IV analysis, including both district and region-year fixed effects, rules out any time-invariant variables or region-specific time-trend threats to the exclusion restriction. Concerns about the exclusion restriction therefore take the form of the possibility that, counterfactually absent the introduction of HYV crops in 1967, within the same region, districts with greater aquifer coverage would have experienced a larger decline in Congress election performance than districts with less aquifer coverage.
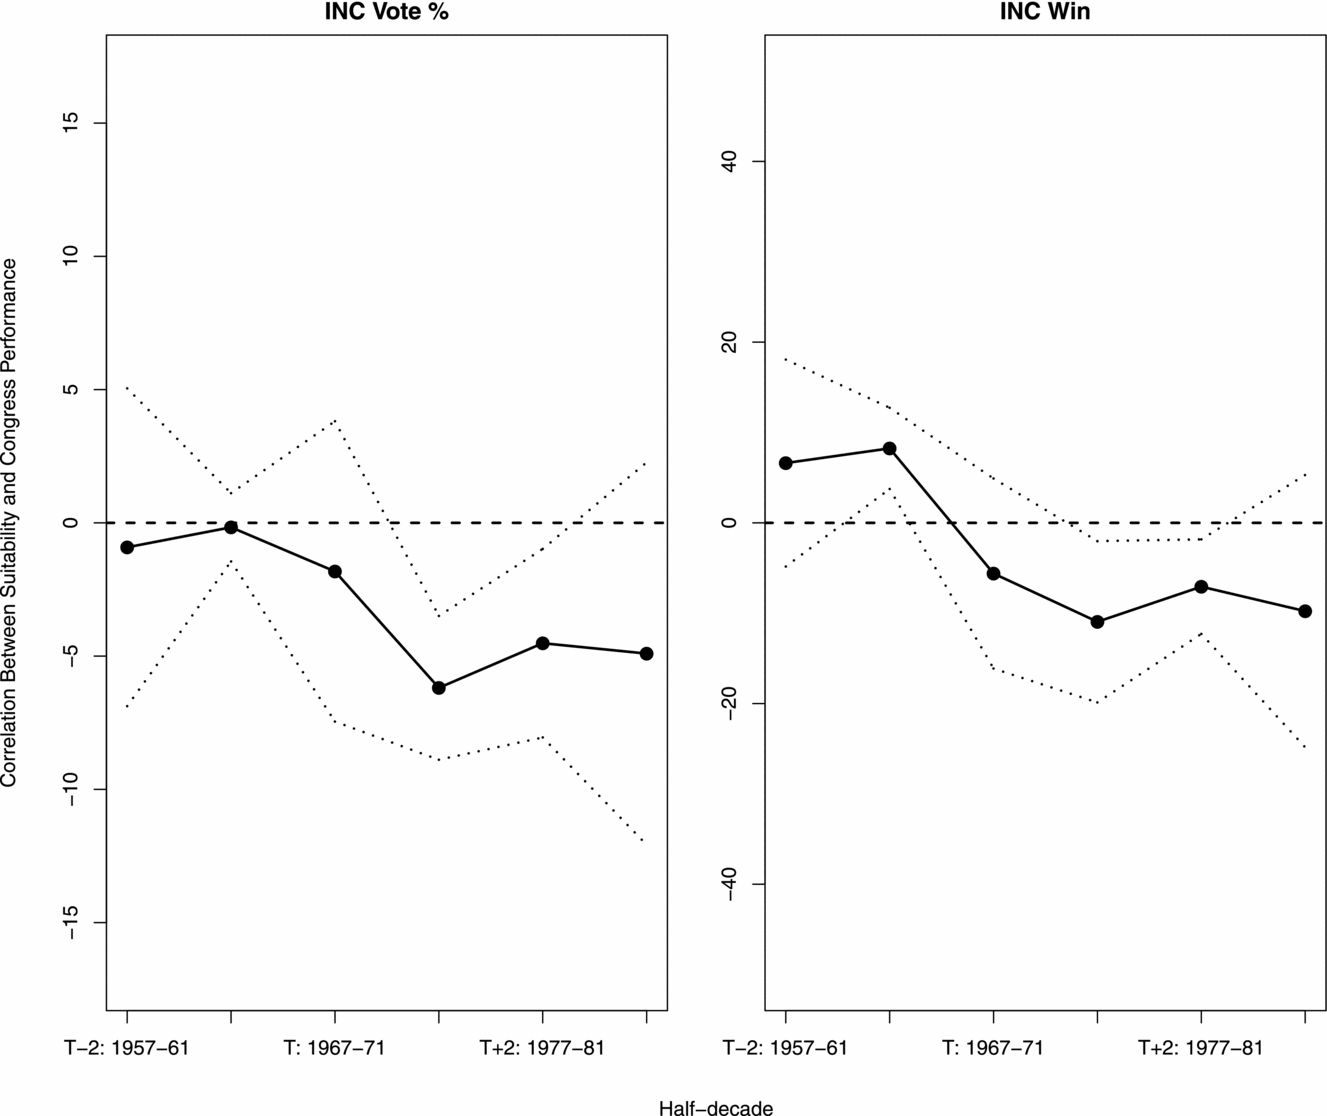
There are no obvious reasons to expect the exclusion restriction to have been violated. Aquifers are naturally occurring and not subject to social or political manipulation (Table A3 in the Online Appendix suggests that that aquifer coverage is uncorrelated with several pre-green revolution census variables). There were no major innovations during this period that disproportionately affected areas with aquifers independent of HYV crop cultivation. Though the exclusion restriction cannot be tested directly, one way to assess its plausibility is to identify the timing of the emergence of a negative reduced-form relationship between aquifer coverage and the Congress party's election performance. To do this, this paper estimates a regression of the form
 $$\begin{equation*}
{Y_{rdit}} = {\rm{\ }}{\tau _{rt}} + \sum_{k = 1} {\theta _k}Aquife{r_{rd}} \times I_t^k + {u_{rdit}},
\end{equation*}$$
where Yrdit is a measure of Congress party election performance, Ikt is a dummy variable representing a half-decade k (in the six half-decades between 1957 and 1987), and Aquiferrd is the district-level aquifer coverage measure. The analysis also controls for region-year fixed effects to nonparametrically absorb any region-year specific shocks and trends over time. Figure 4 displays the coefficients θk, representing the correlation between aquifer coverage and the dominant Congress party's election performance in the six half-decades between 1957 and 1987.
Testing the Parallel Trends Assumption

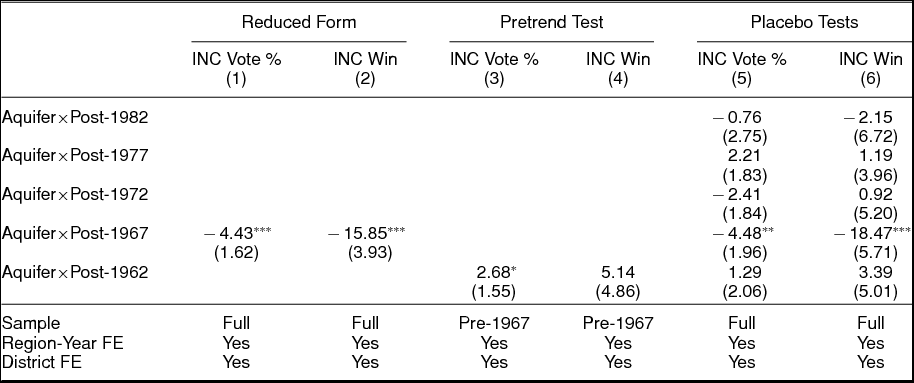
Prior to the green revolution, there is no detectable negative pretrend in areas with greater aquifer coverage in terms of support for the Congress party. This is formally tested in Table 4, columns (3) through (6), which indicate that, if a pretrend exists at all, it tends to be positive rather than negative. By contrast, a large, negative reduced form relationship between aquifer coverage and Congress election performance emerges precisely in the half-decade following the introduction of HYV crops to India in 1967. This is formally tested in columns (1) and (2) of Table 4, which represents the reduced form relationship between the instrument and the Congress party's election performance. As a final robustness test, columns (5) and (6) interact the aquifer coverage measure with half-decadal time dummy variables unrelated to when HYV crops were introduced to India. The small and statistically insignificant coefficients on these placebo interaction variables indicate that the dominant party lost support in districts with greater aquifer coverage specifically when the new crop technology was introduced and not at other, irrelevant times, providing further evidence in support of the exclusion restriction.
Reduced Form, Pretrend, and Placebo Tests

Notes: Unit of observation assembly constituency-year. The reduced form relationship is reported in columns (1) and (2). Tests for a pretreatment trend, with sample restricted to the pre-green revolution period, are reported in columns (3) and (4). The cross-sectional aquifer coverage measure is interacted with different time dummy variables in columns (5) and (6) to test for “placebo” effects in time periods unrelated to the introduction of HYV crops. Analysis estimated by OLS. Standard errors adjusted for two-way clustering within districts and by region-year. * p < 0.1; ** p < 0.05; *** p < 0.01
CHANNELS LINKING TECHNOLOGICAL CHANGE TO POLITICAL TURNOVER
This section sheds light on potential mechanisms with quantitative tests and qualitative case studies, concluding that new crop technology represented a potent force for political turnover because it impacted multiple complementary channels, providing excluded rural groups not only with wealth but also incentives to compete for subsidies and a focal point for rural collective action. Growing rural demand for political representation in districts impacted by the revolution provided the “demand-side” electoral conditions conducive to the “supply-side” emergence and success of agrarian opposition parties, which played a crucial role in the decline of the dominant Congress party.
DISAGGREGATING THE ELECTORAL EFFECTS OF HYV CROPS
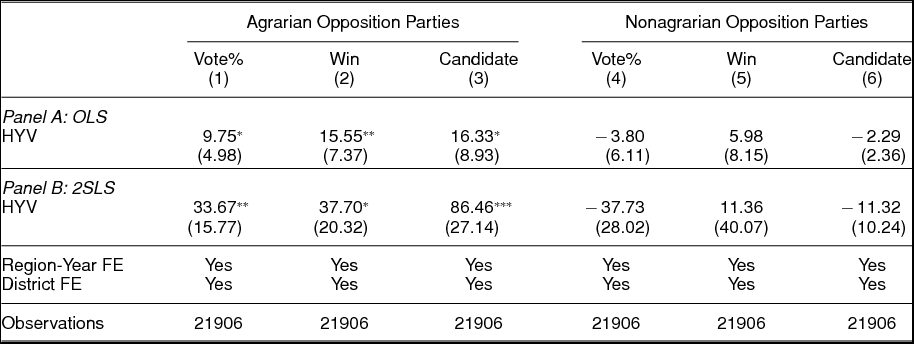
Unpacking which opposition parties benefited from the green revolution can shed light on the mechanisms through which HYV crops contributed to political turnover. If HYV crops simply provided rural groups with the wealth needed to mobilize politically, independent of traditional patron-client ties to the Congress party, then the green revolution's electoral benefits should have been distributed widely across a broad spectrum of opposition parties. This paper argues, by contrast, that because increasingly valuable agricultural subsidies provided the incentives for rural groups to mobilize politically, the green revolution specifically benefited newly emergent agrarian and regional opposition parties, which promised input subsidies, higher crop procurement prices, and greater descriptive representation of rural groups in distributive institutions. By contrast, more traditional opposition parties that predated the green revolution, for example, Hindu nationalist parties, parties on the left, as well as conservative and splinter parties, possessed no comparative advantage in winning the subsidy-seeking votes of the upwardly mobile middle peasantry.
To test these claims, Table 5 investigates the effects of HYV crop adoption on agrarian opposition versus nonagrarian opposition parties based on a coding of the top 20 opposition parties in the sample (see Table A5 in the Online Appendix for details). The coding of agrarian opposition parties includes two sets of parties. The Janata family of parties is one set which explicitly styled themselves as profarmer parties (see, e.g., Varshney Reference Varshney1998, 101). Another set are regional parties that adopted broadly based populist platforms but catered to farmers with promises of subsidies, such as cheap inputs, loan waivers, and free electricity and also promised descriptive representation of cultivating backward caste groups (see, e.g., Frankel (Reference Frankel1975, 43)) regarding the Akali Dal in Punjab, Harriss (Reference Harriss1982, 279) regarding the Dravidian parties in Tamil Nadu, and Kohli (Reference Kohli1990, 75) regarding the Telugu Desam Party in Andhra Pradesh).Footnote 8 Consistent with the argument, a notable feature of these agrarian and regional opposition parties is that they overwhelmingly emerged and earned votes and seats in the period following rather than preceding the green revolution (see Table A1 in the Online Appendix).
Effects of HYV Crops on Opposition Parties

Notes: Unit of observation assembly constituency-year for years 1957–1987. Panel A is OLS specification. Panel B instruments for HYV crop adoption with interaction term between a time dummy variable indicating the introduction of HYV crops in 1967 and district-level aquifer coverage: coefficient estimate 0.20 (standard error: 0.03). F-statistic on excluded instrument: 35.78. Explanatory variable: HYV crop adoption is district-level share of agricultural land planted with HYV crops. Standard errors adjusted for two-way clustering within districts and by region-year. * p < 0.1; ** p < 0.05; *** p < 0.01.
Columns (1) and (2) reveal that HYV crop adoption benefited agrarian opposition parties. The IV estimates suggest that a 10-percentage-point increase in the share of agricultural land planted with HYV crops increased the vote share of agrarian opposition parties by 3.4 percentage points and the seat share by 3.8 percentage points. Column (3) reveals that agrarian opposition parties succeeded in large part by strategically entering and fielding candidates in constituencies impacted by the green revolution. The IV estimate suggests that a 10-percentage-point increase in the share of agricultural land planted with HYV crops increased the probability of fielding an agrarian opposition party candidate by nearly 9 percentage points. Columns (4) through (6), by contrast, demonstrate that HYV crop adoption did not benefit the vote or seat share or candidature of other types of opposition parties.
CASE STUDY: TWO CRITICAL ELECTIONS
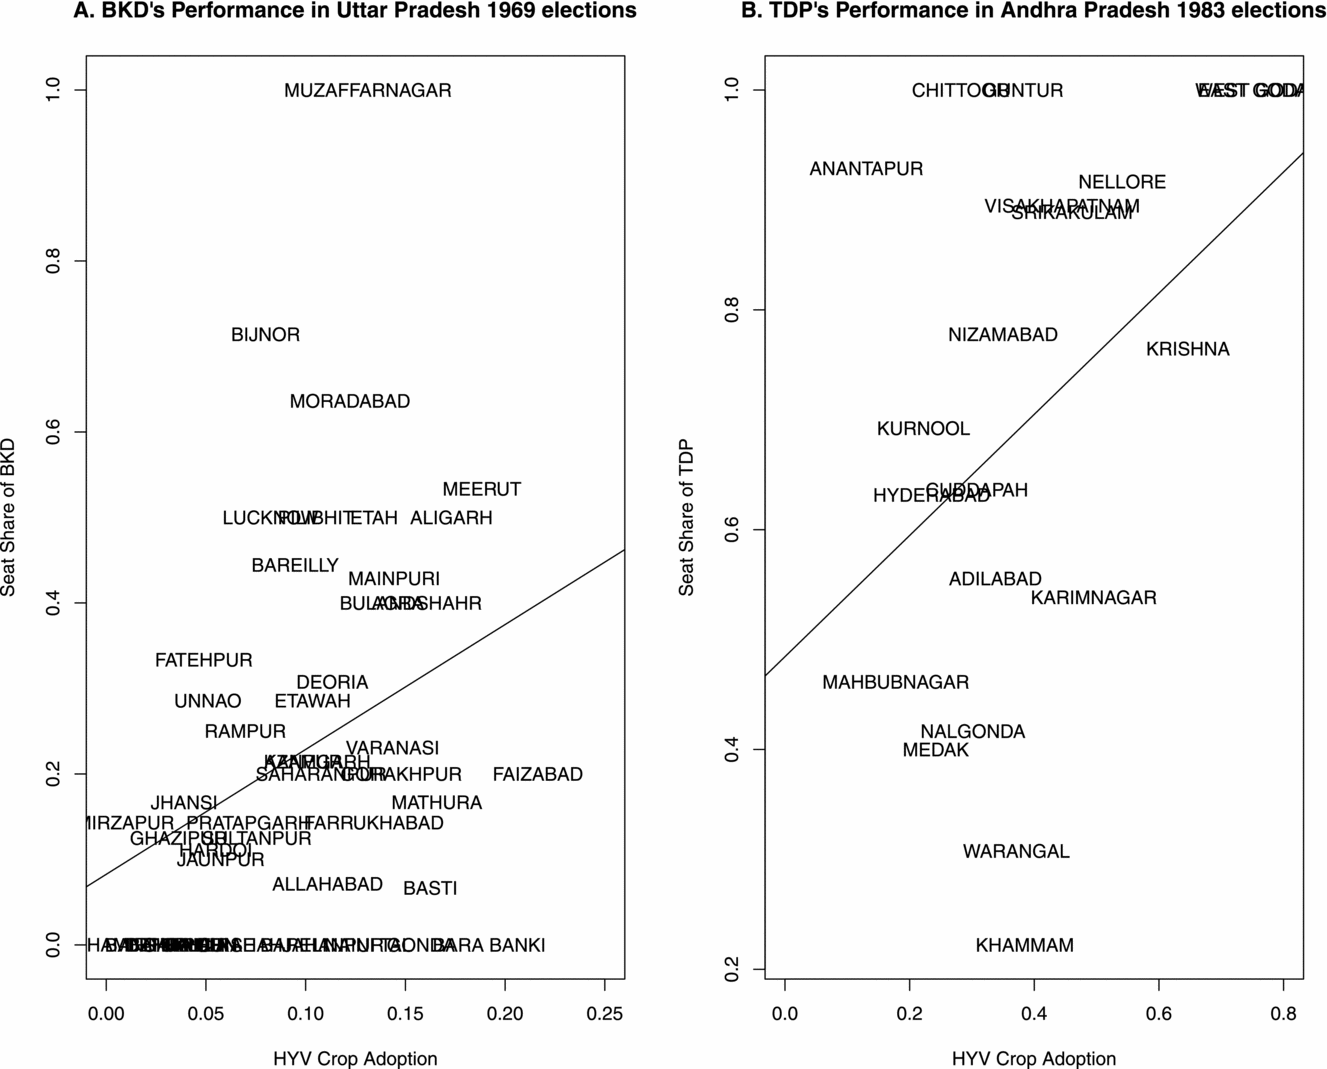
This section examines how agrarian and regional opposition parties benefited from changing electoral conditions in districts impacted by the green revolution in the case of two “critical elections.” In the 1969 elections in Uttar Pradesh, Bharatiya Kranti Dal (BKD), alongside a coalition of opposition parties, narrowly defeated the Congress party for the first time with the BKD winning 98 out of 425 seats. Then, in the 1983 elections in Andhra Pradesh, the Telugu Desam Party (TDP) defeated the Congress party on its own with a decisive majority with the TDP winning 201 out of 294 seats.
The BKD and TDP differ in many ways. Founded by the peasant organizer Charan Singh in 1967, the BKD explicitly positioned itself as a party of farmers; moreover, the BKD had national ambitions, evolving into the nationally competitive Janata Party. The TDP, by contrast, which was founded in 1982 by the Telugu film star NT Rama Rao, was more regionalist and populist in its appeals. Yet, both parties saw their early victories concentrated in districts where the green revolution occurred with the greatest intensity, as depicted in Figure 5. In Andhra Pradesh, the TDP's victories were concentrated in the coastal delta districts (such as West Godavari), which possessed the controlled irrigation needed to cultivate the new crops, thanks to colonial-era investments in canal irrigation. To this day, the British canal engineer Arthur Cotton, who built the Dowleswaram barrage on the Godavari river in 1850, remains a hero of the TDP, which built an official museum in his name in 1988 (Damodaran Reference Damodaran2008, 92). Similarly, in Uttar Pradesh, the BKD's early victories were concentrated in districts (such as Aligarh) located in the western Doab, a flat alluvial tract located between two rivers and rich in colonial-era canal irrigation, where the green revolution was concentrated.
Critical Elections

In both states, the green revolution mobilized rural groups that had been excluded from effective representation within the Congress party. In Uttar Pradesh, the Congress party was associated with a clientelist “coalition of extremes” (Brass Reference Brass1980), based on leadership drawn from urban elites and upper caste groups as well as support from the rural poor. The coalition of extremes tended to exclude the middle peasantry, including cultivating caste groups, notably the Jats, concentrated in western regions of the state that benefited from the green revolution and began to mobilize and demand greater political representation in its wake. Similarly, in Andhra Pradesh, the green revolution benefited politically excluded rural groups concentrated in the coastal regions of the state, in particular the Kammas, a locally dominant cultivating caste group that had traditionally vied for political influence in the state with the more numerous Reddys (Harrison Reference Harrison1956), who historically dominated the Congress party; of the nine Congress chief ministers until 1983, six had been Reddis, and none were Kammas (Kohli Reference Kohli1990, 79).
How exactly did the green revolution prompt political mobilization among the politically excluded rural groups that benefited from it? One potential channel is that the green revolution provided these excluded groups with the wealth needed to engage in political mobilization. Kohli (Reference Kohli1990, 67) indicates that one source of growing political clout on the part of Kammas during the 1980s was their greater entrepreneurialism and economic success, which itself stemmed more fundamentally from a positive wealth shock owing to the green revolution in the coastal districts. However, groups like the Jats and Kammas had been relatively prosperous for over a century, thanks to fortuitous colonial investments in irrigation (Reddy Reference Reddy, Frankel and Rao1989, 273; Stone Reference Stone2002, 287), as well as early postindependence land reforms that transferred land from traditional landlords to entrepreneurial cultivating castes. Research on local Congress politics in the 1960s reveals that despite their relative underrepresentation within the leadership and policies of the Congress party, the Jats and Kammas were active political participants in local District Congress Committees (see e.g., Weiner Reference Weiner1967, 142; Hasan Reference Hasan1989), suggesting that wealth was not a binding constraint on political mobilization per se by these groups.
While the green revolution further enriched politically excluded rural groups, the growing value of agricultural subsidies provided these groups with the incentives to rebel against the Congress party in favor of opposition parties that better represented their interests. In districts impacted by the green revolution, the cultivation of HYV crops intensified the usage of inputs by orders of magnitude. Consider, for example, two of the IADP districts selected for early dissemination of HYV crops: Aligarh in Uttar Pradesh and West Godavari in Andhra Pradesh. In Aligarh, between 1962 and 1968, fertilizer application in the district increased from 318 to 5,156 tons. Demand for cheap electricity for operating tube-wells was also accelerating, with the number of private tube-wells in the district increasing from 400 in 1962 to 14,602 in 1969 (Hasan Reference Hasan1989, 71). Similarly, in West Godavari, between 1962 to 1968, nitrogen-based fertilizer usage in the district increased from 34,463 tons to 94,086 tons (Ford Foundation Reference Foundation1969). Prices were also subject to downward pressure due to the increased productivity of HYV crops. In West Godavari, the real market price of rice, the main crop of the district, fell to 79 rupees per quintal in the year preceding the 1983 election from a high of 176 rupees in 1972. In Aligarh, the real market price of wheat, the main crop of the district, fell to 78 rupees per quintal in the year preceding the 1969 election, from a high of 109 rupees in 1966.
Among the BKD's and TDP's most prominent campaign promises were subsidies directed at the rural sector—which found receptive audiences among farmers increasingly dependent on inputs and facing falling prices in districts impacted by the green revolution. Along with promises of input subsidies, “remunerative pricing” provided a potent campaign issue through which the BKD mobilized cross-caste and cross-class rural collective action (see, e.g., Duncan, Reference Duncan1988). While the Jats were the driving force behind the BKD, they comprised just 9% of the statewide population; moreover, while the middle peasantry was numerous, on its own it rarely constituted a majority in any given district. Seeking to build a broad-based rural coalition, Charan Singh eschewed caste-based appeals, campaigning instead on promises to raise crop procurement prices, which appealed to middle peasants and small-scale farmers alike. The strategy was highly successful; for instance, according to the 1931 caste census, Jats made up just 7.9% of the population of Aligarh district (Hasan Reference Hasan1989, 43), yet five of the ten MLAs elected from the district in 1969 belonged to the BKD, plausibly through mobilization of a broad-based coalition of farmers. In Andhra Pradesh, a comparable broad-based appeal on the part of the TDP was promises of free electricity for farmers, upon which the middle peasantry as well as small-scale cultivators were increasingly dependent for irrigation. This was also successful in mobilizing a broad coalition of support. For instance, Kammas made up just 6.4% of the population of undivided Godavari, according to the 1921 caste census (Reddy Reference Reddy, Frankel and Rao1989, 270), yet West Godavari elected all of its legislators from the TDP in the 1983 elections.
Why did the Congress fail to coopt mobilizing rural groups? There were clear issues of credible commitment. From the beginning, the BKD was seen as the party of farmers, an image helped by Charan Singh's longstanding championship of rural issues (Varshney Reference Varshney1998, 102). Similarly, the TDP was widely seen as representing a coalition of Kammas and backward-cultivating caste groups in opposition to the Reddy raj (hegemony) of the Congress party in the state (Kohli Reference Kohli1990, 75), an image helped by NTR's Kamma background. By contrast, the Congress party could not easily shed its elitist image. Moreover, credibly changing platforms would have entailed changing descriptive representation in the party's local leadership, something that preexisting Congress party elites actively resisted. Both Andhra Pradesh and Uttar Pradesh were long-time centers of Congress party organizing,Footnote 9 a perverse result of which was elite entrenchment in long-established local party branches. In Aligarh, for example, longstanding rivalry between two upper caste factions for control of the local DCC blocked the entry of Jat and cultivating caste politicians into the local leadership of the party (Brass Reference Brass1965, 92–93; Hasan Reference Hasan1989, 123). In the 1969 assembly elections, 115 candidates from middle and backward castes were offered tickets through the BKD, as opposed to just 23 nominated by the Congress party (Hasan Reference Hasan1989, 128). Similarly, despite one electoral rejection of the Reddy “raj” in 1983, the Congress party in Andhra Pradesh remained dominated by Reddy politicians; in 1985, 46% of the Congress party's MLAs in Andhra Pradesh were Reddys, while the equivalent figure for the TDP was just 21% (Vaugier-Chatterjee Reference Vaugier-Chatterjee, Jaffrelot and Kumar2009, 296). The green revolution was particularly damaging to the Congress party, therefore, as a result of the organizational entrenchment of preexisting elites within the party, a common source of resistance to adaptation within established organizations (see, e.g., Kuran Reference Kuran1988).
ECONOMIC EFFECTS OF HYV CROPS
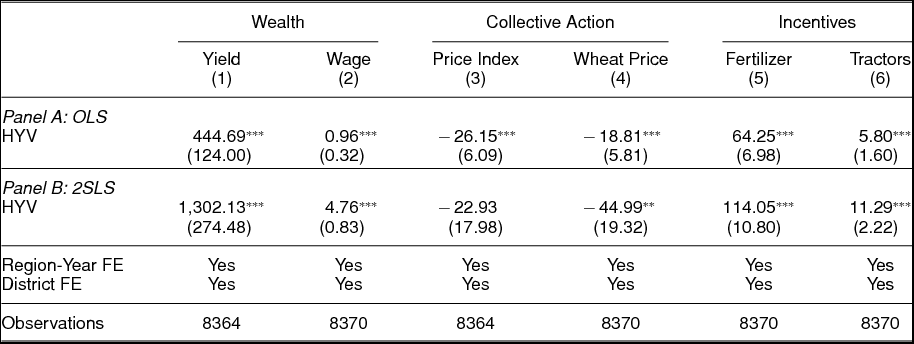
The case study evidence suggests that increasing wealth along with incentives to mobilize politically and growing rural collective identity played an important role in creating electoral conditions conducive to the success of agrarian opposition parties and the decline of the dominant party. To test these channels, Table 6 investigates the economic effects of HYV crops using district-level economic data, based on crop production, wage, price, and input usage data published annually by the government of India and compiled into a dataset by Sanghi et al. (Reference Sanghi, Kavi Kumar and McKinsey1998). Columns (1) and (2) reveal that, consistent with the wealth channel, HYV crop adoption improved agricultural productivity, measured in terms of real revenue per hectare for the top six crops, and agricultural labor wages. Columns (3) and (4) show that, consistent with the collective action channel, HYV crop adoption led to drops in real crop market prices, which provided a focal point for cross-class rural collective action. Columns (5) and (6) demonstrate that, consistent with the incentive channel, HYV crop adoption intensified the usage of inputs like fertilizer and tractors, increasing the value to farmers of government input subsidies.
Economic Effects of HYV Crops

Notes: Unit of observation district-year for years 1957–1987. Panel A is OLS specification. Panel B instruments for HYV crop adoption with interaction term between a time dummy variable indicating the introduction of HYV crops in 1967 and district-level aquifer coverage. First stage-coefficient on instrument: 0.20 (standard error: 0.02). F-statistic on excluded instrument: 82.77. Outcomes: Yield is measured in terms of rupees/hectare for the top six major crops. Wage is the daily wage of a male agricultural laborer in rupees/day. Price Index is a revenue weighted average of the price in rupees/quintal of the top six crops. Wheat price is price of wheat per quintal. Fertilizer usage is measured in terms of kilograms/hectare. Tractor usage is measured in terms of tractors/1000 hectares. All monetary amounts are deflated by state-specific consumer price indices to obtain real prices, base year 1973. Standard errors adjusted for two-way clustering within districts and by region-year. * p < 0.1; ** p < 0.05; *** p < 0.01.
The theoretical argument has emphasized that the wealth, incentive, and collective action channels are complementary—one of the reasons that HYV crops, by impacting multiple mutually reinforcing channels, represented a potent force for political turnover. However, it is possible to examine which channel HYV crops had the largest impact on by comparing relative effect magnitudes. According to the IV estimates, a 10-percentage-point increase in the share of land planted with HYV crops increased yields by 130 rupees/hectare (a 0.35 within-district standard deviation improvement) and reduced the real price of wheat by 4.5 rupees/quintal (a 0.17 within-district standard deviation reduction). The standardized effect of HYV crop adoption on input usage was much larger; an equivalent increase in HYV crop adoption is estimated to have increased the application of fertilizer by 11 kilograms/hectare (a 0.65 within-district standard deviation improvement) and by the usage of farm equipment by an additional 1.3 tractors per 1000 hectares (a 0.46 within-district standard deviation improvement). These comparisons suggest that incentives to compete for input subsidies were especially central to the long-run political effects of the green revolution.
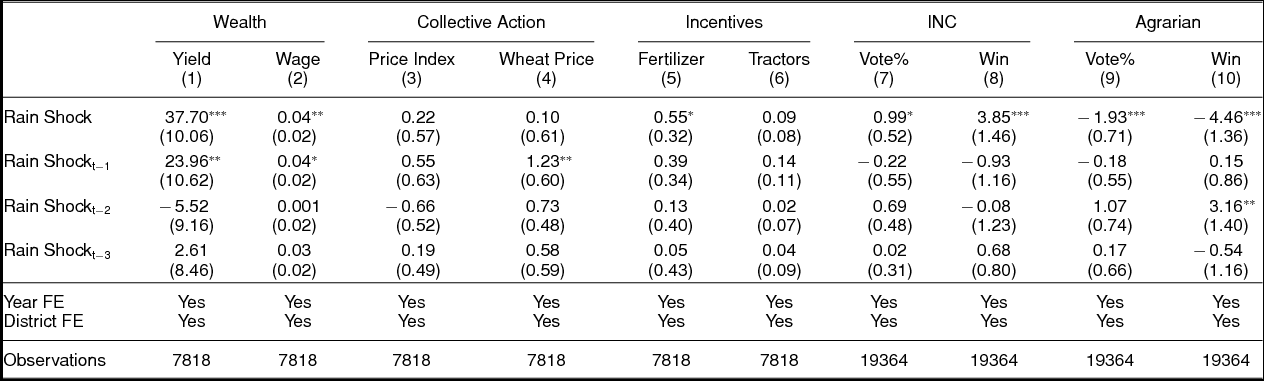
Another strategy to highlight the role of incentives to compete for subsidies as an “active ingredient” linking technological change to political turnover in the case of the green revolution is to compare against the electoral effects of positive rainfall shocks. Rainfall shocks are a widely utilized instrument for productivity in agrarian economies, and have been found in the Indian context to improve both agricultural productivity (benefiting landowners) and, relatedly, agricultural labor demand and wages (benefiting laborers) (see, e.g., Jayachandran Reference Jayachandran2006). Rainfall shocks therefore represent a broad-based positive shock to rural wealth; if wealth alone was a constraint on rural political mobilization, we ought to find that rainfall-based increases in rural wealth around election years weakened the urban-biased Congress party. However, rainfall shocks are, by definition, transitory and do not significantly impact the underlying structure of the agricultural sector. If long-term incentives to compete for subsidies and falling prices as a focal point additionally mattered in the case of the green revolution, as has been suggested, then rainfall shocks should not have contributed to political turnover.
Table 7 examines the effects of positive rainfall shocks, defined as the standardized deviation of a district's annual total rainfall from its long-run average,Footnote 10 on economic and political indicators. Columns (1) through (6) reveal that positive rainfall shocks substantially improved agricultural productivity and wages (a proxy for the wealth channel), but had no impact on crop prices (a proxy for the collective action channel), and only a small and transitory impact on the intensity of usage of inputs (a proxy for the incentives channel). Columns (7) and (8) reveal that, unlike HYV crops, positive rainfall shocks improved the performance of the dominant Congress party. Columns (9) and (10), by contrast, demonstrate that agrarian opposition parties suffered in election years with a positive rainfall shock. These results indicate that simple increases in rural wealth, without incentives for rural groups to seek power or capacity for collective action, did not weaken and may have even strengthened the incumbent as a result of improved voter satisfaction with the economy. Looking beyond the specific case at hand, this suggests that simple windfall wealth, absent complementary incentives to compete for political power or capacity for collective action of the type often resulting from technological change, is unlikely to contribute to political turnover.
Isolating Wealth Effects with Rainfall Shocks

Notes: Unit of observation district-year in columns 1–6 and assembly constituency-year in columns 7–10 for years 1957–1987. Explanatory variable: Rain shock measures the standardized deviation of rainfall from the long-term district mean. Standard errors adjusted for two-way clustering within districts and by region-year. Analysis estimated by OLS. * p < 0.1; ** p < 0.05; *** p < 0.01.
CONCLUSION
Important theoretical arguments suggest that technological change represents a form of political creative destruction that can weaken political incumbents and strengthen outsiders, leading to political turnover. Yet empirical evidence connecting technological change to political turnover is surprisingly scarce, possibly due to strategic blocking of destabilizing technologies by political elites afraid of democratization. To circumvent this observational challenge, this paper has exploited a large-scale historical natural experiment in which a new technology was introduced by an entrenched political party with little anticipation of its long-run political consequences in the case of the green revolution in India.
Integrating modernization, Marxist, and institutionalist theories of political change with a theoretical framework based on models of contests, this paper has argued that the introduction of high-yielding variety crops to India strengthened the incentives and capacity of a politically excluded group, in this case agricultural producers, to seek greater political representation. This contributed to support for agrarian and regional opposition parties and played a pivotal role in India's historical transition from single-party dominance to multiparty competition. Consistent with the argument, panel fixed effects and instrumental variable regression analyses suggest that the spread of HYV crops accounted for much of the historical decline of single-party dominance in India, one of the most important cases of democratization or democratic deepening of the twentieth century.
The findings support theories connecting technological change to a shifting balance of political power, with important implications for the political economy of growth and democratization. One of the most important recent findings in the study of democratization and political economy of development is that political elites and monopolies are remarkably persistent, whether in the form of dominant parties that manage to persist in spite of nominally competitive elections or societal elites that manage to intergenerationally monopolize positions of societal and political power. As this paper has demonstrated in the case of the green revolution, technological change represents an important force for disruption of long-run patterns of elite persistence, and, potentially, a contributor to democratization.
A central observational problem is that technological change is endogenous to political calculations; indeed, the central implication of existing theoretical models is that farsighted elites ought to strategically block or manage the threat posed by destabilizing new technologies. However, miscalculations or inability to block destabilizing innovations on the part of incumbent elites and parties, as well as natural experiments and identification strategies that leverage plausibly exogenous variation in preexisting suitability for new technologies, together with time variation arising from their discrete invention or introduction, provide valuable leverage for identifying the effects of political creative destruction.
Theoretically, it would be valuable to examine why some incumbent elites and parties are better at coping with disruptive technological change than others. Preliminary case study evidence in this paper has suggested that the entrenchment of preexisting elites within the Congress party may have inhibited it from strategically coopting rising rural groups outside of the party. This suggests that organizational entrenchment and flexibility are potentially important moderating factors affecting the linkage between technological change and political turnover, a hypothesis that deserves detailed exploration in future comparative research.
SUPPLEMENTARY MATERIAL
To view supplementary material for this article, please visit https://doi.org/10.1017/S000305541800031X.
Replication materials can be found on Dataverse at: https://doi.org/10.7910/DVN/PSGCJH.




Comments
No Comments have been published for this article.