INTRODUCTION
Holocene environmental and climatic conditions in the Neotropics essentially respond to Northern Hemisphere insolation and millennial-scale climate variability (Baker et al., Reference Baker, Seltzer, Fritz, Dunbar, Grove, Tapia, Scott, Rowe and Broda2001; Cruz et al., Reference Cruz, Vuille, Burns, Wang, Cheng, Werner, Edwards, Karmann, Auler and Nguyen2009). In Amazonia, variations in South American summer monsoon (SASM) rainfall controlled the hydroclimate variability and the expansion/regression phases of the rain forest (e.g., Braconnot et al., Reference Braconnot, Otto-Bliesner, Harrison, Joussaume, Peterchmitt, Abe-Ouchi and Crucifix2007; Mayle and Whitney, Reference Mayle, Whitney and Myster2012). Lake and speleothem records document a dry early to mid-Holocene (9000 to 5000 cal yr BP) with increasing fire activity in both western and eastern Amazonia (Mayle and Power, Reference Burn and Mayle2008; Cheng et al., Reference Cheng, Sinha, Cruz, Wang, Edwards, d'Horta, Ribas, Vuille, Stott and Auler2013). After 5000 cal yr BP on both the eastern and southern margins of the Amazon basin, the reexpansion of the rain forest is well observed in the pollen records and shows the extreme sensitivity of the rain forest to climate change (Absy et al., Reference Absy, Cleef, Fournier, Martin, Servant, Sifeddine and Ferreira da Silva1991; Mayle et al., Reference Mayle, Burdbridge and Killen2000). However, the timing of the return of the rain forest shows strong differences among records, and currently, no clear explanation is given for this regional asynchrony (Mayle et al., Reference Mayle, Burdbridge and Killen2000; Hermanovski et al., Reference Hermanowski, da Costa and Behling2012; Fontes et al., Reference Fontes, Moraes, Cohen, Alves, França, Pessenda, Franscisquini, Bendassolli, Macario and Mayle2017).
At a more regional scale, in the Beni region, on the southern Amazonian foreland basin, paleoecological records also show significant differences in the timing of the main vegetation shifts in the Holocene (Mayle et al., Reference Mayle, Burdbridge and Killen2000; Burbridge et al., Reference Burbridge, Mayle and Killeen2004; Mayle and Power, Reference Mayle and Power2008; Urrego et al., Reference Urrego, Bush, Silman, Niccum, De La Rosa, McMichael, Hagen and Palace2013; Carson et al., Reference Carson, Whitney, Mayle, Iriarte, Prümers, Soto and Watling2014; Brugger et al., Reference Brugger, Gobet, van Leeuwen, Ledru, Colombaroli, van der Knaap, Lombardo, Escobar-Torrez, Finsinger and Rodrigues2016). These differences in forest expansion are also observed in human activity. Pre-Columbian human presence was first documented during the early Holocene in northwestern Beni (Lombardo et al., Reference Lombardo, Denier, May, Rodrigues and Veit2013a; Hilbert et al., Reference Hilbert, Neves, Pugliese, Whitney, Shock, Veasey, Zimpel and Iriarte2017). Hunter-gatherers arrived in the Llanos de Moxos at least 10,600 cal yr BP ago, and their presence remained stable until 4000 cal yr BP (Lombardo et al., Reference Lombardo, Szabo, Capriles, May, Amelung, Hutterer, Lehndorff, Plotzki and Veit2013b), when an abrupt increase in the frequency of river floods and avulsions forced them to abandon the region (Lombardo et al., Reference Lombardo, Rodrigues and Veit2018). After a period of approximately 2000 years in the late Holocene, an eastern and southern expansion of human populations (Lombardo et al., Reference Lombardo, Denier, May, Rodrigues and Veit2013a, Reference Lombardo, Szabo, Capriles, May, Amelung, Hutterer, Lehndorff, Plotzki and Veit2013b; Prümers and Betancourt, Reference Prümers and Jaimes Betancourt2014; Rodrigues et al., Reference Rodrigues, Lombardo and Veit2018) was observed, and new records of human activity were detected in this region, with extensive transformation of the landscape and construction of hundreds of canals, causeways, monumental mounds, raised fields, and fish weirs (Denevan, Reference Denevan1996; Lombardo et al., Reference Lombardo, Canal-Beeby and Veit2011; Prümers and Betancourt, Reference Prümers and Jaimes Betancourt2014; Blatrix et al., Reference Blatrix, Roux, Béarez, Prestes-Carneiro, Amaya, Aramayo and Rodrigues2018; Rodrigues et al., Reference Rodrigues, Lombardo and Veit2018).
Thus, the Beni region is an ideal place to elucidate the southward time-transgressive progression of moister climate conditions linked to SASM activity and other possible drivers—notably human impacts—that affect environmental changes at both local and regional scales.
Here, we use pollen and charcoal records from a 2-m-long sediment core taken from a swamp located on the edge of Lake Ginebra, 40 km to the east of Lake Rogaguado. Our goals are to (1) characterize regional water level variability and landscape changes at Lake Ginebra, (2) compare the new data with the Lake Rogaguado pollen record (Brugger et al., Reference Brugger, Gobet, van Leeuwen, Ledru, Colombaroli, van der Knaap, Lombardo, Escobar-Torrez, Finsinger and Rodrigues2016), and (3) compare the timing and nature of long-term environmental changes in the wider region of the Amazon basin to discuss the major drivers for climate change in the southern Amazon basin.
STUDY SITE, CLIMATE, AND VEGETATION
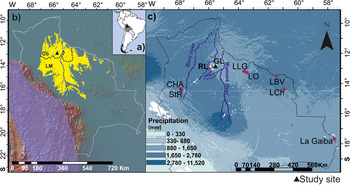
The Beni area comprises seasonally flooded savannas, wetlands with forest islands, gallery forests on poorly drained Quaternary fluvial deposits in central and southern Beni, and Cerrado, the neotropical woody savannas called Cerrado Beniano, on lateritic soils in northern Beni (Fig. 1a and b). The plains form a complex mosaic of humid seasonal forest in a matrix of seasonal savanna where annual flooding and fire are the most important ecological factors. Two main biogeographic regions characterize the Beni (Fig. 1b). The Cerrado Beniano is mainly located in northern Beni, a nonflooded upland, situated between 130 and 235 meters above sea level (m asl) with local relief of 2–6 m; and the Llanos de Moxos, in southern and central Beni, is a seasonally flooded alluvial plain (Navarro and Maldonado, Reference Navarro and Maldonado2011). Each biogeographic region has its own specific geologic and hydrologic characteristics (Hanagarth and Beck, Reference Hanagarth and Beck1996; Larrea-Alcázar et al., Reference Larrea-Álcazar, López, Quintanilla and Vargas2010; Langstroth, Reference Langstroth2011; Navarro and Maldonado, Reference Navarro and Maldonado2011; Rodrigues et al., Reference Rodrigues, Lombardo and Veit2018) mainly driven by tectonic processes, which caused the uplift of northern Beni and reduced the drainage in southern Beni (Lombardo, Reference Lombardo2014).
Maps showing the location of the study area (black triangle) (a); the delimitation (black dashed lines) of the two biogeographic regions of the Beni savanna (yellow area) defined by Navarro and Maldonado (Reference Navarro and Maldonado2011), the Andean Cordillera (purple), and the Bolivian borders (white line) (b); and mean annual precipitation with the location of the paleoecological study sites in the Beni region discussed in the text and the two main rivers Beni and Mámore (c). Cb, Cerrado Beniano; CHA, Lake Chalalán; GL, Ginebra Lake; LBV, Lake Bella Vista; LCh, Lake Chaplin; LLG, Lake La Granja; LM, Llanos de Moxos; LO, Lake Oricore; RL, Rogaguado Lake; StR, Lake Santa Rosa. (For interpretation of the references to color in this figure legend, the reader is referred to the web version of this article.)

The region is traversed by three major rivers, the Beni in the west, the Iténez (or Guaporé) in the east, and the Mamoré in the central region (Fig. 1c). These rivers converge to form the Madeira River, the main southern tributary of the Amazon River (Beck and Moraes, Reference Beck, Moraes, Davis, Heywood, Herrera-MacBryde, Villa-Lobos and Hamilton1997). The rivers flood each year in the rainy season between December and May as a result of high rainfall and snowmelt in the Andes (Fig. 1b and c). Floods cover from 50% to 60% of the land for a period of 4 to 10 months in many areas located farther away from the active rivers (Beck and Moraes, Reference Beck, Moraes, Davis, Heywood, Herrera-MacBryde, Villa-Lobos and Hamilton1997).
Lake Ginebra is located in the paleofloodplain of a former course of the Beni River (Fig. 1c; Lombardo, Reference Lombardo2014). The floodplain today covers 323 km2 where Lake Ginebra is one of the largest Bolivian lakes (Hanagarth, Reference Hanagarth1993). This lake, together with Lake Rogaguado, 35 km to the west, belong to a small group of lakes from the same neotectonic regime/system, denominated ria lakes, which according to Hanagarth (Reference Hanagarth1993) and Dumont and Fournier (Reference Dumont and Fournier1994) were formed by a tectonic uplift along the fault called Bala-Rogaguado that occurred in the central eastern part of the Beni Basin.
The tectonic origin of Lake Rogaguado was later confirmed by Lombardo (Reference Lombardo2014). The eastern and western sectors of the Lake Ginebra catchment drain upland lateritic soils that today are covered by Cerrado-like vegetation and seasonally flooded forest islands (Brugger et al., Reference Brugger, Gobet, van Leeuwen, Ledru, Colombaroli, van der Knaap, Lombardo, Escobar-Torrez, Finsinger and Rodrigues2016). The southern sector is characterized by swamps, which cover most of the ancient Beni floodplain, whereas mosaics of Cerrado and rain forest characterize the northern sector.
Climate
The climate in Beni is tropical, with a dry season during the austral winter and a wet season during the austral summer (Ronchail et al., Reference Ronchail, Bourrel, Cochonneau, Vauchel, Phillips, Castro, Guyot and de Oliveira2005). Mean annual precipitation is 1560 mm with a 7-month-long rainy season (October to April; Fig. 1c) caused by a combination of deep-cell convective activity over the Amazon basin attributable to the SASM and seasonal shifts in the Intertropical Convergence Zone (Ronchail et al., Reference Ronchail, Bourrel, Cochonneau, Vauchel, Phillips, Castro, Guyot and de Oliveira2005; Vuille et al., Reference Vuille, Burns, Taylor, Cruz, Bird, Abbott, Kanner, Cheng and Novello2012; Espinoza et al., Reference Espinoza, Ronchail, Lengaigne, Quispe, Silva, Bettolli, Avalos and Llacza2013). Rainfall ranges from 1300 mm per yr in eastern Beni to 2000 mm in the west.
The mean annual temperature is 26°C, and mean daily temperature frequently drops to 10°C for several days in a row when cold, dry Patagonian air masses (surazos) reach the area during the dry austral winter (June–August; Espinoza et al., Reference Espinoza, Ronchail, Lengaigne, Quispe, Silva, Bettolli, Avalos and Llacza2013). A study of an extreme flooding event in 2014 revealed that anomalously warm conditions in the subtropical South Atlantic resulted in higher than normal rainfall and caused severe flooding in southeastern Amazonia (Espinoza et al., Reference Espinoza, Marengo, Ronchail, Molina, Noriega and Guyot2014; Ovando et al., Reference Ovando, Tomasella, Rodrigues, Martinez, Siqueira-Junior, Pinto, Passy, Vauchel, Noriega and von Randow2016). Between September 2013 and February 2014, the region located in the southwestern part of the Llanos de Moxos was affected by severe flooding, whereas more to the north, in northern central Beni, flooding was less severe (Revilla-Romero et al., Reference Revilla-Romero, Hirpa, Pozo, Salamon, Brakenridge, Pappenberger and De Groeve2015; Ovando et al., Reference Ovando, Tomasella, Rodrigues, Martinez, Siqueira-Junior, Pinto, Passy, Vauchel, Noriega and von Randow2016) highlighting the spatial difference between the two biogeographic regions.
Vegetation
Cerrado Beniano and Llanos de Moxos are located, respectively, in the northern and southern regions and represent the two main ecoregions of central Beni, which include different vegetation physiognomies ranging from gallery forest to wetlands (Fig. 1b). The likelihood of flooding differs in the tropical savannas in the two regions. The Cerrado Beniano has drained soils, and its more heterogeneous relief protects the zone from major flood events. By contrast, the Llanos de Moxos is exposed to major floods because it is relatively flat with an average slope of less than 10 cm/km. These hydrologic and geologic characteristics also mean that the two ecoregions differ in floristic composition (Larrea-Alcazár et al., Reference Larrea-Álcazar, López, Quintanilla and Vargas2010).
The landscape of the Cerrado Beniano is mainly dominated by Cerrado, terra firme gallery forest, forest islands, termite mounds, flooded Várzea forest, and seasonally inundated savanna ecosystems (Brugger et al., Reference Brugger, Gobet, van Leeuwen, Ledru, Colombaroli, van der Knaap, Lombardo, Escobar-Torrez, Finsinger and Rodrigues2016). More to the south, the Llanos de Moxos is dominated by seasonally inundated savanna, inundated Varzéa forest, terra firme gallery forest, and forest with few termite mounds. A vegetation survey of our study area was performed in September 2013, and the results are reported in Supplementary Table 1. The landscape of the region of Lake Ginebra is characterized by a mixture of both riparian and terra firme rain forest communities forming mosaics of forest in an upland Cerrado.
Modern pollen rain
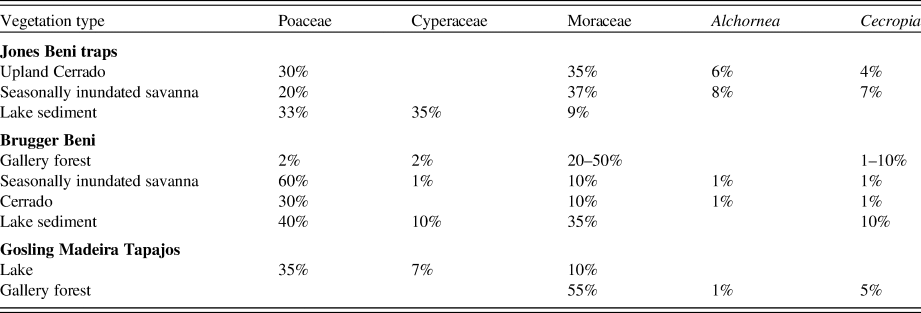
Based on traps, samples of surface soil and of lake surface sediment, upland Cerrado, seasonally inundated savanna, and gallery forests were identified from their pollen assemblages, mainly involving changes in the abundance of Moraceae, Cecropia, Poaceae, Cyperaceae, and Alchornea pollen (Table 1). The low frequencies or absence of pollen indicators of the Cerrado and the high frequency of Moraceae pollen characterize the modern palynoflora of Beni region. High Moraceae frequencies in the Cerrado were attributed to wind transport of pollen originating from a high pollen producer in the gallery forest and/or the mosaics of evergreen terra firme forest that characterize the north of the Bolivian Amazon (Gosling et al., Reference Gosling, Mayle, Tate and Killeen2005, Reference Gosling, Mayle, Tate and Killeen2009; Burn and Mayle, Reference Burn and Mayle2008; Jones et al., Reference Jones, Mayle, Pennington and Killeen2011; Brugger et al., Reference Brugger, Gobet, van Leeuwen, Ledru, Colombaroli, van der Knaap, Lombardo, Escobar-Torrez, Finsinger and Rodrigues2016).
Modern pollen signature of the main ecosystems in Beni (from Gosling et al., Reference Gosling, Mayle, Tate and Killeen2005; Jones et al., Reference Jones, Mayle, Pennington and Killeen2011; Brugger et al., Reference Brugger, Gobet, van Leeuwen, Ledru, Colombaroli, van der Knaap, Lombardo, Escobar-Torrez, Finsinger and Rodrigues2016).

METHODS
A 2-m-long sediment core Ginebra (Gin) was collected in September 2013 with a Russian-type corer (100 cm long, 5 cm in diameter) from a swamp located ~50 m from the shore of Lake Ginebra (close to 12°58'22.3536’’S, 65°34'34.2264’’W; at 145 m asl). The coring site is located just above the level of the lake, and the current depth of the lake is 4 m. The core was first described and sliced into centimeter-long sections during fieldwork. The samples were sent to the Institut des Sciences de l'Evolution Montpellier (ISEM) in Montpellier and stored at 4°C until further processing.
Chronology
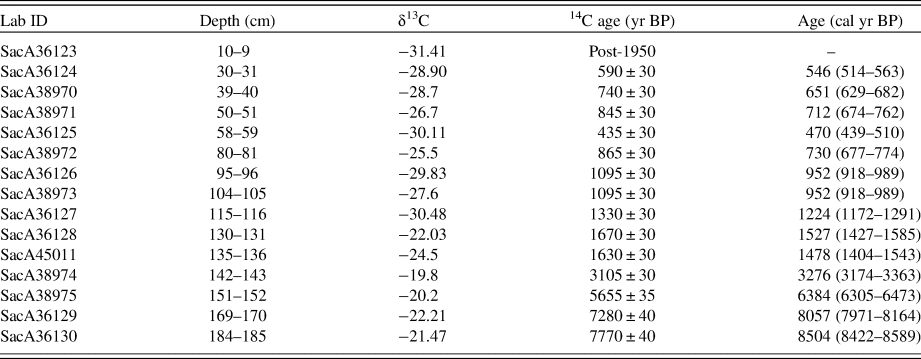
The chronology of the sediment core is based on 15 radiocarbon accelerator mass spectrometry dates from bulk samples. All the samples for radiocarbon dating were analyzed at the French Laboratoire de Mesure du Carbone 14 (LMC14)–UMS 2572 (CEA/DSM, CNRS, IRD, IRSN, dates from bulk samples). We used “Bacon” software (Blaauw and Christen, Reference Blaauw and Christen2011) to convert 14C ages into calibrated years before present (cal yr BP) based on the SHCal13 data set (Hoog et al., Reference Hogg, Hua, Blackwell, Niu, Buck, Guilderson, Heaton, Palmer, Reimer, Reimer, Turney and Zimmerman2013; Reimer et al., Reference Reimer, Bard, Bayliss, Beck, Blackwell, Bronk Ramsey, Buck, Cheng, Edwards and Friedrich2013) (Table 2) and to build the depth-age model. The age-depth relationship was modeled by Bayesian statistics (Blaauw and Christen, Reference Blaauw and Christen2011).
Radiocarbon ages of sediment core Gin (Ginebra). 14C, Calibrated ages were obtained from Calib 7.0 (Reimer et al., Reference Reimer, Bard, Bayliss, Beck, Blackwell, Bronk Ramsey, Buck, Cheng, Edwards and Friedrich2013), the value with two standard deviations (2σ).

Loss on ignition
To characterize the changes in the abundance of organic matter throughout the profile, 26 samples were weighed and dried in an oven at 105°C for 24 h, and then heated at 550°C for 4 h in a muffle furnace, following Heiri et al. (Reference Heiri, Lotter and Lemcke2001). The abundance of organic matter was calculated as percentage of dry weight (% dw).
Pollen and charcoal analysis
Pollen analyses were performed on 97 samples of 1 cm3 collected at 2-cm intervals. Samples were processed at ISEM. We used Lycopodium spikes to estimate pollen concentrations (Stockmarr, Reference Stockmarr1971). Samples collected between 1 and 150 cm in depth were pretreated with 10% KOH before gravity separation with ZnCl2 (Kummel and Raup, Reference Kummel and Raup1965). The clayey samples taken between 150 and 200 cm in depth were treated with 70% HF and acetolysis, following the method of Faegri and Iversen (Reference Faegri and Iversen1989). Pollen residues were mounted in glycerol on microscope slides. Pollen was identified at 400× and 1000× magnification. At least 300 terrestrial grains were counted per sample except in samples taken between 135 and 199 cm in depth where, because of low pollen concentrations, counts were substantially lower (100 terrestrial pollen grains). Pollen grains and spores were identified using the reference pollen collection belonging to the Herbario Nacional de Bolivia–La Paz, Bolivia and several pollen atlases (Heusser, Reference Heusser1971; Roubik and Moreno, Reference Roubik and Moreno1991; Colinvaux et al., Reference Colinvaux, de Oliveira and Moreno Patiño1999; Gosling et al., Reference Gosling, Mayle, Tate and Killeen2005; Cassino and Meyer, Reference Cassino and Meyer2011; Leal et al., Reference Leal, Berrío, Raimúndez and Bilbao2011; Montoya et al., Reference Montoya, Rull and Vegas-Vilarrúbia2012). Pollen and spore abundances are reported as percentages of the total pollen sum with the exclusion of water-related taxa (e.g., Nymphaea, Anthurium, and Cyperaceae).
To differentiate Poaceae pollen grains, following Radaeski et al. (Reference Radaeski, Bauermann and Pereira2016), we separated them into three different size classes; small (<20 µm), medium (between 20 and 46 µm), and large (>46 µm). According to that study, smaller grains indicate grassland dominance linked to dry conditions, while cultivated plants (e.g., Zea mays) produce the largest pollen grains (Radaeski and Bauermann, Reference Radaeski and Bauermann2017). Gosling et al. (Reference Gosling, Mayle, Tate and Killeen2009) suggest that Poaceae frequencies of less than 20% are common in the Cerrado compared with their higher frequencies in lake environments (30–50%; Table1). At Ginebra, we also observed that Poaceae pollen grains were generally associated with Cyperaceae and other water-level related, semiaquatic, and aquatic taxa.
Pollen from Moraceae and Urticaceae were generally considered to represent similar pollen types and were consequently grouped as Moraceae or Urticaceae. However, when we tried to separate the different types in the Moraceae group, we were able to distinguish different genera (Burn and Mayle, Reference Burn and Mayle2008). We then classified the pollen taxa in five ecological groups, which represented the different types of vegetation found in the study area today: gallery forest (Araceae, Annonaceae, Alchornea, Cecropia, and Psychotria), Cerrado (Ilex and Mimosa), seasonally flooded savanna (Poaceae, Cyperaceae, and Eclipta), flooded Várzea forest (Mauritia flexuosa), and water-level related ecosystems (Cyperaceae, Anthurium, Nymphaea, Sagittaria, and Syngonium) in accordance with Brugger et al. (Reference Brugger, Gobet, van Leeuwen, Ledru, Colombaroli, van der Knaap, Lombardo, Escobar-Torrez, Finsinger and Rodrigues2016), Jones et al. (Reference Jones, Mayle, Pennington and Killeen2011), and Marchant et al. (Reference Marchant, Cleef, Harrison, Hooghiemstra, Markgraf, van Boxel and Ager2002; Supplementary Table 2).
The pollen record was plotted using “psimpoll” (Bennett, Reference Bennett1994) and divided into zones based on constrained cluster analysis by sum of squares (CONISS) with pollen taxa ≥1% (Grimm, Reference Grimm1987; Bennett, Reference Bennett1996).
Macroscopic charcoal particles were analyzed from contiguous 1-cm3 samples taken at a depth of between 23 and 199 cm. The top 23 cm of the core was not sampled for macrocharcoal analysis because only small amounts of sediment were recovered from this part of the core attributable to a dearth of compacted material and abundant plant fibers. For these samples, we observed the presence of microcharcoal particles in the pollen slides. Macroscopic charcoal samples were treated with 10% KOH and 2.6% NaOCl solution, sieved at 160 µm, washed with distilled water onto a white porcelain evaporating dish, and analyzed at 60× magnification under a stereomicroscope, following Finsinger et al. (Reference Finsinger, Kelly, Fevre and Magyari2014). Charcoal abundances are expressed as charcoal accumulate rate (CHAR; mm2/yr).
RESULTS AND INTERPRETATION
Sediment composition and chronology
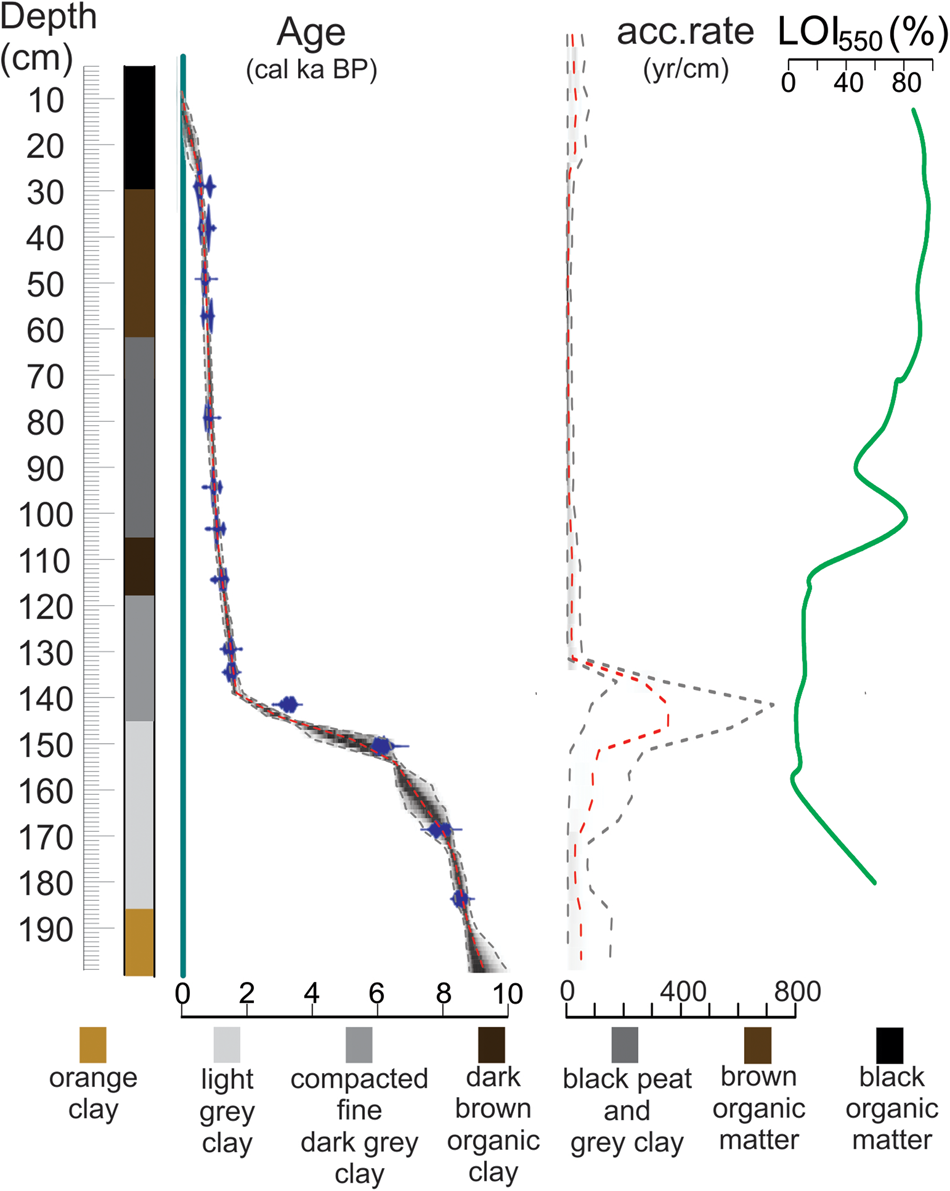
Based on the visual description, and on the loss-on-ignition (LOI) analysis, we defined seven sedimentologic units (Fig. 2). The chronology was constrained at the bottom (185 cm) by a date of 8500 cal yr BP (Table 2). In unit 1, between 200 and 186 cm depth, the sediment was composed of orange clay; this interval represented ages older than 8640 cal yr BP, and the sedimentation rate was 43 yr/cm. Both observations infer the absence of a lake on the coring site (Fig. 2).
(color online) From left to right, representation of the lithology, age-depth model, sediment-accumulation rate, and LOI550 curve of core Gin (Ginebra). LOI, loss on ignition.

Between 186 and 146 cm of depth, from 8640 to 3360 cal yr BP, unit 2 was characterized by light-gray clay and two distinct sedimentologic intervals. The sedimentation rate increased first between 170 and 156 cm (8040 to 6625 cal yr BP) to 97 yr/cm and second between 155 and 146 cm (6525 to 3360 cal yr BP), changing sharply to 300 yr/cm. This abrupt change in sedimentation rate was also represented by LOI values, decreasing from 60% dw to 6% dw between the base and the top of unit 2. The simultaneous change in sediment composition, LOI, and the decrease of the sedimentation rate suggest that the lake margin moved close to the coring site because of an increase in water input inducing currents and resulting in sediment loss and change in sediment deposition since 6525 cal yr BP.
Compacted fine dark-gray clay comprised unit 3 observed between 146 and 118 cm, dated from 3360 to 1245 cal yr BP. At the beginning of this sedimentologic unit, the sedimentation rate and the LOI showed the same value as in the previous zone, 300 yr/cm and ~ 6% dw, respectively, until 141 cm (1873 cal yr BP). From 140 cm depth (1610 cal yr BP), an increase in sedimentation (~16 yr/cm) and LOI values (10% dw) was observed until the end of unit 3. Sediment composition suggests that the lake was present during the whole interval of time, but the change in sedimentation rate and LOI point to a decrease in lake depth because of the increase in allochthonous sediment deposition caused by a reduction in water flow into the coring site, thus triggering the development of the swamp in the subsequent unit.
The fourth sedimentologic unit was composed of dark-brown organic clay between 118 and 105 cm, 1245 to 1030 cal yr BP. The sedimentation rate was ~15 yr/cm, and LOI showed an increase in organic matter from 10% to 25% dw. This unit clearly shows the presence of the lake, but the increase in organic matter production could be related to a decrease of the water column when the swamp started to grow.
In sedimentologic unit 5, between 105 and 61 cm depth, dated from 1030 to 740 cal yr BP, the sediment was composed of gray clay and black peat. The sedimentation rate was ~7 yr/cm, with a decrease of the LOI values from 80% to 40% dw between 100 and 90 cm, 995 to 925 cal yr BP, followed by an increase to 90% dw until the end of the unit. The increase in organic matter suggests the establishment of the swamp with an expansion of the vegetation that could favor the increase in sedimentation rate.
In unit 6, from 61 to 30 cm depth, 740 to 540 cal yr BP, the sediment was characterized by brown organic matter with a sedimentation rate of ~7 yr/cm and LOI 90–96% dw pointing to the full development of the swamp.
In unit 7, from 30 cm to the top, representing the last 540 years, the sediment was characterized by black organic matter with stable LOI values (94–96% dw). The sedimentation rate was highly variable, with 25 yr/cm at the beginning of the unit, decreasing to 40 yr/cm at 23 cm depth, increasing to 30 yr/cm (225 cal yr BP) at 20 cm depth, and finally reaching 20 yr/cm at 15 cm depth (65 cal yr BP). The decrease in the sedimentation rate and the degradation of the organic matter could be related to lake incursion into the swamp area until a period of more stability after 65 cal yr BP.
Pollen and charcoal analysis
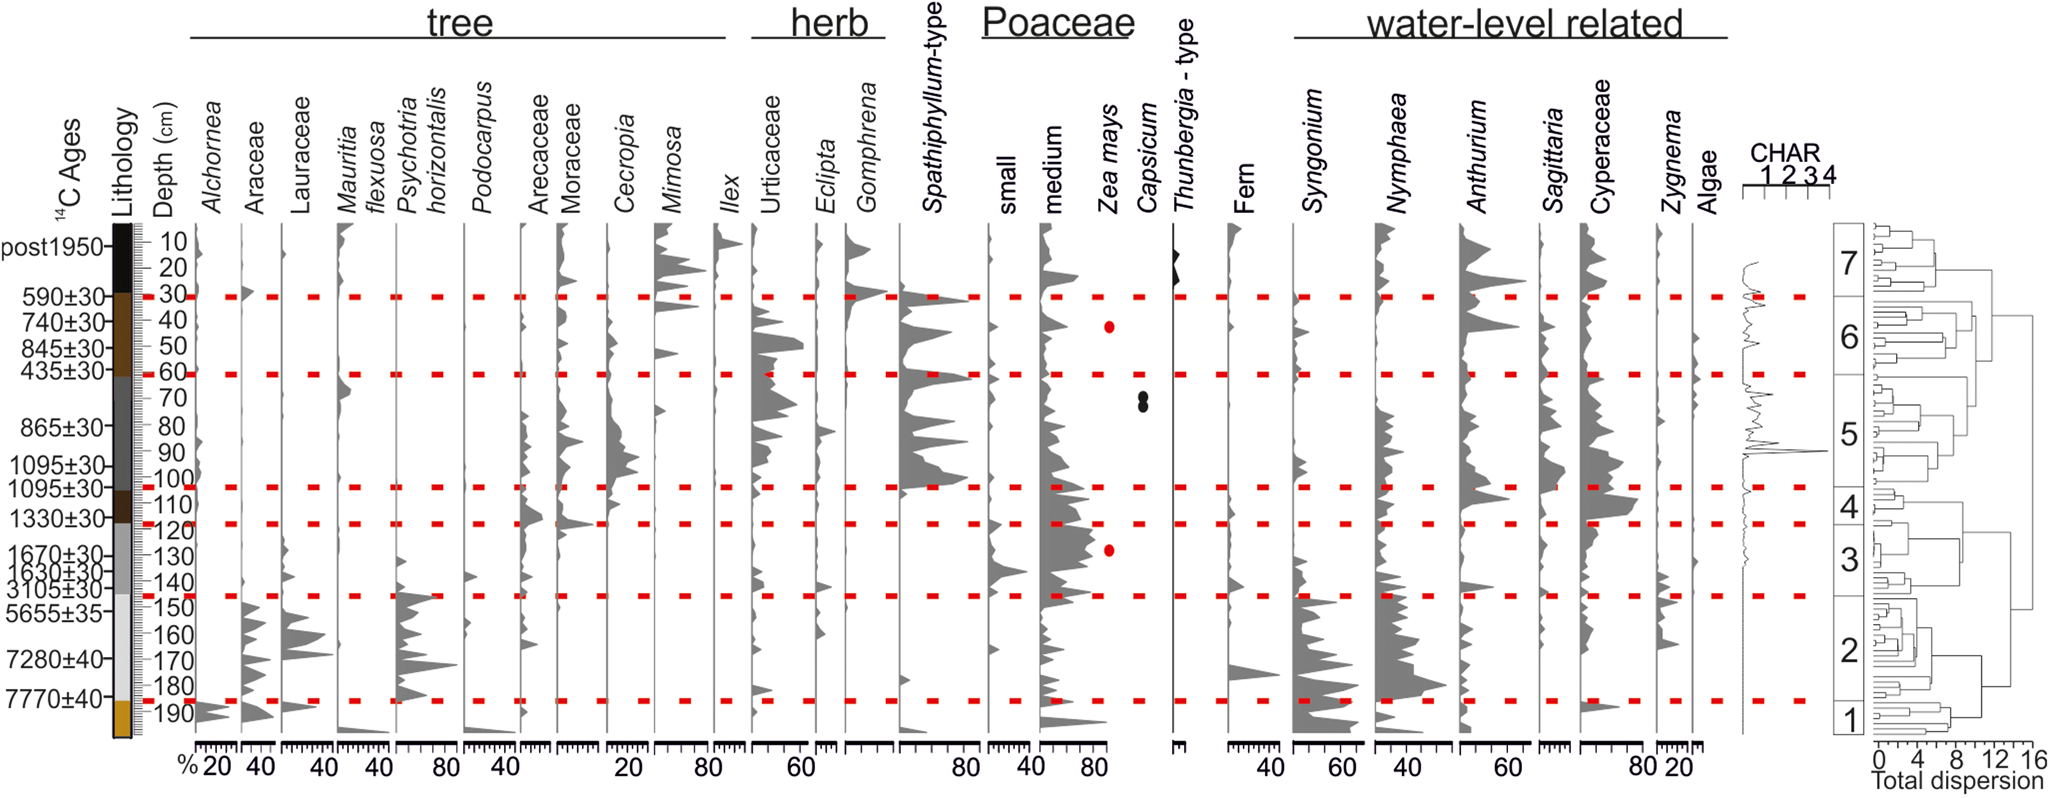
According to the results of the cluster analysis, the pollen diagram was divided into seven pollen assemblage zones—named Gin1 to Gin7—that matched the seven sedimentologic units described previously (Fig. 3). Total pollen concentrations ranged from 700 to 394,027 grains/cm3. A total of 176 pollen types were identified in the 97 samples.
(color online) Main pollen percentage diagram of core Gin (Ginebra). The diagram shows selected taxa representing arboreal pollen, nonarboreal pollen, cultivated taxa (Zea mays, Capsicum Solanaceae, and Thunbergia Acanthaceae), fern spores, water-related taxa, algae, and charcoal concentration. The diagram is divided into seven pollen zones based on CONISS (constrained cluster analysis by sum of squares). All pollen, spores, and algae curves show percentages of the terrestrial pollen sum. Black dots indicate single pollen counts.

The base of the sequence (Gin1: 200–186 cm, >8645 cal yr BP, 7 samples) was characterized by a mixture of Andean taxon Podocarpus (40%), cold-intolerant taxon Mauritia (40%), water-level-related taxon Nymphaea (which increased from 25% to 75% to the end of the zone), and Poaceae (between 50% and 100%). Alchornea (Euphorbiaceae) increased from 6% to 33% to the end of the zone, Desmopsis (Annonaceae) decreased from 50% to 18%, Lauraceae was 33%, the herb Dieffenbachia (Araceae) was between 33% and 66%, and the shrub Psychotria (Rubiaceae) (50%) was represented at the end of the zone. Pollen concentrations were very low (from 700 to 2565 grains/cm3). No charcoal particles were observed. The lithology was orange clay, which is generally caused by oxidizing conditions. We interpreted the high ecological heterogeneity of the pollen assemblages in this part of the record as an indication of reworked sediments that preceded the undisturbed sediment deposition above.
Between 8645 and 3360 cal yr BP (Gin2: 186–146 cm, 20 samples), a moisture-demanding gallery forest (37% to 100% of the pollen sum) dominated by Psychotria (14% to 100%) with less abundant contributions of Desmopsis (Annonaceae) (8–28%), Nectandra (23–45%) (Lauraceae), Ocotea (1–4%) (Lauraceae), Persea (2–26%) (Lauraceae), and Araceae (Dieffenbachia [29%], Monstera [5–25%], and Philodendron [8–51%]) was observed. Low percentages of medium-sized Poaceae increased at the end of the zone (40%) together with Begonia (<1%) (Begoniaceae) and Calathea (<1%) (Maranthaceae), suggesting the progressive reduction of forest cover toward the end of the zone. All through Gin2, in agreement with the presence of a gallery forest, water-related taxa were frequent, mainly the semiaquatic taxon Syngonium (83–10%) and the aquatic taxon Nymphaea (19–92%), the latter generally found near the lakeshore in a minimum of 1 m water depth. Pollen concentrations increased and were higher than in the previous zone (911 to 59,263 grains/cm3), indicating better preservation in less oxidizing conditions. No charcoal particles were observed in this zone.
A shift toward less forest cover occurred around 3360 cal yr BP (Gin3: 146–118 cm, 3360–1245 cal yr BP, 14 samples), when pollen assemblages were dominated by medium (<70%) and small Poaceae (<20%), more consistently from about 1610 cal yr BP, and the presence of a single, large Poaceae (87 µm), likely Zea mays at 129 cm (1440 cal yr BP) (Herrera and Urrego, Reference Herrera and Urrego1996), points to cultivation practices in the area. The gallery forest almost collapsed (2–25%), and Ocotea (1–4%) (Lauraceae), Cephalis (10%) (Rubiaceae), Psychotria (10–20%), Monstera (10%) (Araceae), and Tournefortia (1%) (Boraginaceae) were among the main taxa. The low percentages (1–14%) of Cerrado indicator taxa Eclipta (1–14%) (Asteraceae), Machaerium (1%) (Fabaceae pap.), Arecaceae (Geonoma 14%), and Moraceae (dominated by Ficus [35%] and Castilla [10%]) suggest the onset of the expansion of Cerrado vegetation.
In Gin3, the frequency of semiaquatic taxa (Anthurium [1–40%] and Sygnonium [1–20%]), aquatic taxa (Nymphaea [10–40%]), and algae (P. rubina [1–10%]) decreased, and the progressive increase in Cyperaceae (Cyperus) from 9% to 20% at the end of the zone revealed major changes in local hydrologic conditions, also since 1610 cal yr BP. Pollen concentrations increased to 3752–139,979 grains/cm3 from the beginning to the end of the zone, suggesting better pollen preservation and increased anoxic conditions because of lake expansion and the start of the development of a swamp at the end of the zone. Low macrocharcoal influxes (CHAR; < 0.3 mm2/cm2/yr) were observed all through this zone. The seasonally flooded savanna with palms characterizes an open landscape with relics of gallery forest tree taxa. Human impact was assumed based on finding maize pollen at approximately 1450 cal yr BP. The high percentages of Moraceae were mainly represented by Ficus, suggesting some tree grew at the boundaries of the lake-swamp (Ledru, Reference Ledru2001).
Gin4 (118–105 cm, 1245–1030 cal yr BP, 7 samples), was characterized by a slight decrease in Poaceae (by <50% in the case of medium and small Poaceae) and a reduction of 2–10% in Moraceae (Cecropia, Ficus, and Castilla). Palm (Geonoma) taxa increased by ~20%, Nymphaea frequencies decreased by less than 24%, and Anthurium increased to 61% at the end of the zone. Cyperaceae was dominated by Fimbristylis (5–73%). Macrocharcoal influx was limited to <0.3 mm2/cm2/yr. Pollen concentrations were high (15,474–227,243 grains/cm3). The disappearance of the gallery forest, the reduction in aquatic taxa, and the increase in Cyperaceae and Poaceae suggest a lower lake level in an open landscape and the expansion of the swamp.
Gin5 (105–61 cm, 1030–740 cal yr BP, 22 samples), was characterized by a progressive decrease in Poaceae (51% to 5%), Nymphaea (3–25%), Anthurium (1–38%), and Cyperaceae (9–54%). Moraceae (1–11%), Arecaceae (1–10%), and Eclipta (1–19%) (Asteraceae) were sparse, whereas frequencies of Cecropia were high (between 1% and 30%), Urticaceae increased (11% to 57%), and there was a progressive increase in macrocharcoal influx (~4 mm2/cm2/yr). Spathiphyllum type taxa fluctuated between 10% and 90% throughout the zone. Mauritia flexuosa (Arecaceae) increased from 1% to 12% at the end of the zone along with a cultivated plant (1%) (Capsicum Solanaceae). Pollen concentrations were high (88,810 to 394,027 grains/cm3). The composition of the sediment, the decrease in Cyperaceae, and the development of Mauritia flexuosa showed that the coring site was no longer located under a lake but in a swamp. The presence of pioneer plants like Cecropia and Urticaceae, cultivated plants, and an increase in the frequency of fire were attributed to human land use on the lake margins. Spathiphyllum type taxa are likely related to Araceae Spathiphyllum, which are common in humid environments and along rivers, in open vegetation, and sometimes in disturbed areas.
Gin6 (61–30 cm, 740–540 cal yr BP, 14 samples) was characterized by an increase in Urticaceae (between 2% and 64%), a decrease in Arecaceae (1% to 4%), Cyperaceae (3–11%), and two peaks in Mimosa frequency at 714 cal yr BP (34%) and at 590–585 cal yr BP (66%). Poaceae frequencies were low (<10%), Spathiphyllum type fluctuated between 2% and 86%, Anthurium increased (1–74%), and the macrocharcoal influx was lower than in the previous zone (0.7 mm2/cm2/yr). Zea mays was observed at 645 cal yr BP. Pollen concentrations were high (30,837–273942 grains/cm3). The development of pioneer taxa and the low rate of charcoal point to a change in human activities during this period. Gallery forest was no longer observed, while Mimosa suggests the development of a Cerrado. Zea mays was grown near the swamp.
Gin7 (30–0 cm, 540 cal yr BP–present, 14 samples) was characterized by fluctuations in three dominant taxa: Mimosa (1% to 80%), Ilex (10% to 30%), and Gomphrena (10% to 50%). Urticaceae decreased (to ~5%), medium-size Poaceae (from 60% to 10%), Anthurium (from 80% to 10%), and Cyperaceae (between 10% and 30%) increased slightly then decreased at the end of the zone. The aquatic Nymphaea increased progressively from 5% to 20% together with Mauritia flexuosa, which increased from 5 to 20%. Moraceae increased slightly and then remained stable at 10–20% throughout the zone. Macrocharcoal influx was recorded until 370 cal yr BP (0.7 mm2/cm2/yr). Pollen concentrations ranged from 70,562 to 325,228 grains/cm3 at the end of the zone. Full installation of the Cerrado occurred progressively with a reduction in the occurrence of fire.
DISCUSSION
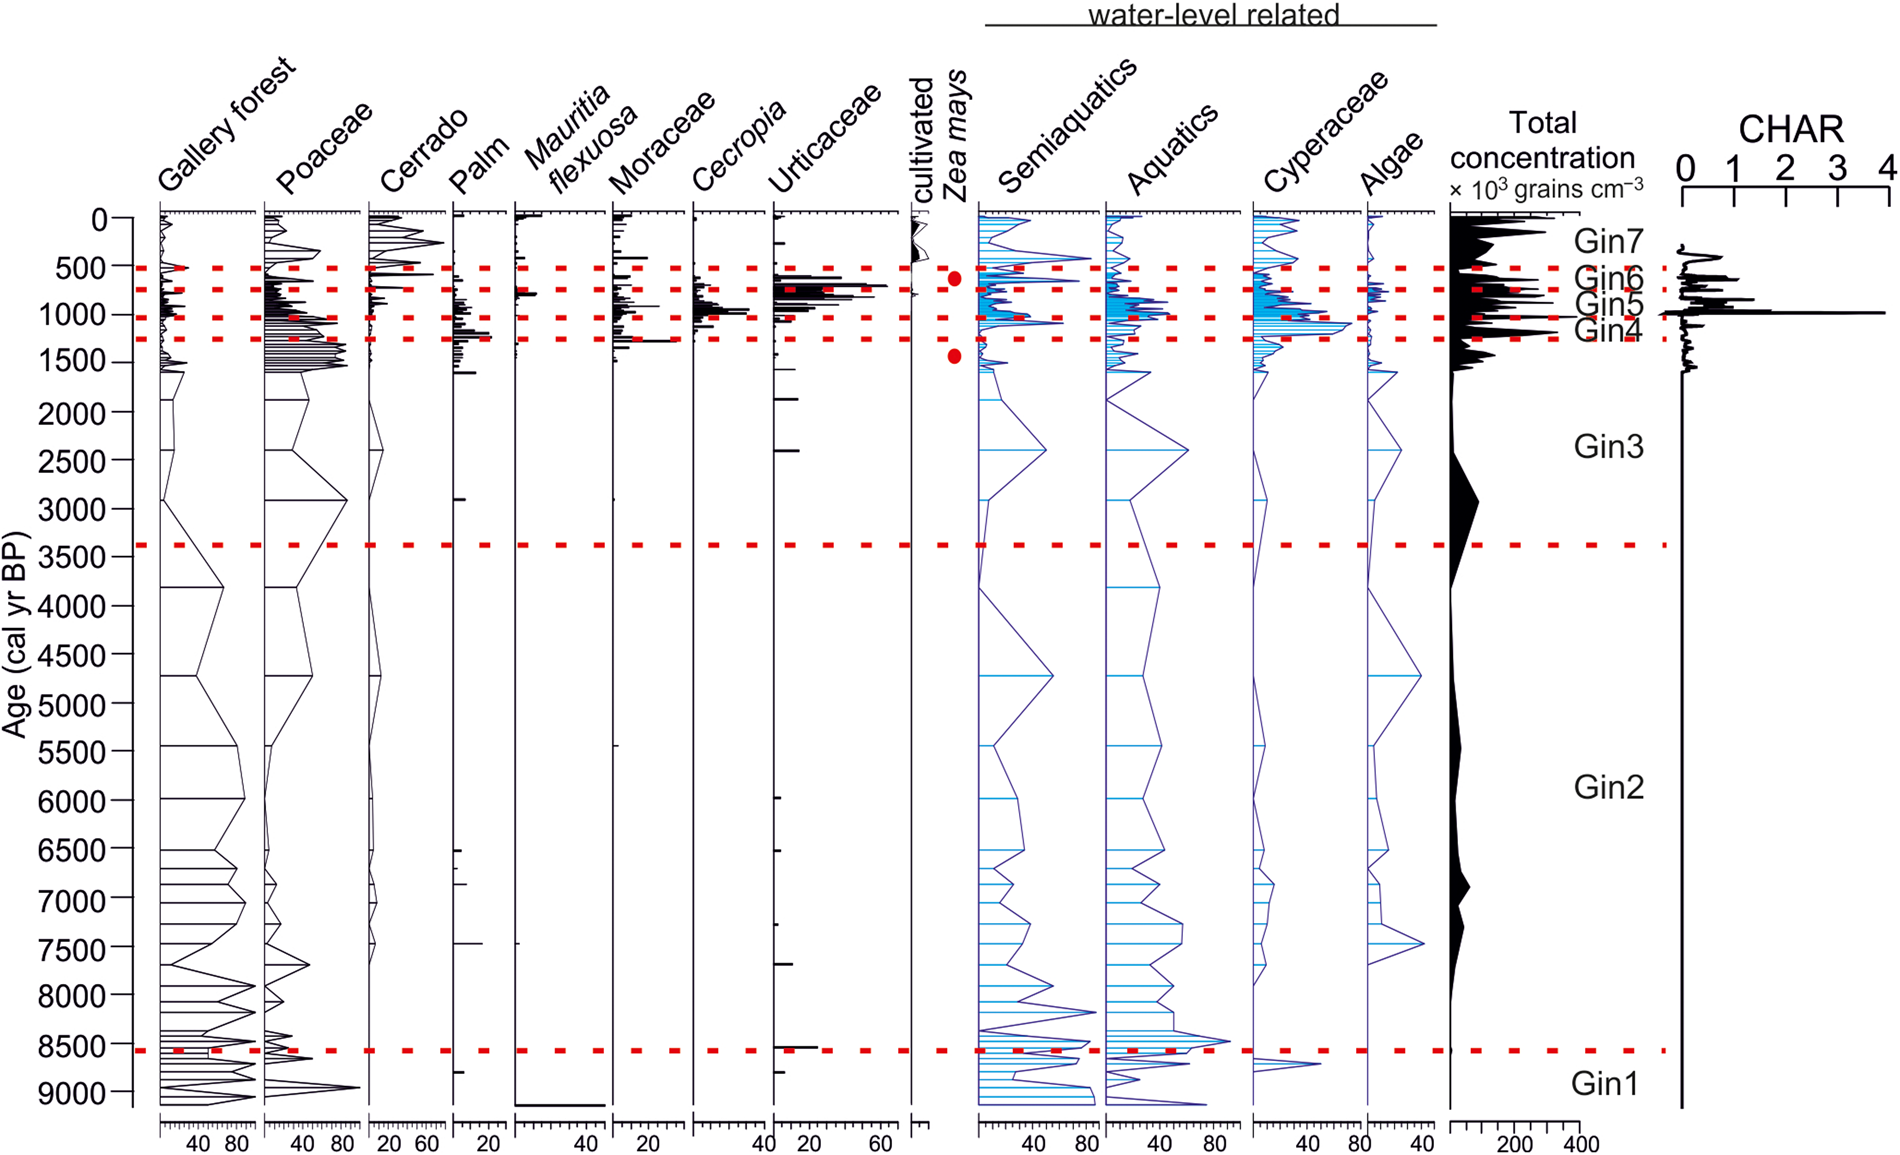
Our results show that over the past 8500 years, the landscape surrounding Lake Ginebra changed progressively from a lake surrounded by a gallery forest (ca. 8500–3360 cal yr BP) to a Cerrado-dominated landscape (1000–0 cal yr BP; Fig. 4), with a Mauritia swamp on the lake margins (Fig. 5). A sharp change in sedimentation rate was observed with a date of 6384 cal yr BP at 151 cm, 3276 cal yr BP at 142 cm, and 1478 cal yr BP at 135 cm, which ended with the expansion of the peat at 118 cm (1245 cal yr BP). During this sharp change in sedimentation, the continuous presence of tropical forest taxa until 3360 cal yr BP, progressively replaced by moist tree taxa (Urticaceae, Moraceae), and the presence of black organic clay infer a change in erosive conditions rather than an absence of sediment deposition in this organic-rich environment.
(color online) Simplified diagram of the pollen results of core Gin (Ginebra) showing the changes in the different types of vegetation with selected indicator taxa, ecological groups, and total pollen concentrations along a timescale. On the right, charcoal accumulation rate (CHAR; mm2/yr).

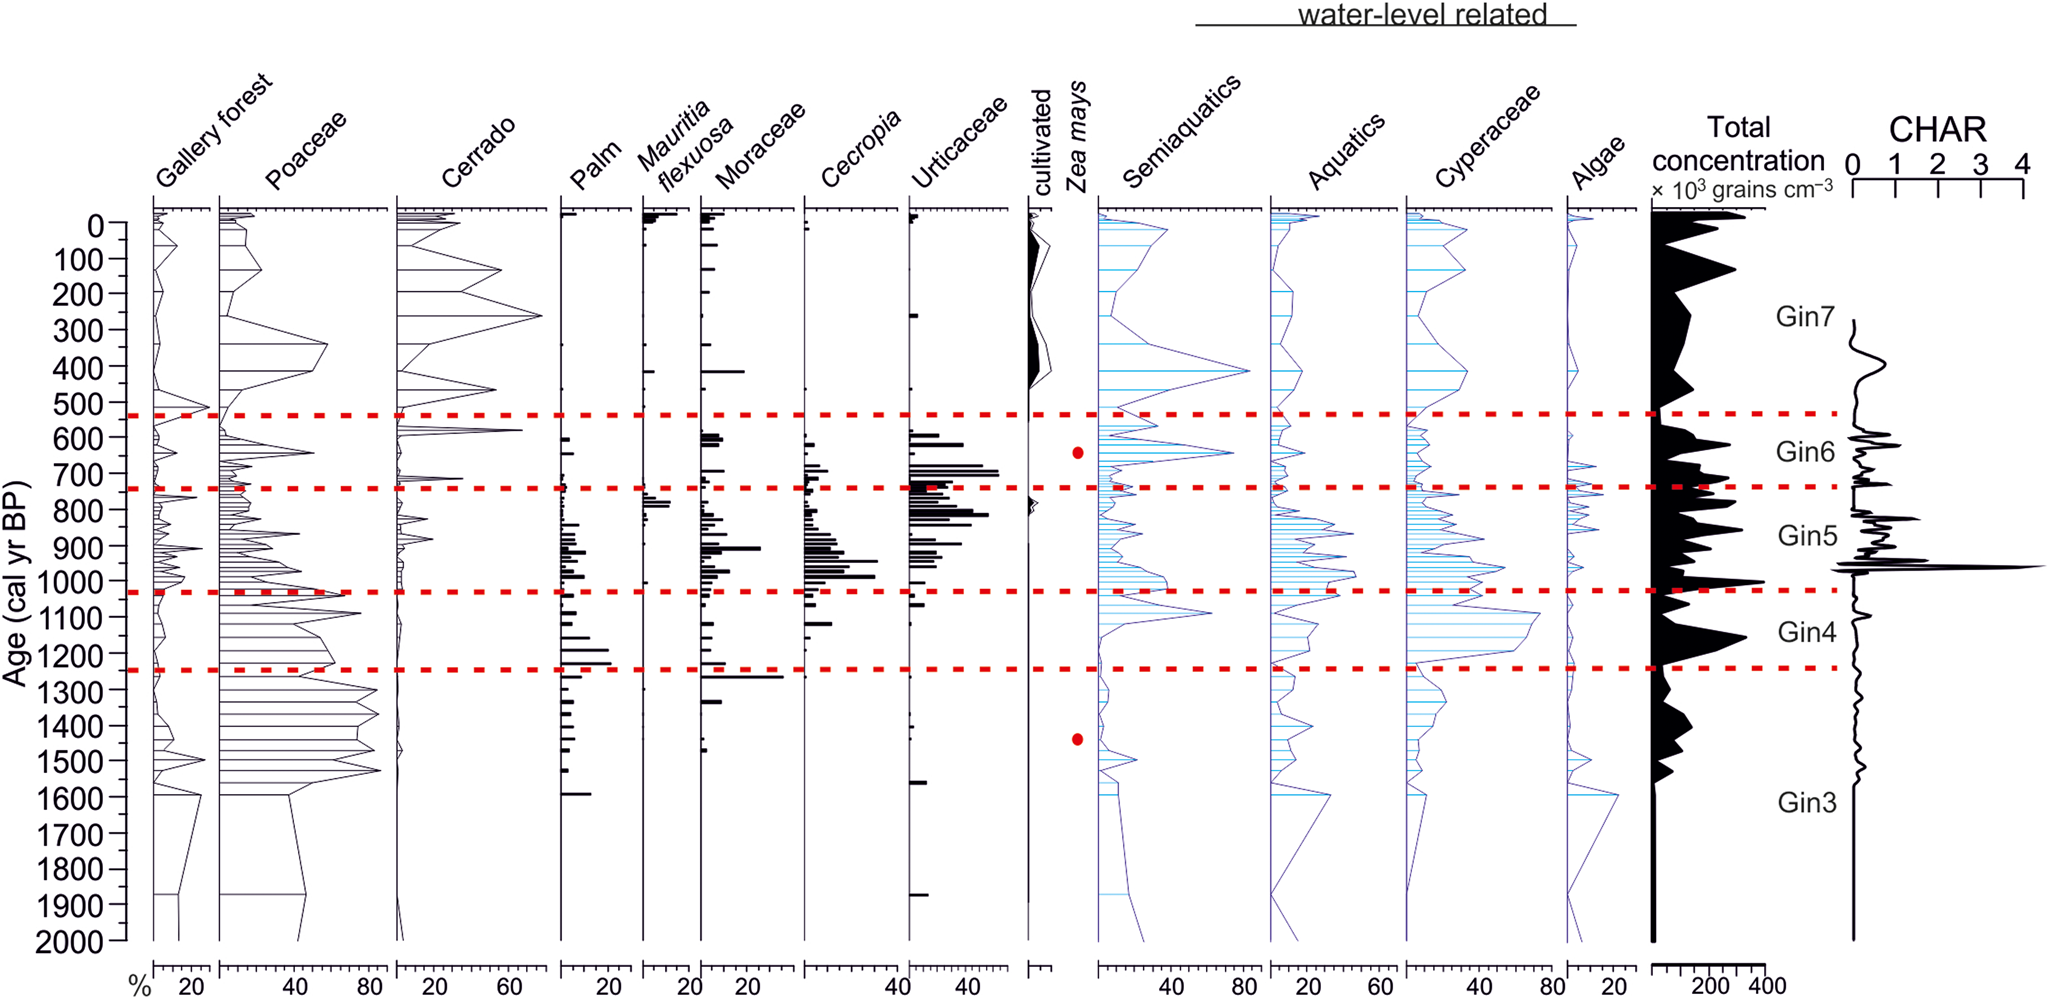
(color online) Simplified diagram showing changes in vegetation and landscape in the last 2000 years with selected indicator taxa, ecological groups, and total pollen concentrations along a timescale. On the right, charcoal accumulation rate (CHAR; mm2/yr).

Ecological signification of the different taxa observed in the pollen record
Mimosa is a common fire-adapted tree of the Cerrado whose pollen signal is generally under represented (Gosling et al., Reference Gosling, Mayle, Tate and Killeen2009; Simon et al., Reference Simon, Grether, de Queiroz, Skema, Pennington and Hughes2009). In the pollen record of Ginebra, Mimosa and Ilex, another common tree of the Cerrado forest (Ledru, Reference Ledru, Oliveria and Marquis2002; Marchant et al., Reference Marchant, Cleef, Harrison, Hooghiemstra, Markgraf, van Boxel and Ager2002), show their highest frequencies during the last 600 years. Before 600 cal yr BP, the Cerrado indicator taxa are scarce, in agreement with Jones et al. (Reference Jones, Mayle, Pennington and Killeen2011).
Cyperaceae are considered swamp-related taxa, which include Cyperus and Eleocharis (Bush et al., Reference Bush, Correa-Metrio, McMichael, Sully, Shadik, Valencia, Guilderson, Steinits-Kannan and Overpeck2016). In Bolivian Amazonia, when Cyperaceae are observed together with Poaceae, they could be associated either with an open forest or a wetland savanna (Gosling et al., Reference Gosling, Mayle, Tate and Killeen2009). In the record of Ginebra, Cyperus and Fimbristylis have been identified and grouped as Cyperaceae in the diagram as they show similar ecology (Fig. 3).
Morphological differences between the pollen grains of Poaceae allowed relate them to specific climatic and environmental patterns (Schüler and Belhing, Reference Schüler and Behling2011; Radaeski et al., Reference Radaeski, Bauermann and Pereira2016, Reference Radaeski and Bauermann2017). The largest Poaceae grains were only observed during the last 1500 years and were attributed to maize crops (Zea mays).
In the Beni, Urticaceae is generally scarce in the vegetation, and most of the pollen attributed to Moraceae/Urticaeae could be assigned to Moraceae (Burn and Mayle, Reference Burn and Mayle2008). However, at Ginebra we were able to identify two taxa, Urera and Urtica, which are grouped as Urticaceae on the diagram (Fig. 3). The Moraceae family is one of the most abundant of the Beni observed either in terra firme gallery forest or upland woodland savanna communities (Burn and Mayle, Reference Burn and Mayle2008). In addition, their pollen grains are wind transported and overrepresented in pollen diagrams (Gosling et al., Reference Gosling, Mayle, Tate and Killeen2005; Burn and Mayle, Reference Burn and Mayle2008). For instance, frequencies above 40% characterize evergreen forest, whereas frequencies below 40% are instead attributed to open forest formation such as Cerrado (Gosling et al., Reference Gosling, Mayle, Tate and Killeen2005, Reference Gosling, Mayle, Tate and Killeen2009). At Ginebra, we observed four types of Moraceae according to Burn and Mayle (Reference Burn and Mayle2008): Brosinum, Castilla, Maquira, and Cecropia. Brosinum occurred only as single grain, and Castilla and Maquira were grouped into the Moraceae type and characterize floodplain or gallery forest. Cecropia was observed as a pioneer tree of the gallery forest. Psychotria is a common taxon of the moist and gallery forest between 0 and 500 m asl, and, rarely found up to 1500 m asl, it is seen as small trees or shrubs. Finally, in the pollen record, three dominant ecosystems—gallery forest, Cerrado, and Mauritia swamp—have been represented (Figs. 3, 4, and 5).
Changes in lake level are based on the frequency of the aquatic plant Nymphaea. This macrophyte grows in 1–3 m of water depth in Beni, although it can be observed in 0.5–3 m water depth in other regions (Brock et al., Reference Brock, Velde and Steeg1987; Beck and Moraes, Reference Beck, Moraes, Davis, Heywood, Herrera-MacBryde, Villa-Lobos and Hamilton1997; Bernhardt and Willard, Reference Bernhardt and Willard2009). Nymphaea is less sensitive to flooding and can survive abrupt increases in water depth. It usually grows in deeper parts of rivers and lakes in comparison with the other macrohytes or water-related plants observed in the Gin pollen record (semiaquatics). It is a good pollen producer, and dispersion is entomophilous (Bernhardt and Willard, Reference Bernhardt and Willard2009).
Landscape changes in central Beni since the mid-Holocene
The gallery forest at Ginebra has varied in composition over time. Although Psychotria (Rubiaceae) was present in almost the whole record, the forest was first dominated by Dieffenbachia (Araceae) from 8890 to 8735 yr cal BP, and then by Ocotea (Lauraceae) from 8620 to 3800 cal yr BP. Between 7900 and 6500 cal yr BP, Araceae was represented by Philodendron, Monstera, and to a lesser extent by Dieffenbachia, while Lauraceae (Ocotea and Persea) decreased progressively, providing evidence that at Lake Ginebra, a dense gallery forest was well represented until 3360 cal yr BP. However, from 6525 to 1610 cal yr BP, an abrupt change in the sedimentation rate was followed by a subsequent change from lacustrine to peat sediment. Two hypotheses could explain this change: either a drop in the level of the lake or the filling up of the lake margins with sediment, which contributed to the installation of the swamp. In accordance with the second hypothesis, the change was accompanied by an open landscape resembling seasonally flooded savanna, but low resolution because of the lack of samples in this interval prevented us from obtaining further details.
The expansion of gallery forest observed in the vicinity of Lake Rogaguado after 5800 cal yr BP coincided with the Fitzcarrald Arch uplift, which caused a major increase in the size of the ancient Lake Rogaguado, and this increment in lake measurement suggests an increase in the pollen catchment rather than a wetter climate during the mid-Holocene (Lombardo, Reference Lombardo2014). The expansion of the forest coincided with the rise in lake level that lasted until 2700 cal yr BP (Brugger et al., Reference Brugger, Gobet, van Leeuwen, Ledru, Colombaroli, van der Knaap, Lombardo, Escobar-Torrez, Finsinger and Rodrigues2016). Between approximately 6525 and 3000 cal yr BP, the abundance of Nymphaea, the disappearance of semiaquatic taxa, and the presence of an organic-rich sediment layer infer a high lake level at Ginebra with erosive conditions rather than no sediment deposition. The change in sedimentation rate is attributed to an increase of the erosion on the lake margins (our coring site), perhaps because of intermittent wave activity, which induced resuspension and remixed material preventing continuous sediment accumulation and deposition; notwithstanding the mixing of the material, the pollen spectra were homogeneous during this interval, which in turns led us to infer that gallery forest was present. These changes in the lake appear to have coincided with the increase in rainfall regimes and/or in fluvial activity in southern Beni, 200 km south of Lake Ginebra, thus supporting our interpretation (Lombardo et al., Reference Lombardo, May and Veit2012).
Moreover, the composition of the sediment of the paleofluvial system in southern Beni revealed its Andean origin, and the delta-like formation of the Rio Grande has been interpreted as reflecting a high local water table and intense seasonal flooding (Plotzki et al., Reference Plotzki, May, Preusser, Roesti, Denier, Lombardo and Veit2015). The apparent decrease in sedimentation rate between 6525 and 1610 cal yr BP at Lake Ginebra, with 15 cm of sediment for 3500 years, could be the result of subaqueous erosion. Indeed, during this interval, a gallery forest with Psychotria-Lauraceae-Araceae was growing on the shore of the lake on the exposed nutrient-rich sediments. The increase in precipitation at the beginning of the late Holocene pushed the gallery forest toward the infertile laterites that form the lakeshores today resulting in a major reduction in gallery forest. Another consequence of increased precipitation was the expansion of seasonally flooded savanna (see the increase in Poaceae in Fig. 4) probably to the former floodplain of the Beni River, along and below the southern margin of the lake.
The withdrawal of gallery forest was accompanied by the disappearance of the Lauraceae (Ocotea and Nectandra) from 2900 to 1370 cal yr BP, Psychotria from 2400 to 1470 cal yr BP, and Araceae (Philodendron, Dieffenbachia, and Monstera) from 2900 to 1120 cal yr BP. The expansion of Urticaceae from 2400 cal yr BP, and of Moraceae from 1336 to 1266 cal yr BP, characterized the moist taxa of the lake margin, while Araceae (Philodendron) progressively disappeared between 910 and 790 cal yr. The open landscape characterized by seasonally flooded savanna lasted until 1245 cal yr BP. The background pollen assemblages characterized a mixed landscape composed of mosaics of evergreen forest and open savanna. After 1030 cal yr BP, the flat areas surrounding Lake Ginebra progressively changed from seasonally flooded savanna to Cerrado with flooded Várzea forest dominated by Mauritia flexuosa. A relatively stable environment and limited river activity was inferred for southern Beni (Lombardo et al., Reference Lombardo, Rodrigues and Veit2018). At the same time, human settlements expanded in central and southern Beni (Walker, Reference Walker2004; Rodrigues et al., Reference Rodrigues, Lombardo, Trauerstein, Huber, Mohr and Veit2016; Blatrix et al., Reference Blatrix, Roux, Béarez, Prestes-Carneiro, Amaya, Aramayo and Rodrigues2018). Today, the four different types of ecosystems—seasonally flooded savanna, inundated Várzea forest, gallery forest, and Cerrado—are observed in the region of Ginebra (Brugger et al., Reference Brugger, Gobet, van Leeuwen, Ledru, Colombaroli, van der Knaap, Lombardo, Escobar-Torrez, Finsinger and Rodrigues2016).
Regional versus local drivers of Beni ecosystems
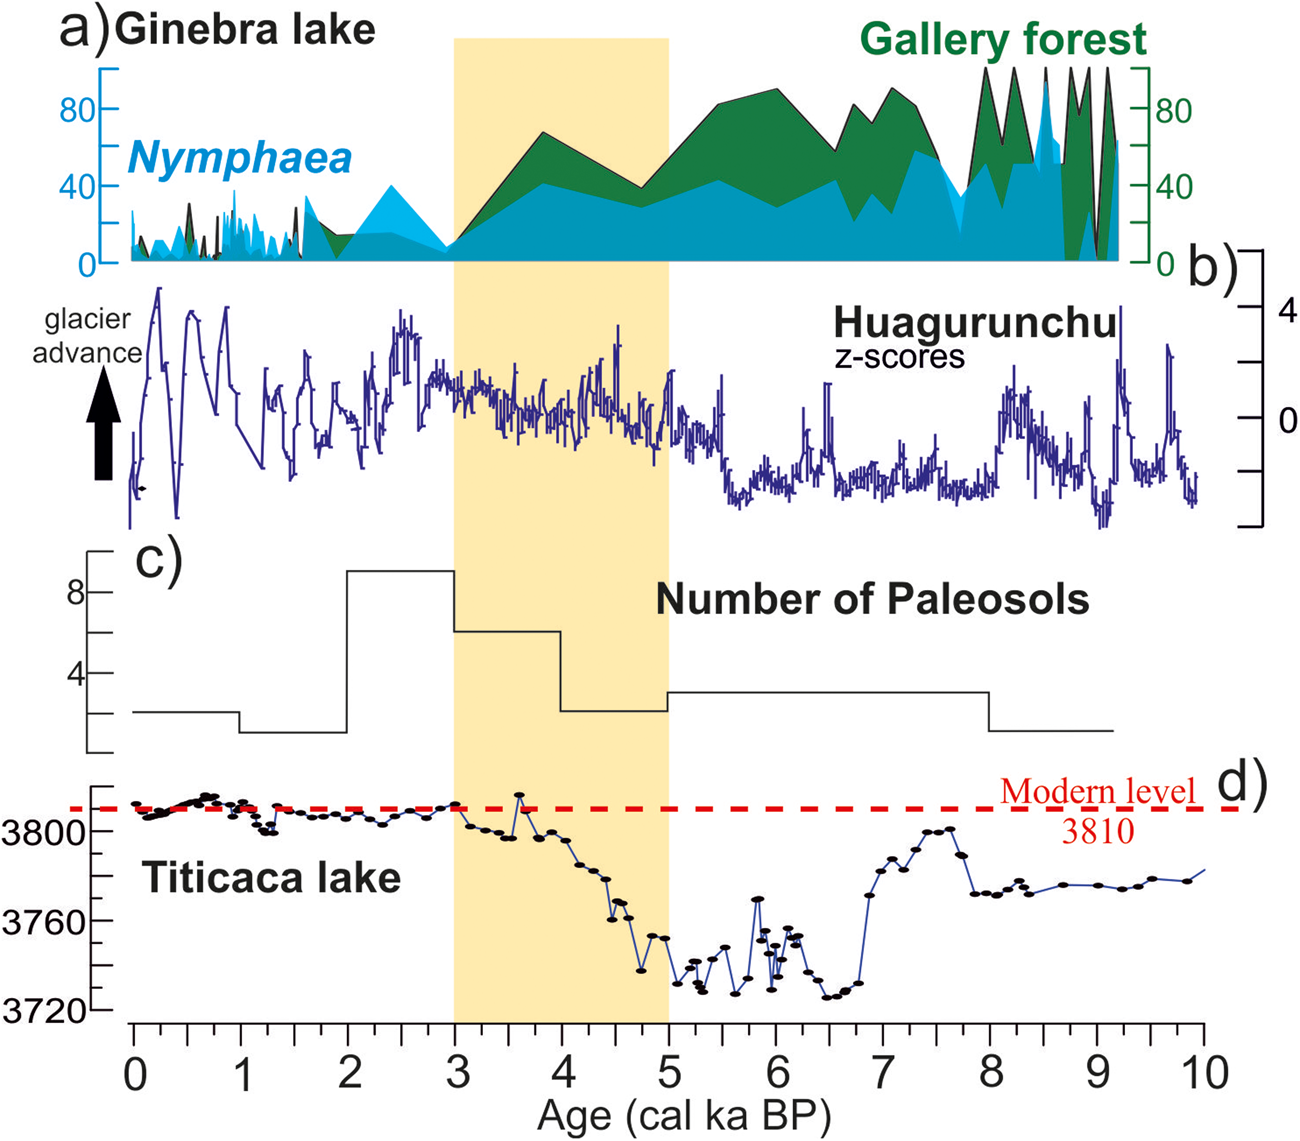
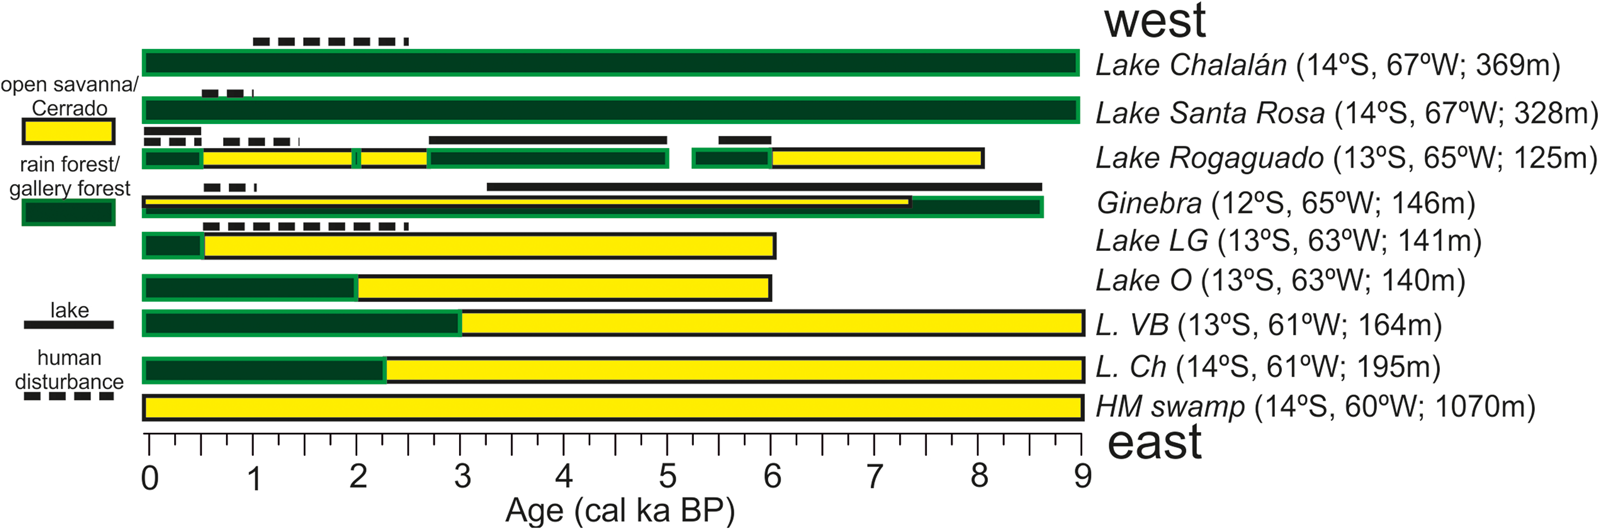
In the central Andes, right above the Beni region, humid conditions advanced progressively in the Altiplano after 4500 cal yr BP when the level of Lake Titicaca started to rise (Rowe et al., Reference Rowe, Dunbar, Mucciarone, Seltzer, Baker and Fritz2002) and the glaciers expanded again (Stansell et al., Reference Stansell, Rodbell, Licciardi, Sedlak, Schweinsenberg, Huss, Delgado, Zimmerman and Finkel2015; Fig. 6). The western upper Beni, Chalalán, and Santa Rosa records reported continuous moist forest throughout the Holocene (Urrego et al., Reference Urrego, Bush, Silman, Niccum, De La Rosa, McMichael, Hagen and Palace2013; Fig. 7). By contrast, in eastern Beni, a continuous dry early to mid-Holocene climate was observed from 9000 to 3000 cal yr BP with a combination of seasonally flooded savanna and dry forest, and increased fire activity (Mayle et al., Reference Mayle, Beerling, Gosling and Bush2004; Carson et al., Reference Carson, Whitney, Mayle, Iriarte, Prümers, Soto and Watling2014; Maezumi et al., Reference Maezumi, Power, Mayle, McLauchlan and Iriarte2015). In southern Beni (Llanos de Moxos), the landscape was stable until ~4000 cal yr BP (Lombardo et al., Reference Lombardo, Rodrigues and Veit2018; Fig. 6). These regionally contrasted patterns of vegetation and thus climate conditions reflect different expressions of bioclimatic borders in the southern Amazonian foreland. Possible explanations for the varying vegetation and humid conditions are different drivers that triggered diverse responses in the Beni region.
Summary diagram showing climatic and environmental changes in the Holocene at Lake Ginebra (a), Huagurunchu Nevado from Stansell et al. (Reference Stansell, Rodbell, Licciardi, Sedlak, Schweinsenberg, Huss, Delgado, Zimmerman and Finkel2015) (b), number of paleosols in southern Beni from Lombardo et al. (Reference Lombardo, Rodrigues and Veit2018) (c), and levels of Lake Titicaca from Rowe et al. (Reference Rowe, Dunbar, Mucciarone, Seltzer, Baker and Fritz2002) (d). The yellow rectangle highlights the transition from mid- to late Holocene and the strengthening of the South American summer monsoon. (For interpretation of the references to color in this figure legend, the reader is referred to the web version of this article.)

(color online) Landscape changes in the southern Amazon foreland over the last 9000 years along a west to east gradient reconstructed from pollen records. Lake Chalalan and Lake Santa Rosa from Urrego et al. (Reference Urrego, Bush, Silman, Niccum, De La Rosa, McMichael, Hagen and Palace2013), Lake Rogaguado from Brugger et al. (Reference Brugger, Gobet, van Leeuwen, Ledru, Colombaroli, van der Knaap, Lombardo, Escobar-Torrez, Finsinger and Rodrigues2016), Lake La Granja (LG) and Lake Oricore (O) from Carson et al. (Reference Carson, Whitney, Mayle, Iriarte, Prümers, Soto and Watling2014), Lake Bella Vista (L. VB) and Lake Chaplin (L. Ch) from Mayle et al. (Reference Mayle, Burdbridge and Killen2000), and Huanchaca Meseta (HM) from Maezumi et al. (Reference Maezumi, Power, Mayle, McLauchlan and Iriarte2015).

The mid-Holocene (~8000 to 5000 cal yr BP) climatic drying observed in eastern Beni occurred in response to a low phase of the precession cycle and a weak SASM that would have reduced precipitation in tropical South America (Braconnot et al., Reference Braconnot, Otto-Bliesner, Harrison, Joussaume, Peterchmitt, Abe-Ouchi and Crucifix2007; Prado et al., Reference Prado, Wainer, Chiessi, Ledru and Turcq2013). The increase in temperature in the highlands increased glacier melting (Jomelli et al., Reference Jomelli, Khodri, Favier, Brunstein, Ledru, Wagnon and Blard2011), which, in turn, likely contributed to the flooding of sensitive areas such as the Llanos de Moxos in southern Beni (Lombardo et al., Reference Lombardo, Rodrigues and Veit2018). This was well observed in northern Peru where marked fluctuations in soil moisture were recorded at the Andean piedmont between 5000 and 3500 cal BP alternating from wet to dry and back to wet conditions (Van Breukelen et al., Reference Van Breukelen, Vonhof, Hellstrom, Wester and Kroon2008). Similarly, the stronger discharges of some rivers in the northern sector of the Amazon basin have been linked to the increase in ice melt in the central Andes combined with strong precipitation events (Maslin et al., Reference Maslin, Durham, Burns, Platzman, Grootes, Greig and Madeau2000). Moreover, evidence of an increase in uplift convective activity, detected in the Eastern Cordillera, also showed that the Amazon basin was humid at the mid- to late Holocene transition between ~5000 and 3000 cal yr BP reflecting the air flow connection between the Amazonian rain forest and the Andean summits (Ledru et al, Reference Ledru, Jomelli, Bremond, Cruz, Ortuño, Bentaleb and Sylvestre2013; Escobar-Torrez et al., Reference Escobar-Torrez, Ortuño, Bentaleb and Ledru2018). At Ginebra, with the SASM strengthening, precipitation increased after 5800 cal yr BP. Fluctuations in both precipitation regimes and lake level prevented gallery forest or forest islands and favored the development of seasonally flooded savanna.
These results show that the moister climate conditions caused by the convective activity and the enhancement of the SASM system allowed the expansion of the rain forest on the edges of the Amazon basin. The persistence of a wet forest during the early to mid-Holocene in southwestern Amazonia highlighted some local responses to the wider regional trend that could be related to the distance from the Andes (Urrego et al., Reference Urrego, Bush and Silman2010, Reference Urrego, Bush, Silman, Niccum, De La Rosa, McMichael, Hagen and Palace2013). Indeed, continuous rain forest cover has been documented in sediment records in upper Beni over the past 9000 years (Lake Chalalán and Lake Santa Rosa), even when western Amazonia was dry and fires were more frequent than today (Urrego et al., Reference Urrego, Bush, Silman, Niccum, De La Rosa, McMichael, Hagen and Palace2013). Farther to the east, the Ginebra pollen record revealed the presence of a lake with gallery forest until 3360 cal yr BP; 400 km southeast of Lake Ginebra, the pollen signal suggests that the southward movement of the rain forest started 3000 cal yr BP near the southernmost extent of the SASM system and followed a north–south direction (Mayle et al., Reference Mayle, Burdbridge and Killen2000; Burbridge et al., Reference Burbridge, Mayle and Killeen2004; Lake Bella Vista). While at Lake Oricore, located at about 250 km east of Lake Ginebra, climatically driven rain forest expansion began ~2000 cal yr BP and replaced an open savanna landscape (Carson et al., Reference Carson, Whitney, Mayle, Iriarte, Prümers, Soto and Watling2014). At Huanchaca Mesetta in the Noel Kempff Mercado National Park, the establishment of the modern palm swamp in a Cerrado landscape occurred at ~5000 cal yr BP, following an increase in precipitation (Maezumi et al., Reference Maezumi, Power, Mayle, McLauchlan and Iriarte2015; Fig. 7).
All this evidence a climate and vegetation response, in different, regional and local studies, of the Andes and Amazonia, mainly in the Beni region. Our study suggests that the mechanism of response by landscape relies on both regional climatic drivers (SASM) and local features such as the Andes. The latter was acting as a modulator of transport of moisture, increasing convective activity and precipitation in its eastern flank and in the Amazon basin, and, particularly, in the Lake Ginebra region, as a hydrologic buffering from increased Andean meltwater into the lowlands during warm periods.
Land use in the Beni in the late Holocene
The past 1500 years have been characterized by fluctuations in lake level as indicated by the changes in Nymphaea frequencies. Lake levels were higher at 1200 cal yr BP and between 1100 and 900 cal yr BP, and rain forest with Moraceae expanded between 1000 and 700 cal yr BP. During this interval, two main phases of anthropogenic activities can be observed in the Ginebra pollen record. Between 1000 and 550 cal yr BP, human occupation was characterized by the increase in fire frequency and in cultivated plant taxa (Fig. 5). People usually practiced agriculture near a river or on the lake margin (Bush et al., Reference Bush, Correa-Metrio, McMichael, Sully, Shadik, Valencia, Guilderson, Steinits-Kannan and Overpeck2016; Hilbert et al., Reference Hilbert, Neves, Pugliese, Whitney, Shock, Veasey, Zimpel and Iriarte2017), and remains of raised fields can be seen on the satellite images acquired near our coring site. Our results suggest that the area around Lake Ginebra was used as a source of food, probably with the direct consumption of native palm Mauritia (fruit) and cultivated plants Capsicum and Zea mays (Hiraoka, Reference Hiraoka1999; Paniagua-Zambrana, Reference Paniagua-Zambrana2005).
At Lake Rogaguado, maize was observed after 6500 cal yr BP and then became scarce from 1400 cal yr BP (Brugger et al., Reference Brugger, Gobet, van Leeuwen, Ledru, Colombaroli, van der Knaap, Lombardo, Escobar-Torrez, Finsinger and Rodrigues2016). In the region of Lake Ginebra, we propose a scenario in which two different types of agriculture took place. At the beginning, the high abundance of charcoal together with maize pollen suggests a sort of shifting cultivation, where the use of fire was an important agricultural practice. After 550 cal yr BP, an increase in cultivated plants was observed in the absence of fire. We interpret this as the moment when raised field agriculture, which did not involve the use of fire (Iriarte et al., Reference Iriarte, Power, Rostain, Mayle, Jones, Watling, Whitney and McKey2012), began around Lake Ginebra. The presence of many agricultural fields along the shores of both Lake Rogaguado and Lake Ginebra are evidence that people settled most of the shorelines of the two lakes. However, the marked differences in the concentration of charcoal and in the pollen of cultivars between the Ginebra record and the record of Rogaguado suggest that, in northern Beni, settlements were probably more mobile than in other regions of the Beni, such as the Monumental Mound Region where people occupied the region continuously for around 1000 years (Prümers and Betancourt, Reference Prümers and Jaimes Betancourt2014). Archeological investigation of sites surrounding these large lakes in northern Beni is needed in order to establish the conditions that caused the switch from the use of fire in agriculture to raised fields, to what extent people relied on agriculture in a place where aquatic resources were abundant, and to better understand how settlement patterns and food production changed over time around these lakes.
CONCLUSION
Our results showed that the observed forest transgression/regression phases in the southern Amazonian foreland inferred from paleoecological records can be interpreted as a function of both local hydrologic dynamics and regional-scale shifts of the SASM activity. For the local features, we observed that the decrease in sedimentation rate together with abundant semiaquatic taxa between 6525 and 3000 cal yr BP was related to more erosive conditions on the lake margins. On the other hand, the increase in sediment accumulation at the core site between 3360 and 1245 cal yr BP was related to the progressive evolution of the lake margins into a swamp rather than a decrease of the lake size because of climate change. During the mid-Holocene, the expansion of the forest observed at Lake Rogaguago was not observed at Ginebra, thus confirming the tectonic origin of the increase in the lake catchment rather than a wetter climate.
The fluctuations in precipitation and erosive conditions of the record of Ginebra revealed an intermediary state between the wet western Beni and the dry eastern Beni. Indeed, compared with other paleorecords located along an east–west transect on the southern Amazonian foreland, the Ginebra record also highlights the importance of the Andes on the local hydrology and the river dynamics.
In the late Holocene, both the increase in insolation and strengthening of the SASM system enabled the development of a seasonal flooded savanna in northern Beni and of the rain forest in eastern Beni. Mosaics of evergreen forest and savanna patches together with the development of the Mauritia swamps characterized the last 500 years after a short wetter episode between 1200 and 900 cal yr BP.
Our results also underline the importance of multiplying the number of records in one region (e.g., the southern Amazonian foreland) or even at a more local scale (i.e., the lake vs. swamp record between Rogaguado and Ginebra) in order to better evaluate the interplay between the vegetation mosaics (savanna vs. moist forest) that make up the landscape of the Beni and how the effects of local forcings such as ice melting or tectonics could be superimposed to global climate change as is observed during the mid-Holocene.
SUPPLEMENTARY MATERIAL
The supplementary material for this article can be found at https://doi.org/10.1017/qua.2019.72
ACKNOWLEDGMENTS
This research was conducted as part of the project “HydroGen” in the Programme Pilote Régional Amaz at IRD. We thank the Labex-CEBA for KET stay at ISEM in France, the Laboratoire de Mesure du Carbone 14 (LMC14) – UMS 2572 (CEA/DSM, CNRS, IRD, IRSN, Ministère de la culture et de la communication) for 14C dates, Sandrine Canal for processing the LOI samples, Walter Finsinger for his helpful advice in macrocharcoal treatment and analysis, and Stephan Beck and Karsten Schittek for their helpful comments. Special thanks to Prof. J. Shulmeister for helpful comments and input on the final version of the manuscript.