


I. INTRODUCTION
Substrate-integrated waveguides (SIWs) are emerging integrated waveguide-like structures fabricated by using two periodic arrays of metallic vias or trenches in a dielectric substrate metallized on both faces (Fig. 1). The guiding effect is well defined due to two rows of metal vias, with diameter D, axial spacing s, and lateral separation W. Such structures can largely preserve the well-known advantages of conventional rectangular waveguides, namely, high quality factor and high power-handling capability. Integrated rectangular waveguide concepts have been recently studied and developed [Reference Hirokawa and Ando1–Reference Deslandes and Wu4].
Geometry of the SIW.

The SIW technique permits to fabricate a complete circuit (including planar circuitry, transitions, and rectangular waveguides) in a planar form, using a standard printed circuit board or other planar processing techniques.
This technology represents an attractive alternative to conventional metallic waveguides for low-loss, low-cost, and high-density integration of microwave and millimeter-wave components and subsystems [Reference Cassivi and Wu5–Reference D'Orazio and Wu8]. One of the major issues for the applicability of SIW to the design of millimeter-wave components is related to their losses.
In fact, SIW structures suffer from ohmic losses (like standard metallic waveguides), dielectric losses (which are avoided in hollow metallic waveguides), and radiation losses (since SIW are not completely shielded). While the issue of radiation losses has been discussed in number of papers (e.g. [Reference Xu, Zhang, Hong, Wu and Cui2–Reference Deslandes and Wu4]), less attention has been paid to the investigation of ohmic and dielectric losses [Reference Che, Wang, Deng and Chow9–Reference Bozzi, Pasian, Perregrini and Wu11].
In this paper, we present a systematic investigation into the mechanisms of losses in SIW interconnects and cavities. Radiation loss, ohmic loss, and dielectric loss are all considered, in the case of waveguides with different geometry, operating at different frequencies. This study permits to give a physical interpretation of the loss mechanisms and to identify design criteria in order to minimize losses.
Moreover, a systematic study of losses in SIW cavities is also developed. In this case, we demonstrate that the criteria derived for reducing losses in waveguide structures are less effective in enhancing the cavity quality factor.
II. LOSSES IN SIW INTERCONNECTS
The SIW structures are known to exhibit propagation characteristics similar to those of classical rectangular waveguides, but with few basic differences. The modes of an SIW practically coincide with a subset of the modes of rectangular waveguides. In fact, due to the gaps between metal vias, only TEn0 (n = 1, 2, …) modes can exist in the SIW [Reference Xu and Wu3]. In particular, the fundamental mode is similar to the TE10 mode of the rectangular waveguide, with vertical electric current density on the side walls. Due to this similarity, it is also possible to determine an equivalent width W eff [Reference Cassivi, Perregrini, Arcioni, Bressan, Wu and Conciauro12].
A) Modeling of losses
As we have mentioned above, there are three mechanisms of loss in the SIW structures. Due to the similarity between SIW and rectangular waveguides, the two structures exhibit two identical loss mechanisms, namely ohmic losses due to the finite conductivity of the metal walls and dielectric losses due to the loss tangent of the dielectric material. Moreover, in the case of SIW structures, the presence of slots or gaps along the side walls causes another mechanism of loss, namely the radiation loss, due to a possible leakage through the gaps.
Losses in SIW interconnects can be studied considering that the power P(z) flowing through a section z decreases according to the following equation [Reference Balanis13]:

where α denotes the attenuation constant. If losses are reasonably small, it results in a simple linear superposition such that

where α r is the attenuation constant due to radiation losses, α c is the attenuation constant due to the finite conductivity of the metal, and α d is the attenuation constant due to dielectric losses.
In this paper, the determination of the attenuation constants of SIW interconnects is based on the full-wave analysis of a waveguide section of length d by using the commercial code Ansoft HFSS, which provides the scattering parameters of the two-port circuit (Fig. 1). In this calculation, the two ports of the circuit are defined as rectangular ports between a pair of vias and it has been verified that the slight difference between the width of the ports (W–D) and the width W of the SIW interconnect basically does not contribute to losses determination at the central frequencies of the unimodal operation bandwidth. Moreover, radiation conditions have been set on the lateral walls of the structure.
The attenuation constant α is derived from the scattering parameters as follows:

This attenuation constant comprises all losses considered in the analysis model. It is noted that the length d of the structure is chosen in such a way that the net power flowing through any section of the SIW does not change significantly due to the effect of losses or, in other words, that |S 21| is close to unity when the SIW interconnect is acting as a properly guiding structure (i.e. when radiation leakage is negligible).
For the determination of the three attenuation constants, the following set of analyses was performed:
1) The first analysis was performed with perfect conductor (σ = ∞) and ideal dielectric (tanδ = 0). In this case, the only source of loss is the radiation leakage, and therefore it is possible to evaluate α r. In particular, the attenuation constant α′ derived from (3) coincides with the attenuation constant due to radiation (α r = α′).
2) The second analysis was performed considering finite conductivity σ and ideal dielectric (tanδ = 0). In this case, losses are due to both radiation and ohmic loss. It results that the attenuation constant α″ derived from (3) is the sum of α r and α c, and therefore α c = α″−α r.
3) The third analysis was performed considering a perfect conductor (σ = ∞) and lossy dielectric (finite tanδ). In this case, losses are due to both radiation and dielectric loss. It results that the attenuation constant α″′ derived from (3) is the sum of α r and α d, and therefore α d = α″′−α r.
Moreover, a full-wave analysis including all sources of losses gave almost exactly the same attenuation value obtained by using (2), thus validating the described three-step approach.
B) Validation example
As an example, we studied the losses of the SIW structure presented in [Reference Torres-Torres, Romo, Horine, Sanchez and Heck14], consisting of a Rogers RT/Duroid 5880 dielectric substrate with thickness h = 0.79 mm (Fig. 1), relative dielectric permittivity ɛr = 2.2 and loss tangent tanδ = 0.0009 at 10 GHz [15] and tanδ = 0.0017 at 50 GHz [Reference Torres-Torres, Romo, Horine, Sanchez and Heck14].
A metal conductivity σ = 5.7 × 10⁷ S/m is assumed both for the top and bottom ground planes and for the metal vias. The nominal structure consists of metal vias with diameter D = 0.48 mm, spacing s = 0.703 mm, and width W = 4.09 mm. According to [Reference Che, Wang, Deng and Chow9], this leads to an effective width W eff = 3.745 mm, corresponding to a cut-off frequency of 27 GHz.
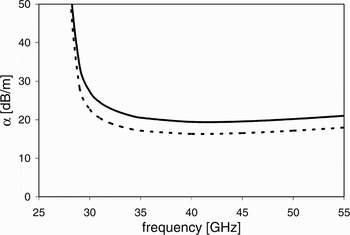
Figure 2 shows the comparison between the losses calculated by using the procedure proposed in Section IIA and those calculated and measured in [Reference Torres-Torres, Romo, Horine, Sanchez and Heck14]. A very good agreement is observed between the simulated frequency responses, with minor discrepancies compared to measurements.
Attenuation constant of the SIW considered for validation: comparison between simulations taken from [14] (dashed line), HFSS simulation (solid line), and measurements (markers).

C) Parametric study of losses
With the aim of performing a systematic comparison between losses of SIW interconnects with the same operation bandwidth when varying D and s, several analyses have been performed, keeping unchanged the effective width W eff = 3.745 mm, thus resulting in a cut-off frequency of 27 GHz. Therefore, the distance W between the centers of the vias has been calculated according to [Reference Che, Wang, Deng and Chow9]

The diameter D ranges from 0.35 to 0.85 mm, whereas the spacing s ranges from 0.90 to 1.40 mm. The attenuation constants are calculated by using the procedure proposed in Section IIA at the frequency of 40 GHz, which practically represents the central frequency of the unimodal operation bandwidth of the waveguide.
Figure 3 shows the attenuation constant α r due to radiation losses, versus D/λ g and s/D, where λ g is the wavelength in the SIW at 40 GHz. As expected, from this plot it results that radiation losses are larger when the metal vias are small and far apart, i.e., when the gaps between the vias are wide. In particular, it is observed that the attenuation constant α r is smaller than 2 dB/m if the ratio between the spacing and the diameter of the metal vias is s/D < 2 for the highest D/λ g.
Attenuation constant α c (dB/m) due to radiation losses, versus the ratios s/D and D/λ g.

Then, moving toward smaller D/λ g, the same limit value for α r may be obtained with larger s/D, which approaches and even overcomes a value of 2.5. This result agrees with the design rule-of-thumb reported in [Reference Xu and Wu3]. Negligible radiation losses are found when metal vias are closely spaced: in this case, the SIW tends to be almost completely shielded, like in a classical rectangular waveguide.
The attenuation constant α c due to the finite conductivity of the metal versus D/λ g and s/D is shown in Fig. 4. Also in this case, losses are small when the metal vias are closely spaced. The physical explanation of this effect is that, in this case, the vertical electric current density on the metal vias is spread on a wider surface, thus reducing the dissipated power, which depends on the square amplitude of the current density. In this condition, we found that α c ranges from 3.6 to 4 dB/m. Thus, by properly selecting the dimension and spacing of the vias, it is possible to minimize the attenuation constant due to metallic losses, while preventing radiation leakage.
Attenuation constant α c (dB/m) due to ohmic losses, versus the ratios s/D and D/λ g.

It is noted that when the field is practically completely confined within the two rows of vias, almost the whole current density flows on the inner side of the vias. To better highlight this phenomenon, we consider the structure of Fig. 5(a) and plot the surface current density along the perimeter of the vias (black solid line in Fig. 6). If vias diameter D and spacing s are halved so that s/D is kept unchanged (Fig. 5(b)), the current density distribution and its peak value remain the same (dotted line in Fig. 6) because, despite the shrink of the perimeter, the number of vias where the side-wall current can flow is doubled. Therefore, we expect that increasing s/D for a given value of D will always result in an increase of the current density on each vias, thus increasing the metal losses. However, from Fig. 4 it results that metal losses decrease when the metal vias are largely spaced. This effect, which seems to violate the physical interpretation given above, has a twofold explanation: on the one hand, the power flowing through the structure decreases more rapidly along the propagation direction due to radiation leakage, thus reducing the power dissipated on the vias along the z-axis; on the other hand, and most relevant, the field leaks outside the guiding structure and, therefore, the current density is more distributed on the vias surface, as shown by the gray line in Fig. 6, which refers to the structure of Fig. 5(c).
Three different SIW structures considered to study the surface current density distribution: (a) D = 0.84 mm, s/D = 1.5; (b) D = 0.42 mm, s/D = 1.5; and (c) D = 0.42 mm, s/D = 3.

Amplitude of the surface current density along the perimeter of the vias, when considering the SIWs of Fig. 5 (ζ being the local coordinate along the perimeter). The dashed line is the hypothetical current distribution on the vias of the structure in Fig 5(c), as if it was distributed only on the inner portion of the perimeter.

In Fig. 6, it is also reported the hypothetical current distribution on the vias of this structure (dashed line), as if it was distributed only on the inner portion of the perimeter. Its peak value is twice with respect to the dotted line, because the number of vias is one-half. When calculating metallic losses on the side walls, which are related to the surface integral of the square of the current density on the vias, structures of Figs 5(a) and 5(b) give the same results.
Surprisingly, also the distribution in structure of Fig. 5(c) leads to similar values, thus explaining the behavior in Fig. 4. However, it is observed that the SIW structure is normally not used in this condition, because of radiation losses.
For the sake of completeness, and to highlight the impact on the ohmic loss of the substrate height, a simulation was performed halving the latter.
The results are reported in Fig. 7 and they clearly show, as expected from classical waveguide theory, that the overall losses are about 3 dB higher than the structure considered in [Reference Torres-Torres, Romo, Horine, Sanchez and Heck14].
Simulation of the attenuation constant of the SIW considered in [14] (dashed line) and the same SIW with half height (solid line).
The attenuation constant α d due to the dielectric is shown in Fig. 8, when varying D/λ g and s/D. It is noted that dielectric losses mainly depend on the region where the amplitude of the electric field is large, i.e., in the middle of the waveguide.
Attenuation constant α d (dB/m), due to dielectric losses, versus the ratios s/D and D/λ g.
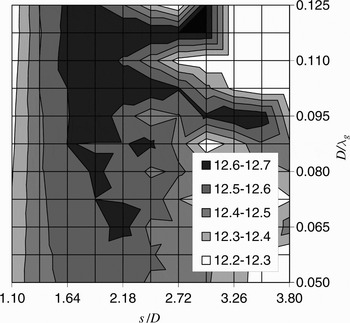
Therefore, the field pattern is slightly affected by the vias dimensions and spacing, thus resulting in a very limited variation of α d, which ranges from 12.2 and 12.7 dB/m.
From Fig. 8, it may be observed that also in this case losses decreases for large values of s/D. This is mainly due to the fact that the field is spread in a larger volume thus reducing its peak value.
In this example, dielectric losses are by far the most important source of loss and, consequently, it is almost useless to try to minimize α c by changing D and s. However, this fact strongly depends on the characteristics of the dielectric substrate and on the operation frequency. Indeed, when considering a dielectric medium having better electrical performance and/or a lower operating frequency, α c may become comparable to α d. To better understand this phenomenon, we consider a number of SIW guiding structures on Rogers RT/Duroid 5880, with a cut-off frequency varying from 4.65 to 27 GHz, keeping s/D = 2 to prevent radiation losses.
In all cases, we calculated the dielectric and metallic losses at the central frequency of the unimodal operation bandwidth (from 7 to 40.5 GHz) and the results are reported in Fig. 9. For this structure, it is evident that it is worth to act on s and D to minimize metallic losses when α c approaches or exceeds α d.
Attenuation versus central frequency of the unimodal operation bandwidth, when considering SIW structures with different cut-off frequencies.

III. LOSSES IN SIW CAVITIES
After discussing the losses in the interconnects, we consider SIW resonant cavities in this section, which represent a key component in the design of microwave circuits. In particular, we consider the structure sketched in Fig. 10 and calculate the quality factor Q when varying the vias' diameter and spacing, under the condition s/D < 2, which guarantees that radiation losses are negligible.
Geometry of the SIW cavity.

The cavity is made of the same dielectric substrate and conductor considered in Section II and, in all cases, the resonance frequency of the first cavity mode (TM110-like) is 40 GHz ±1%.
The effect of dielectric and metallic losses has been calculated separately and the overall quality factor can be obtained by

where Q d is the quality factor considering ideal metal walls, while Q c is the quality factor considering ideal dielectric medium.
As a reference, we considered a standard box cavity, bounded by continuous metal walls and filled with the same dielectric medium, with the same height and the same resonance frequency of the first mode of the SIW cavity.
The comparison of the quality factors is reported in Fig. 11. The quality factor considering only metallic losses depends on the diameter and spacing of the vias. Larger vias diameter and smaller s/D lead to slightly higher Q c, and this would permit to optimize the cavity behavior.
Quality factors Q c and Q d of SIW cavities compared to quality factor of box cavity, for a resonance frequency of 40 GHz. Box cavity Q c (dotted dashed line), SIW cavities Q c with seven vias per edge (solid gray line with square markers), SIW cavities Q c with six vias per edge (solid gray line with diamond markers), SIW cavities Q d with six and seven vias per edge (square and diamond markers, exactly superimposed), and box cavity Q d (solid black line). The value of s/D for each calculation is reported in the rectangular boxes.

However, also in this case, for this high operating frequency the effect of dielectric losses is by far more relevant than the one of metallic losses and practically does not depend on D and s, thus completely frustrating any possibility to enhance the overall quality factor acting on the spacing and diameter of vias. In fact, Q d is directly related to the loss tangent of the dielectric medium (Q d = 1/tanδ) and, therefore, for these resonating structures, the reduction of the operating frequency is less effective than for the SIW interconnects.
In order to demonstrate this concept, we designed a SIW cavity operating at 10 GHz, considering the same substrate but scaling all the dimensions by a factor of 4. The dielectric quality factor is almost doubled (Q d = 1111) and also the quality factor related to metal losses increases to Q c = 3000.
Therefore, in this situation, it is almost useless to try to enhance the quality factor related to the metal. However, the substrate height is usually not scaled when designing SIW cavities at lower frequencies. By considering a cavity resonating at 10 GHz with h = 0.79 mm, the quality factor related to the metal reduces to Q c = 1050. Although acting on diameter and spacing of the vias permits to slightly modify this value, the overall quality factor remains around Q = 550 since Q c and Q d are comparable.
If the dielectric material exhibits a lower loss tangent and/or the SIW height is lower than in the case considered for this paper, Q c may even be lower than Q d, as reported for example in [Reference Che, Wang, Xu and Li16].
Also in that situation it would be possible to slightly optimize Q c by varying the diameter and spacing of vias. However, as clearly shown in [Reference Che, Wang, Xu and Li16], the impact of vias geometry variations on Q c is small. Thus, as for SIW interconnects, also for SIW cavities a major role for loss optimization is played by the cavity height and the loss tangent of the material.
IV. CONCLUSION
A study of losses in SIWs and cavities has been presented. Three mechanisms of losses have been considered and separately investigated: radiation leakage, ohmic loss, and dielectric loss. A systematic comparison of waveguides with different geometry permitted to give a physical interpretation of the loss mechanisms and to identify design criteria to minimize losses. It has been also shown how the different loss contribution changes with frequency, and that is worth to act on diameter and spacing of the vias to minimize losses, especially at lower frequencies, when metallic losses are comparable or larger than dielectric losses.
A similar analysis was reported also in the case of SIW resonant cavities. For these structures, a different variation of losses with respect to frequency has been found, which reduces the effectiveness of the design criteria established for SIWs.
It is very important to observe that the design guidelines and considerations proposed in this work have a general applicability and can be adopted for a wide range of substrates. In fact, even if the absolute value of the losses at play varies with the substrate adopted, the physical understanding of the loss mechanism, supported by a good agreement with measurements and other simulation results from other works [Reference Xu and Wu3, Reference Bozzi, Pasian, Perregrini and Wu11, Reference Torres-Torres, Romo, Horine, Sanchez and Heck14, Reference Che, Wang, Xu and Li16], is clearly independent from the substrate and it leads to outline the same loss behavior.
 Maurizio Bozzi was born in Voghera, Italy, in 1971. He received the “Laurea” degree in Electronic Engineering and the Ph.D. in Electronics and Computer Science from the University of Pavia, Italy, in 1996 and 2000, respectively. Since 2002, he has been an Assistant Professor in Electromagnetics at the Department of Electronics of the University of Pavia, where he teaches the course of Numerical Techniques for Electromagnetics. He held research positions in various European and American universities, including the Technical University of Darmstadt, Germany, the University of Valencia, Spain, and the Polytechnical University of Montreal, Canada. His research activities concern the development of numerical methods for the electromagnetic modeling of microwave and millimeter-wave components. Dr. Bozzi received the Best Young Scientist Paper Award at the XXVII General Assembly of URSI in 2002, and the MECSA Prize for the best paper presented by a young researcher at the Italian Conference on Electromagnetics in 2000.
 Marco Pasian was born in 1980. He received his M.S. degree “Summa Cum Laude” in Electronic Engineering and his Ph.D. in Electronics and Computer Science from the University of Pavia, Pavia, Italy, in 2005 and 2009, respectively. He is currently a PostDoc of the Department of Electronics of the University of Pavia. His main research interests are periodic structures, antennas and microwave devices for space and defense applications. In 2004, he was a trainee at the European Space Agency, Darmstadt, Germany. In 2005, he was with Carlo Gavazzi Space, Milano, Italy, as system engineer. In 2008, he was guest scientist at TNO, Defence, Security and Safety, The Hague, The Netherlands. Dr. Pasian is a member of IEEE.
 Luca Perregrini was born in Sondrio, Italy, in 1964. He received the “Laurea” degree in Electronic Engineering and the Ph.D. in Electronics and Computer Science from the University of Pavia, Pavia, Italy, in 1989 and 1993, respectively. In 1992, he joined the Department of Electronics of the University of Pavia, where he is now an Associate Professor in electromagnetics. His main research interests are in numerical methods for the analysis and optimization of waveguide circuits, frequency selective surfaces, reflect arrays, and printed microwave circuits. He co-authored the textbook Fondamenti di Onde Elettromagnetiche (Milano, Italy, McGraw-Hill Italia, 2003). Professor Perregrini was an Invited Professor at the Polytechnical University of Montreal, Montreal, Quebec, Canada in 2001, 2002, and 2004. He was a consultant of the European Space Agency and of some European telecommunication companies.
 Ke Wu is a Canada Research Chair Professor in RF and millimeter-wave engineering at Ecole Polytechnique (University of Montreal). He has been Director of the Poly-Grames Research Center. He has authored or co-authored more than 600 referred papers, and a number of books/book chapters and patents. He has held key positions in and has served on various panels and international committees including the chair of many committees and international conferences/symposia. He has served on the editorial/review boards of many journals, transactions, and letters including associate editor, editor, and guest editor. He is an elected IEEE MTT-S AdCom member for 2006–2009 and serves as chair of the IEEE MTT-S Transnational Committee. Dr. Wu was the recipient of many awards and prizes. He is a fellow of the IEEE, a fellow of the Canadian Academy of Engineering, and a fellow of the Royal Society of Canada (The Canadian Academy of the Sciences and Humanities).



