



1. Introduction
The flow around bluff bodies represents a canonical problem in fluid mechanics, important for both fundamental theory and engineering applications. Classical studies on Newtonian fluids by Williamson (Reference Williamson1996) established the foundations of vortex formation and flow separation behind cylinders, while subsequent numerical and experimental investigations have systematically characterized hydrodynamic forces and wake instabilities under varying Reynolds number (
 ${\textit{Re}}_0$
), geometry and confinement. For square cylinders, laminar wakes exhibit decreasing drag with increasing
 ${\textit{Re}}_0$
(Sharma & Eswaran Reference Sharma and Eswaran2004; Jiang & Cheng Reference Jiang and Cheng2018), motivating extensive studies of drag reduction via active control and geometric or confinement modifications (Ambreen & Kim Reference Ambreen and Kim2018; Xu et al. Reference Xu, Wu, Wu, Xue, Wang, Gao and Zhang2023; Verma et al. Reference Verma, Bharti and Barman2024).
In non-Newtonian flows, sharp corners introduce localized regions of high deformation rates and stress concentrations that amplify elastic effects in viscoelastic flows. Such geometric singularities can trigger flow instabilities, such as upstream vortex formation, that are either weaker or absent in circular-cylinder configurations. Consequently, the square cylinder provides a stringent test case for probing the interplay between elasticity and shear-thinning, with relevance to polymer processing, microfluidic device design and enhanced oil recovery operations, where non-Newtonian fluids encounter abrupt geometric changes.
Non-Newtonian fluids offer an alternative route to drag modification. While power-law shear-thinning fluids generally reduce drag, shear-thickening fluids increase it (Dhiman, Chhabra & Eswaran Reference Dhiman, Chhabra and Eswaran2008; Ruz, Castillo & Cruchaga Reference Ruz, Castillo and Cruchaga2021). Polymer additives can also reduce drag (James & Acosta Reference James and Acosta1970; Yang & Dou Reference Yang and Dou2005), though purely elastic fluids may increase it (Xiong, Bruneau & Kellay Reference Xiong, Bruneau and Kellay2010). In unsteady regimes, elasticity can stabilize wakes and attenuate force oscillations (Norouzi, Varedi & Zamani Reference Norouzi, Varedi and Zamani2016; Dhawan, Das & Panigrahi Reference Dhawan, Das and Panigrahi2023), but may enhance resistance, especially with geometric asymmetry (Minaeian, Nili-AhmadAbadi & Norouzi Reference Minaeian, Nili-AhmadAbadi and Norouzi2019). Such effects have implications across polymer processing, pharmaceutical industries, plastic injection moulding, food production, drilling operations and microfluidics (Chhabra & Richardson Reference Chhabra and Richardson1999).
Beyond mean drag, viscoelasticity profoundly influences flow stability and vortex dynamics (Hamid & Sasmal Reference Hamid and Sasmal2023). Newtonian square-cylinder wakes exhibit a critical Reynolds number
 ${\textit{Re}}_{0,cr}$
for the onset of shedding (Rastan et al. Reference Rastan, Alam, Zhu and Ji2022), whereas viscoelastic fluids can become unstable even at creeping
 ${\textit{Re}}_0$
(McKinley, Armstrong & Brown Reference McKinley, Armstrong and Brown1993; Oliveira & Miranda Reference Oliveira and Miranda2005) or suppress vortex shedding entirely. Parametric studies with Phan-Thien–Tanner (PTT) fluids show that extensibility and viscosity ratio significantly affect
 ${\textit{Re}}_{0,cr}$
(Minaeian et al. Reference Minaeian, Nili-AhmadAbadi, Norouzi and Kim2022). Shear-thinning alone can delay unsteadiness and reduce oscillation amplitudes (Sahu, Chhabra & Eswaran Reference Sahin and Owens2009; Pantokratoras Reference Pantokratoras2016), while three-dimensional instabilities respond differently – elasticity suppresses Newtonian mode-B instability and weakens Kelvin–Helmholtz structures (Richter et al. Reference Richter, Iaccarino and Shaqfeh2010, Reference Richter, Iaccarino and Shaqfeh2012), with Floquet analysis revealing altered instability thresholds at moderate
 ${\textit{Re}}_0$
(Richter, Shaqfeh & Iaccarino Reference Richter, Shaqfeh and Iaccarino2011).
Wake structure is also reshaped by non-Newtonian rheology. While Newtonian wakes scale predictably with
 ${\textit{Re}}_0$
(Jiang & Cheng Reference Jiang and Cheng2018), both shear-thinning and viscoelastic–plastic effects shorten recirculation regions (Gupta et al. Reference Gupta, Sharma, Chhabra and Eswaran2003; Raffi, Chauhan & Sasmal Reference Raffi, Chauhan and Sasmal2025), and viscoelastic stresses can further contract wakes, delay vortex formation or generate upstream vortices (Qin et al. Reference Qin, Salipante, Hudson and Arratia2019; Dhawan et al. Reference Dhawan, Das and Panigrahi2023; Sun et al. Reference Sun, Wen, Si, Xie, Li, Cao and Zhu2024). Additional effects include stress focusing near sharp corners (Evans et al. Reference Evans, Junior, Oishi and Neto2022), vortex compaction under rotation (Sahin & Owens Reference Sahu, Chhabra and Eswaran2004) and the emergence of asymmetric or multivortex wakes (Peng et al. Reference Peng, Li, Xiong, Xu and Yu2021).
A distinctive feature of viscoelastic cylinder flows is the formation of upstream vortices, arising from extensional stress build-up and elastic pressure feedback in stagnation regions. These vortices were first observed experimentally and confirmed numerically (Zhao, Shen & Haward Reference Zhao, Shen and Haward2016; Khan & Sasmal Reference Khan and Sasmal2020) around confined circular cylinders, and later shown to occur in cylinder arrays, demonstrating that the phenomenon is not limited to isolated bodies (Shi & Christopher Reference Shi and Christopher2016). The intrinsically three-dimensional character of these vortices was anticipated numerically (Omowunmi Reference Omowunmi and Yuan2010) and later revealed experimentally (Qin et al. Reference Qin, Salipante, Hudson and Arratia2019), demonstrating that beyond a critical
 ${\textit{Wi}}_0$
, the upstream flow becomes unsteady, switches between bistable configurations and propagates via elastic waves. More recent work (Haward, Toda-Peters & Shen Reference Haward, Toda-Peters and Shen2018; Browne, Shih & Datta Reference Browne, Shih and Datta2020; Hopkins, Haward & Shen Reference Hopkins, Haward and Shen2022) systematically mapped vortex evolution and related flow regimes, showing that elasticity, shear-thinning, confinement and competition between elastic stresses and pressure gradients govern the onset of bistability and the sequence of upstream vortex patterns.
Elastic cylinder flows exhibit a rich spectrum of instabilities, extending beyond upstream vortex formation to include bifurcations and symmetry-breaking transitions (Haward et al. Reference Haward, Hopkins, Varchanis and Shen2021). Early studies showed that viscoelastic flow past a cylinder induces streamline shifts and negative wakes driven by normal stresses and their gradients (Dou & Phan-Thien Reference Dou and Phan-Thien2003), while disturbances propagate upstream in canonical geometries (Pan et al. Reference Pan, Morozov, Wagner and Arratia2013) and corner-driven vortices form in sharp microbends (Gulati et al. Reference Gulati, Dutcher, Liepmann and Muller2010). Elastic wake instabilities between widely spaced cylinders reveal transitions breaking time-reversal and mirror symmetries (Varshney & Steinberg Reference Varshney and Steinberg2017), and numerical and experimental studies further confirmed three-dimensional bifurcations and upstream flow modulation (Dhawan et al. Reference Dhawan, Das and Panigrahi2023; Patel, Rothstein & Modarres-Sadeghi Reference Patel, Rothstein and Modarres-Sadeghi2024), including stabilization by upstream predeformation and suppression of vortex-induced vibrations.
The role of shear-thinning in modulating elastic instabilities has been investigated following the foundational work of Harlen (Reference Harlen1990, Reference Harlen2002), showing that polymer extension in the wake alters the flow structure and generates negative wakes. Dou & Phan-Thien (Reference Dou and Phan-Thien2003) demonstrated that shear-thinning viscosity weakens velocity overshoots in the wake, whereas shear-thinning normal stresses enhance them. Recent work established that shear-thinning generally reduces drag and recirculation length while promoting vortex shedding, while elasticity introduces extensional viscosity in the wake that suppresses instabilities and elongates the recirculation region (Şahin & Atalık Reference Şahin and Atalık2019; Peng et al. Reference Peng, Li, Xiong, Xu and Yu2021). Wake dynamics thus reflect competing roles of elasticity and shear-thinning, with elasticity stabilizing the wake and inducing non-monotonic shedding, while shear-thinning promotes vortex shedding and monotonic frequency trends (Chauhan, Raffi & Sasmal Reference Chauhan, Raffi and Sasmal2025; Sun et al. Reference Sun, Guo, Cao, Li and Si2025).
However, the relative contributions of elasticity and shear-thinning to bluff-body wake dynamics remain insufficiently quantified, particularly at high
 ${\textit{Wi}}_0$
. Prior studies often consider one rheological aspect in isolation, focusing on either shear-thinning power-law fluids or purely elastic models, leaving unresolved how these effects compete or cooperate across flow regimes (Richter, Iaccarino & Shaqfeh Reference Richter, Iaccarino and Shaqfeh2010; Minaeian et al. Reference Minaeian, Nili-AhmadAbadi, Norouzi and Kim2022). In particular, the canonical problem of flow past a square cylinder, with its sharp corners and enhanced stress concentrations, is worthy of further investigation to separate and combine these two mechanisms and clarify how viscoelasticity alters flow forces, wake stability and the onset of vortex shedding in geometries of practical and theoretical relevance.
The present study addresses this gap through a systematic comparison of four constitutive models: Newtonian (baseline), Oldroyd-B (pure elasticity), Carreau–Yasuda (CY) (pure shear-thinning) and PTT (combined elasto-thinning). We employ high-fidelity simulations with rheoTool to examine viscoelastic flow over an unprecedented
 ${\textit{Wi}}_0$
range (
 $0.1$
–
 $10^4$
) at fixed
 ${\textit{Re}}_0 = 10$
and
 $\beta = 0.6$
, with numerical stability maintained at large
 ${\textit{Wi}}_0$
via a log-conformation formulation. This methodology enables a quantitative decomposition of rheological contributions to drag modification,
 ${\textit{Re}}_{0,cr}$
shifts and structural wake transformations across regimes. While related elastic or shear-thinning effects have been examined separately, their controlled alignment and direct cross-comparison within a single square-cylinder framework over such an extended
 ${\textit{Wi}}_0$
range remains undocumented systematically.
(a) Graphical abstract: corresponding normal stress difference contours and streamlines, revealing the front, upper and rear vortical structures responsible for the transition. Panel (b) illustrates the evolution of vortex structures behind a bluff body in a viscoelastic fluid, showing the transition from elasticity-dominated (compressed, triangular vortices) to shear-thinning-dominated (expanded vortices) flow regimes with increasing
 ${\textit{Wi}}_0$
.

The work also reveals several flow phenomena of interest, including the emergence of triangular vortex cores associated with geometry-amplified normal-stress gradients within the recirculation region, the suppression and recovery of vortex length across distinct
 ${\textit{Wi}}_0$
regimes, the symmetry breaking of upstream vortices in the purely elastic fluid, and the first observation of upstream vortex formation in an unconfined square-cylinder configuration under high elasticity, a phenomenon reported in confined geometries (Peng et al. Reference Peng, Tang, Li, Zhang and Yu2023).
The phase-diagram framework maps four regimes of wake behaviour, highlighting transitions from Newtonian-like flow to elasticity-dominated, competition, and to shear-thinning dominance at large
 ${\textit{Wi}}_0$
. The graphical abstract in figure 1 provides a summary of the elasto-thinning interactions and the resulting wake transformations across the
 ${\textit{Wi}}_0$
spectrum. These contributions position the square-cylinder wake as a controlled framework for examining elasto-thinning interactions, demonstrating how stress localization induced by sharp geometry, and how wide-ranging Weissenberg-number variations systematically reshape wake topology, stability characteristics and global force behaviour, thus providing quantitative benchmarks and refined physical interpretation for non-Newtonian bluff-body flows.
The remainder of the paper is organized as follows. In § 2 we introduce the problem formulation, governing equations and numerical methodology. In § 3 we present a quantitative analysis of drag modulation across a broad
 ${\textit{Wi}}_0$
range, systematically examining the individual contributions of elasticity versus shear-thinning. In § 4 we investigate elasto-thinning interactions in flow stability through critical Reynolds number variations. In § 5 we explore viscoelastic wake topology evolution and its underlying mechanisms. The main conclusions are summarized in § 6.
2. Mathematical model and numerical approach
2.1. Problem specification and governing equations
The computational domain, illustrated in figure 2, is sized with 10D upstream, 25D downstream and 20D lateral extents to ensure that boundary effects are negligible. Moreover, following Afonso et al. (Reference Afonso, Oliveira, Pinho and Alves2011), the full domain is simulated without imposing symmetry, as asymmetric structures may develop even in steady flow.
Schematic of the two-dimensional, fully axisymmetric domain for flow simulation past a square cylinder. The cylinder with a side length of
 $D$
is positioned
 $10D$
from the upper and lower boundaries,
 $10D$
from the inlet and
 $25D$
from the outlet, thereby capturing the fully developed flow. Boundary conditions include a uniform velocity inlet, zero pressure outlet and symmetry conditions on the top and bottom boundaries.

The governing equations for unsteady, incompressible viscoelastic flow are
 \begin{align} &\qquad \boldsymbol{\nabla } \boldsymbol{\cdot }(\boldsymbol{U}) = 0, \end{align}
 \begin{align} \rho \frac {D\boldsymbol{U}}{Dt} &= -(\boldsymbol{\nabla\! P}) + \boldsymbol{\nabla } \boldsymbol{\cdot }\tilde {\tau }_{\textit{pol}} + \eta _s {\nabla} ^2 \boldsymbol{U}, \end{align}
where
 $U_\infty$
is the velocity vector field,
 $\rho$
is the constant fluid density,
 $P$
represents pressure,
 $\eta _s$
is the solvent viscosity and
 $\tilde {\tau }_{\boldsymbol{pol}}$
is the polymeric stress tensor. The simplified PTT constitutive equation, coupled with continuity and momentum equations (Oliveira Reference Oliveira2001), predicts the polymeric stress field (Phan-Thien & Tanner Reference Phan-Thien and Tanner1977),
 \begin{equation} \lambda \stackrel {\bigtriangledown }{ \tilde {\tau }_{\textit{pol}} } + f_{\textit{GS}} \left (\mathrm{tr}(\tilde {\tau }_{\textit{pol}}) \right ) \tilde {\tau }_{\textit{pol}} = 2\eta _{\textit{pol}} \dot {\tilde {\gamma }}, \end{equation}
where
 $\eta _{\textit{pol}}$
is polymeric viscosity,
 $\lambda$
represents relaxation time and
 $\dot {\tilde {\gamma }} = (\boldsymbol{\nabla } \boldsymbol{U} + (\boldsymbol{\nabla } \boldsymbol{U})^T)/2$
is the rate-of-strain tensor. The Oldroyd upper convected derivative
 $\stackrel {\bigtriangledown }{ \tilde {\tau }_{\textit{pol}} }$
is defined as
 \begin{equation} \stackrel {\bigtriangledown }{ \tilde {\tau }_{\textit{pol}} } = \frac {\partial \tilde {\tau }_{\textit{pol}}}{\partial t} + \boldsymbol{U} \boldsymbol{\cdot }\boldsymbol{\nabla } \tilde {\tau }_{\textit{pol}} - (\boldsymbol{\nabla }\boldsymbol{U})^T \boldsymbol{\cdot }\tilde {\tau }_{\textit{pol}} - \tilde {\tau }_{\textit{pol}} \boldsymbol{\cdot }\boldsymbol{\nabla }\boldsymbol{U}. \end{equation}
The function
 $f_{\textit{GS}}$
, which is a function of the trace of the polymeric stress tensor, is given by (Phan-Thien Reference Phan-Thien1978)
 \begin{equation} f_{\textit{GS}} = \exp \left (\frac {\varepsilon \lambda }{\eta _{\textit{pol}}} tr(\tilde {\tau }_{\textit{pol}})\right )\!, \end{equation}
where
 $\varepsilon$
is the first parameter of the PTT model. This function
 $f_{\textit{GS}}$
reduces to unity (
 $f_{\textit{GS}}=1$
) for the Oldroyd-B model. For comparison, a purely shear-thinning generalized Newtonian fluid is modelled using the CY constitutive equation. In this case, the extra stress tensor is defined as
 \begin{equation} \tilde {\tau } = 2 \eta \big(|\dot {\tilde {\gamma }}|\big) \dot {\tilde {\gamma }}, \end{equation}
where the shear-rate-dependent viscosity function is given by
 \begin{equation} \eta (|\dot {\tilde {\gamma }}|) = \eta _\infty + (\eta _0 - \eta _\infty ) \left [ 1 + (\lambda _c |\dot {\tilde {\gamma }}|)^{a} \right ]^{\frac {n-1}{a}}, \end{equation}
and the magnitude of the shear rate is defined as
 $|\dot {\gamma }| = \sqrt {2 \dot {\tilde {\gamma }} : \dot {\tilde {\gamma }}}$
. Here,
 $\eta _0$
and
 $\eta _\infty$
denote the zero- and infinite-shear-rate viscosities, respectively,
 $\lambda _c$
is a time constant,
 $n$
is the power-law index and
 $a$
is the Yasuda parameter controlling the transition sharpness.
The key dimensionless groups are
 ${\textit{Re}}_0$
,
 ${\textit{Wi}}_0$
and retardation ratio
 $\beta$
, defined as
 \begin{equation} {\textit{Re}}_0=\frac {\rho U_\infty D}{\eta _0}, \quad {\textit{Wi}}_0=\frac {\lambda U_\infty }{D}, \quad \beta =\frac {\eta _{\textit{pol}}}{\eta _0}, \quad C_P=\frac {P-P_{\textit{ref}}}{0.5 \rho {U_\infty }^2}, \end{equation}
where
 $P_{\textit{ref}}$
is reference pressure and
 $\beta$
is the retardation ratio, set to 0.6. Boundary conditions are summarized in table 1. Symmetry boundary conditions are applied at the top and bottom boundaries, sufficiently far from the square cylinder to allow cross-stream velocity and viscoelastic stresses to decay to nearly uniform profiles, with a posteriori verification confirming that elastic normal stresses and wake dynamics are insensitive to further vertical extension. For
 $\tau _{\textit{pol}}$
, we employ a second-order linear extrapolation boundary condition to accurately capture the steep stress gradients that develop near the sharp corners of the cylinder. This method computes the value of each stress component on a boundary face,
 $\tau _{{\textit{ij}},f}$
, using a Taylor series expansion from the adjacent cell centre
 $P$
(Pimenta & Alves 2017, Reference Pimenta and Alves2018),
 \begin{equation} \tau _{{\textit{ij}},f} = \tau _{{\textit{ij}},P} + (\boldsymbol{\nabla }\tau _{\textit{ij}})_P \boldsymbol{\cdot }\boldsymbol{d}_{\textit{Pf}}, \end{equation}
where
 $\tau _{{\textit{ij}},P}$
is the value at the cell centre,
 $(\boldsymbol{\nabla }\tau _{\textit{ij}})_P$
is its gradient evaluated at the same location using values from the previous iteration and
 $\boldsymbol{d}_{\textit{Pf}}$
is the vector connecting the cell centre to the face centre.
Boundary conditions. Here,
 $n$
denotes the normal vector at the boundary.

2.2. Numerical method
The governing equations were discretized using the finite-volume framework implemented in rheoTool (Pimenta & Alves Reference Pimenta and Alves2018), an open-source toolbox for viscoelastic flow simulations built on top of OpenFOAM. A second-order spatial discretization scheme was employed for both convective and diffusive terms. The pressure–velocity coupling was handled using the semi-implicit method for pressure linked equations-consistent algorithm.
To overcome the well-known convergence difficulties associated with high
 ${\textit{Wi}}_0$
, the log-conformation representation proposed by Fattal & Kupferman (2004, Reference Fattal and Kupferman2005) is employed in this work. This method stabilizes numerical simulations in highly elastic regimes and is implemented in the solver rheoFoam by Pimenta & Alves (Reference Pimenta and Alves2017). The constitutive equation is reformulated in terms of the conformation tensor
 \begin{equation} \tilde {\tau }_{{\textit{pol}}} = \frac {\eta _{{\textit{pol}}}}{\lambda } \big(\tilde A - \tilde I\big). \end{equation}
The conformation tensor
 $\tilde A$
is diagonalized (
 $\tilde A = \tilde R \varLambda \tilde R^T$
), and
 $\tilde \varTheta$
is defined as the natural logarithm of
 $\tilde A$
,
 \begin{equation} \tilde \varTheta = \ln \big(\tilde A\big) = \tilde R \ln \big(\tilde \varLambda \big) \tilde R^T, \end{equation}
which leads to the following form of the constitutive equation:
 \begin{equation} \frac {\partial \tilde \varTheta }{\partial t}+ \boldsymbol{U} \boldsymbol{\cdot }\tilde{ \boldsymbol{\nabla }}\tilde \varTheta - \big(\tilde \varOmega \tilde \varTheta - \tilde \varTheta \tilde \varOmega \big) -2 \tilde B = \tilde R\left[\frac {1}{\lambda }\big(\tilde \varLambda ^{-1}- \tilde I\big)\right] \tilde R^T, \end{equation}
where
 $\tilde B$
is a diagonal tensor and
 $\tilde \varOmega$
is an antisymmetric tensor
 \begin{equation} \tilde \varOmega = \tilde R \begin{bmatrix} 0 & \omega _{\textit{xy}} & \omega _{\textit{xz}} \\[3pt] -\omega _{\textit{xy}} & 0 & \omega _{\textit{yz}} \\[3pt] -\omega _{\textit{xz}} & -\omega _{\textit{yz}} & 0 \end{bmatrix} \tilde R^T, \quad \tilde B = \tilde R \begin{bmatrix} m_{\textit{xx}} & 0 & 0 \\[3pt] 0 & m_{\textit{yy}} & 0 \\[3pt] 0 & 0 & m_{\textit{zz}} \end{bmatrix} \tilde R^T. \end{equation}
The components
 $\omega _{\textit{ij}}$
and
 $m_{ii}$
are calculated as
 \begin{equation} \omega _{\textit{ij}} = \frac {\varLambda _j m_{\textit{ij}} + \varLambda _i m_{\textit{ji}} }{\varLambda _j - \varLambda _i} , \quad \tilde M= \tilde R \boldsymbol{\cdot }{(\boldsymbol{\nabla } \boldsymbol{U})}^T \tilde R^T. \end{equation}
Furthermore, to ensure accurate prediction of the transformed variable at cell faces, the high-resolution convergent and universally bounded interpolation scheme for the treatment of advection scheme (Alves et al. Reference Alves, Oliveira and Pinho2003a ) is utilized for discretizing the convective terms in the conservation equations. Interpolation of variables to cell faces is performed using a linear method, while Laplacian terms are discretized using a second-order central differencing scheme. We verified the numerical method through grid and time step independence tests and solver validation (details are provided in Appendix A).
A further numerical consideration arises from the presence of sharp corners in the square cylinder geometry. For viscoelastic fluids described by differential constitutive models, such geometric singularities can, in theory, induce stress singularities in the solution of the continuum equations (Hinch Reference Hinch1993; Renardy Reference Renardy1995). The asymptotic behaviour of these stresses, typically following a power-law decay
 $\tau \sim r^{-\beta '}$
with distance
 $r$
from the corner, is not universal; it depends critically on the specific constitutive model and its parameters (Renardy Reference Renardy1997; Evans Reference Evans2010a
,
Reference Evansb
). Notably, for the PTT model with a solvent contribution (
 $\beta =0.6$
), theoretical analyses indicate a weakened singularity relative to purely elastic models (Evans Reference Evans2010b
; Evans et al. Reference Evans, Junior, Oishi and Neto2022). While the log-conformation formulation employed here is designed to stabilize computations in regions of high stress, a dedicated numerical verification of the stress field in the immediate vicinity of the cylinder corners is imperative to confirm the robustness of our simulations. This analysis, following the framework of numerical verification established in recent literature (Evans et al. Reference Evans, Junior, Oishi and Neto2022), is presented in Appendix B.
3. Quantitative analysis of drag modulation
3.1. Overall drag behaviour across constitutive models
To investigate drag variations induced by viscoelasticity, we simulated numerous cases spanning four constitutive models over a wide range of
 ${\textit{Wi}}_0$
, with figure 3(a) presenting the drag coefficient on the left-hand vertical axis and the corresponding percentage change relative to the Newtonian case on the right-hand vertical axis. As expected, the drag coefficient remains constant with
 ${\textit{Wi}}_0$
for a Newtonian fluid. The Oldroyd-B model was used to isolate purely elastic effects; however, simulations at high Weissenberg numbers remain notoriously challenging. Although the log-conformation formulation improves numerical stability, it still requires exceptionally fine meshes and small time steps, which often limits systematic parametric studies due to computational cost (Afonso et al. Reference Afonso, Oliveira, Pinho and Alves2011). Since the PTT model exhibits nearly pure elastic behaviour at low values of
 $\varepsilon$
, its results for
 $\varepsilon = 0.0001$
are close to those of the Oldroyd-B model. The results show that increasing
 ${\textit{Wi}}_0$
strengthens elastic forces, leading to a monotonic increase in drag. The highest
 ${\textit{Wi}}_0$
for which convergence was achieved was
 ${\textit{Wi}}_0 = 5$
, where elasticity increased the drag coefficient by up to 85 %. Although numerical solutions for purely elastic cases face limitations at high
 ${\textit{Wi}}_0$
, the drag coefficient is expected to increase more gradually with
 ${\textit{Wi}}_0$
and asymptotically approach a constant value. In contrast, the equivalent CY model exhibits a monotonic drag reduction with increasing
 ${\textit{Wi}}_0$
due to shear-thinning effects. The drag coefficients for the CY model are close to the Newtonian values, indicating a relatively weak shear-thinning effect that further validates the dominance of elastic effects captured by the Oldroyd-B model.
Variations of (a) the drag coefficient
 $C_D$
with
 ${\textit{Wi}}_0$
, and (b) the normalized drag coefficient
 $C_D/C_{D,{\textit{Ne}w\textit{t}}}$
with
 ${\textit{Wi}}_r$
for all viscoelastic models and their corresponding CY fluids. For PTT fluids, a distinct intermediate-
 ${\textit{Wi}}_r$
peak appears, diminishing with
 $\varepsilon$
. The right-hand ordinates show the percentage change relative to
 $C_{D,{\textit{Ne}w\textit{t}}}$
.

While the trends in figure 3(a) are interpreted using the conventional definitions of the dimensionless groups based on the zero-shear viscosity
 $\eta _0$
, in viscoelastic fluids the effective viscosity,
 $\eta _{eff}$
, varies across the flow field. In such cases,
 $\eta _0$
, although appropriate for Newtonian fluids and constant-viscosity models, may not represent the viscosity governing momentum transport in regions where the characteristic deformation rates are finite.
Thompson & Oishi (Reference Thompson and Oishi2021) noted that defining
 ${\textit{Re}}_0$
and
 ${\textit{Wi}}_0$
solely via
 $\eta _0$
can be misleading, as it fails to reflect the rheological state at relevant deformation rates, and proposed using an effective viscosity evaluated at a characteristic shear rate. Figueiredo et al. (Reference Figueiredo, Oishi, Pinho and Thompson2024) also emphasized that for external flows, the characteristic rate should be chosen from regions where dominant stresses develop, for more consistent cross-model comparisons. With the conventional parameters
 ${\textit{Re}}_0=\rho U_\infty D/\eta _0$
and
 ${\textit{Wi}}_0=\lambda U_\infty /D$
, we introduce the rescaled definitions
 \begin{align} {\textit{Re}}_r=\frac {\rho U_\infty ^2}{\tau _c},\quad \tau _c=\eta _{\textit{eff}}\,\dot {\gamma }_c, \qquad {\textit{Wi}}_r=\lambda \,\dot {\gamma }_c, \end{align}
where
 $\eta _{\textit{eff}}$
is evaluated from the steady shear material functions calculated in Appendix C at a characteristic shear rate
 $\dot {\gamma }_c$
. For external flows past bluff bodies, no universally established definition of
 $\dot {\gamma }_c$
exists (Thompson & Oishi Reference Thompson and Oishi2021; Figueiredo et al. Reference Figueiredo, Oishi, Pinho and Thompson2024). The choice must therefore be chosen to be consistent with the dominant stress-producing regions of the flow.
We solve each viscoelastic configuration using the nominal parameters
 $({\textit{Re}}_0,{\textit{Wi}}_0)$
and define
 $\dot {\gamma }_c$
as the surface-averaged shear-rate magnitude on the cylinder, i.e.
 $\dot {\gamma }_c = \langle |\dot {\gamma }| \rangle {\text{surface}}$
. This choice reflects that the cylinder surface constitutes the primary interface through which viscous and elastic stresses are transmitted to the body and thus determine the drag force. Accordingly, the largest deformation rates occur near the upstream leading corners of the square cylinder, where stress gradients are most intense.
Using these
 $\eta _{\textit{eff}}$
values, we compute an equivalent Newtonian flow to establish a consistent reference for drag comparisons. This procedure enables the drag trends to be examined under a scaling that more faithfully reflects the local rheological state governing momentum transport in the vicinity of the body.
Recasting the results in terms of the rescaled groups
 ${\textit{Re}}_r$
and
 ${\textit{Wi}}_r$
preserves the qualitative trends observed in the classical
 $C_D$
–
 ${\textit{Wi}}_0$
representation in figure 3(a), while providing a sharper separation between elastic and shear-thinning effects. Figure 3(b) shows the normalized drag coefficient
 $C_D/C_{D_{\textit{Newt}}}$
with the rescaled Weissenberg number
 ${\textit{Wi}}_r$
for all viscoelastic models and their equivalent CY fluids.
The PTT reveals a distinct intermediate-
 ${\textit{Wi}}_r$
drag amplification. For
 $\varepsilon = 0.01$
, the normalized drag increases with elasticity and reaches a pronounced maximum of
 $C_D/C_{D_{\textit{Newt}}} \approx 1.41$
at
 ${\textit{Wi}}_r \approx 20$
, before gradually relaxing towards unity at larger
 ${\textit{Wi}}_r$
. When
 $\varepsilon$
increases to
 $0.1$
, the peak becomes weaker with
 $C_D/C_{D_{\textit{Newt}}} \approx 1.14$
and confined to a narrower interval, indicating that stronger shear-thinning suppresses the magnitude and persistence of elastic drag amplification. In the Oldroyd-B limit with
 $\varepsilon \to 0$
, where shear-thinning is negligible, the drag increases monotonically over the converged range, reflecting the purely elastic contribution. The absence of high-
 ${\textit{Wi}}_r$
data is attributed to the high-Weissenberg-number limitations of the model.
Moreover, the drag coefficient of the equivalent CY model corresponding to the PTT fluid with
 $\varepsilon = 0.01$
decreases monotonically with increasing
 ${\textit{Wi}}_0$
. In contrast, the PTT model with
 $\varepsilon = 0.01$
exhibits a non-monotonic variation of
 $C_D$
with
 ${\textit{Wi}}_0$
, which can be divided into four regimes. For
 ${\textit{Wi}}_0 \lt 0.1$
, the drag remains constant and equal to the Newtonian value. For
 $0.1 \lt {\textit{Wi}}_0 \lt 6$
, corresponding to
 $0.17 \lt {\textit{Wi}}_r \lt 10.9$
, the total drag increases by approximately
 $15\,\%$
. Beyond this range,
 $C_D$
gradually decreases with increasing
 ${\textit{Wi}}_0$
, indicating a transition towards a shear-thinning-dominated regime. For
 ${\textit{Wi}}_0 \gtrsim 6$
, drag reduction becomes monotonic, and the PTT drag coefficient approaches the CY limit, confirming that viscosity-reduction mechanisms dominate over elastic effects at sufficiently large deformation rates.
The CY models isolate the role of shear-thinning. The CY curves remain close to unity across the entire
 ${\textit{Wi}}_r$
range for both
 $\varepsilon =0.01$
and
 $0.1$
, exhibiting only minor deviations before asymptotically approaching one at large
 ${\textit{Wi}}_r$
. This indicates that shear-thinning alone does not produce a systematic drag reduction when the reference viscosity is taken as
 $\eta _{\textit{eff}}$
.
Overall, the
 ${\textit{Wi}}_r$
formulation demonstrates that the maximum drag amplification is intrinsically associated with intermediate elasticity levels, whereas the strong drag reduction observed at large
 ${\textit{Wi}}_0$
is predominantly governed by the reduction of effective viscosity. The rescaled representation therefore offers a more discriminating framework for interpreting drag modulation in viscoelastic shear-thinning flows.
Simulating viscoelastic flow at
 ${\textit{Wi}}_0$
s up to
 $10^4$
raises questions about the physical basis of the constitutive models in this extreme regime. The asymptotic return towards Newtonian-like behaviour observed at extreme
 ${\textit{Wi}}_0$
reflects the finite extensibility of polymer chains represented in certain models. As in PTT, the polymer molecules approach their full extension under intense deformation, causing elastic stresses to plateau and eventually saturate (Lieu et al. Reference Lieu, Jovanović and Kumar2013). This saturation mechanism is consistent with the finite extensibility of real polymer chains and leads to convergence towards a viscosity-matched Newtonian reference, with the convergence rate governed by the shear-thinning parameter
 $\varepsilon$
. By contrast, models lacking finite extensibility, such as the Oldroyd-B, predict unbounded stress growth and exhibit no such recovery. Furthermore, the presence of a solvent viscosity with
 $\beta = 0.6$
reinforces the Newtonian character of the velocity field in high-deformation regions, as demonstrated in Evans et al. (Reference Evans, Junior and Oishi2017). While the observed trends reflect the PTT model’s finite extensibility and high-rate polymer behaviour, they cannot be generalized to all viscoelastic models, as recovery depends on specific parameters and rheology. Direct experimental validation at such extreme
 ${\textit{Wi}}_0$
remains elusive, but the qualitative agreement with the finite chain extensibility supports the physical plausibility of the observed saturation.
3.2. Drag analysis in elasticity-dominated flows
For the analysis of the drag force variation with
 ${\textit{Wi}}_0$
, we calculate the individual contributions of pressure, Newtonian stress and polymeric stress components to the total drag coefficient. The drag coefficient can be decomposed as
 \begin{equation} F_D = F_{D_P} + F_{D_s} + F_{D_{{\textit{pol}}}}, \end{equation}
where
 $F_{D_P}$
is the pressure drag force,
 $F_{D_s}$
is the drag force due to Newtonian (solvent) stress and
 $F_{D_{{\textit{pol}}}}$
is the drag force due to polymeric stress,
 \begin{align} F_{D_s} &= \int \tau _{s_{\textit{xx}}} \text{d}A_x + \int \tau _{s_{\textit{xy}}} \text{d}A_y, \end{align}
 \begin{align} F_{D_{{\textit{pol}}}} &= \int \tau _{{\textit{pol}}_{\textit{xx}}} \text{d}A_x + \int \tau _{{\textit{pol}}_{\textit{xy}}} \text{d}A_y, \end{align}
where
 $\tau _{s_{\textit{xx}}}$
,
 $\tau _{s_{\textit{xy}}}$
and
 $\tau _{s_{\textit{yy}}}$
are the Newtonian stress tensor components. Figure 4(a) shows these components as functions of
 ${\textit{Wi}}_0$
for the Oldroyd-B fluid. The contributions of
 $C_{D_s}$
and
 $C_{D_{{\textit{pol}}}}$
to the total drag are significantly small and decrease with
 ${\textit{Wi}}_0$
, whereas
 $C_{D_P}$
increases monotonically and dominates the total drag. This indicates that elasticity influence the drag not only through
 $C_{D_{{\textit{pol}}}}$
but also by altering the pressure distribution. A systematic decomposition of the pressure drag into its underlying stress components is therefore warranted; the derivation is provided in the Supplementary materials (note 2). The contribution
 $C_{\textit{DN}}$
from
 $\tau _{\textit{xx}}$
and the normal-stress contribution
 $C_{\textit{DPn}}$
remain negligible across all
 ${\textit{Wi}}_0$
, while
 $C_{\textit{DPt}}$
, which is governed by shear stress, increases with
 ${\textit{Wi}}_0$
. Combining with the opposing trend of
 $C_{\textit{DPn}}$
yields a net monotonic rise in pressure drag. The growing pressure difference between the upstream and downstream sides of the cylinder, evident in the pressure coefficient distributions of figure 4(b), explains this enhancement.
Variations with
 ${\textit{Wi}}_0$
of (a) the drag-coefficient components:
 $C_{\textit{DN}}$
, contribution from
 $\tau _{\textit{xx}}$
;
 $C_{\textit{DPn}}$
and
 $C_{\textit{DPt}}$
, the pressure contributions from normal and shear stresses, respectively; together with the solvent contribution
 $C_{D_s}$
, the polymeric contribution
 $C_{D_{{\textit{pol}}}}$
, the pressure drag
 $C_{D_P}$
and the total drag
 $C_D$
; and (b) the pressure coefficient along the cylinder surface at different
 ${\textit{Wi}}_0$
for the Oldroyd-B model.

3.3. Shear-thinning and elasto-thinning drag mechanisms
We now investigate the regime where shear-thinning effects emerge and compete with elasticity. These effects are primarily governed by the PTT model parameter
 $\varepsilon$
, which controls the fluid’s extensional viscosity and shear-thinning intensity (Ferrás et al. Reference Ferrás, Nóbrega and Pinho2012; Phan-Thien Reference Phan-Thien1978). At small
 $\varepsilon$
values, the fluid behaviour is nearly purely elastic. Increasing
 $\varepsilon$
activates pronounced shear-thinning alongside elasticity, resulting in complex viscoelastic behaviour in which the two effects can either compete or synergize.
To disentangle the individual contribution of shear-thinning from the combined viscoelastic response, we employ an equivalent CY model for each PTT fluid by matching the steady shear viscosity profiles
 $\eta (\dot {\gamma })$
of the two models over a wide range of shear rates. For a given PTT fluid with specific
 $\lambda$
,
 $\varepsilon$
and
 $\beta$
, we first compute its shear viscosity function by solving the constitutive equation in a homogeneous simple shear flow. The parameters of the CY model, namely the zero-shear-rate viscosity
 $\eta _0$
, the power-law index
 $n$
, the time constant
 $\lambda _c$
and the Yasuda exponent
 $a$
, are then determined via a nonlinear least-squares regression fit to this PTT viscosity data so that the two models exhibit virtually identical viscous resistance in any purely shear-driven flow. By comparing the PTT results with those of its shear-viscosity-matched CY counterpart, we directly isolate the effects arising specifically from fluid elasticity. The complete numerical procedure for calculating material functions and performing the curve fit is documented in Appendix C, where the parameters for the equivalent CY model corresponding to a PTT fluid with different values of
 $\varepsilon$
are presented in detail.
To elucidate the origin of the shear-thinning and elasto-thinning drag mechanisms observed in figure 3(a), we decompose the drag coefficient into its constituent components as shown in figure 5(a). The results confirm that
 $C_{DP}$
remains the dominant contributor to total drag across all
 ${\textit{Wi}}_0$
, whereas
 $C_{\textit{DN}}$
and
 $C_{Ds}$
remain comparatively smaller throughout the entire range of
 ${\textit{Wi}}_0$
. Among the pressure contributions,
 $C_{\textit{DPt}}$
is the more influential term, while
 $C_{\textit{DPn}}$
also rises at low
 ${\textit{Wi}}_0$
and contributes to the emergence of the drag maximum. As
 ${\textit{Wi}}_0$
increases further, the steady reduction in total drag is driven primarily by the decline of
 $C_{\textit{DPt}}$
, while the direct polymeric stress contribution rapidly becomes negligible.
(a) Variations of the different components of drag coefficient with
 ${\textit{Wi}}_r$
for PTT model with
 $\varepsilon = 0.01$
(b) Distribution of pressure coefficient along the cylinder surface at different
 ${\textit{Wi}}_0$
s for PTT model with
 $\varepsilon = 0.01$
.

Figure 5(b) further shows that the pressure asymmetry between the upstream and downstream sides of the cylinder intensifies precisely in the intermediate
 ${\textit{Wi}}_0$
range where the drag attains its maximum. As
 ${\textit{Wi}}_0$
increases, rear-surface suction diminishes, leading to a reduction in pressure drag and, consequently, in the overall drag coefficient.
To further examine the trend observed in figure 3(b), where the drag coefficient ratio of the equivalent CY model for the PTT fluid with
 $\varepsilon = 0.01$
increases relative to its Newtonian counterpart, we decompose the drag coefficient of the CY model into its constituent components. Figure 6(a) presents the variations of the ratios of friction drag, pressure drag and total drag of the equivalent CY fluid, corresponding to PTT with
 $\varepsilon =0.01$
, to their respective values in the equivalent Newtonian fluid. Although all absolute drag components for both the CY and Newtonian fluids, denoted by the light-green curves, decrease with increasing
 ${\textit{Wi}}_r$
, differences in the rate of drag reduction induced by shear-thinning lead to distinct trends in the drag ratios. For the PTT fluid with
 $\varepsilon = 0.1$
, the total-, pressure- and friction-drag ratios initially increase to their respective maxima at
 ${\textit{Wi}}_r = 47$
,
 ${\textit{Wi}}_r = 20$
and
 ${\textit{Wi}}_r = 47$
, and subsequently decrease, almost coinciding at large
 ${\textit{Wi}}_r$
. The pressure drag peaks first and reaches the largest value, followed by the total drag, while the friction drag initially decreases with increasing
 ${\textit{Wi}}_r$
up to
 ${\textit{Wi}}_r = 3$
, before rising sharply to its maximum. These trends suggest that shear thinning mainly alters the pressure drag by modifying the flow structure, e.g. vortex size and separation location, thereby altering the surface pressure distribution, while its effect on friction drag is comparatively weak. Notably, despite the initial reduction in friction drag, the total drag largely follows the evolution of the pressure drag.
The influence of the material parameter
 $\varepsilon$
is illustrated in figure 6(b) for
 $\varepsilon = 0.1$
. Increasing
 $\varepsilon$
intensifies the shear-thinning and consequently reduces the amplitude of elastic drag enhancement in the low-
 ${\textit{Wi}}_r$
regime. As a result, the drag maximum is smaller compared with
 $\varepsilon = 0.01$
and occurs at a lower
 ${\textit{Wi}}_r$
. Moreover, drag reduction at large
 ${\textit{Wi}}_r$
becomes more pronounced, reflecting the stronger viscosity decrease with larger
 $\varepsilon$
values.
(a) Normalized drag coefficient components of the CY fluid (
 $\varepsilon = 0.01$
, left-hand ordinate) and the corresponding absolute drag coefficients
 $C_{D,\text{CY}}$
(dash–dotted line) and
 $C_{D,{\textit{Ne}w\textit{t}}}$
(dotted line, right-hand ordinate) as functions of
 ${\textit{Wi}}_r$
. (b) Variations of the different components of
 $C_D$
with
 ${\textit{Wi}}_r$
for PTT fluid with
 $\varepsilon = 0.1$
.

It is noteworthy that, with the exception of the Oldroyd-B model, which represents a purely elastic behaviour, all viscoelastic cases converge towards a common asymptotic drag coefficient at very large
 ${\textit{Wi}}_r$
. This convergence towards the CY limit suggests that, in the high-
 ${\textit{Wi}}_r$
regime, the flow is effectively controlled by shear-thinning rather than elastic stress accumulation, which is characteristic of models with finite extensibility, such as PTT, where the maximum extensional viscosity saturates (Housiadas & Beris Reference Housiadas and Beris2005). Moreover, the rate of convergence depends on the PTT parameter
 $\varepsilon$
and the viscosity-matched CY fitting, as larger
 $\varepsilon$
values lead to earlier and more pronounced recovery.
4. Elasto-thinning interactions in flow stability
4.1. Emergence of vortex shedding: a comparative onset dynamics
Viscoelasticity can substantially modify the onset of vortex shedding, as Newtonian fluids typically become unstable only at high
 ${\textit{Re}}_0$
, whereas viscoelastic fluids may shed vortices even at low
 ${\textit{Re}}_0$
under high
 ${\textit{Wi}}_0$
(Dey, Modarres-Sadeghi & Rothstein Reference Dey, Modarres-Sadeghi and Rothstein2018; Minaeian et al. Reference Minaeian, Nili-AhmadAbadi, Norouzi and Kim2020). We investigate the flow around a square cylinder to determine the
 ${\textit{Re}}_{0,cr}$
at which vortex shedding commences over a wide range of
 ${\textit{Wi}}_0$
s. To ensure a consistent and model-independent determination of
 ${\textit{Re}}_{0,cr}$
, we adopt a controlled perturbation procedure in which, for each
 ${\textit{Wi}}_0$
, the flow is first advanced in time until a steady state is obtained at a Reynolds number slightly below the expected transition. A prescribed sinusoidal disturbance is then superimposed onto the converged steady velocity field over the entire computational domain according to
 \begin{align} u_y^{\,\textit{pert}} = u_y^{\textit{steady}} + 0.01U_{\infty }\sin \!\left (\frac {2\pi y}{L_y}\right )\!, \end{align}
where
 $0.01U_{\infty }$
is the perturbation amplitude and
 $L_y$
is the domain height. The perturbed field is subsequently used as the initial condition for time-dependent simulations. The onset of periodic flow is identified based on the sustained growth of the imposed perturbation and the emergence of persistent oscillations in the
 $C_L$
. The temporal evolution of the disturbance is monitored using velocity probes placed in the wake at
 $(1,\,0.25)$
and
 $(2,\,0)$
. If the oscillation amplitude decays below
 $10^{-6}$
of the imposed perturbation, the flow is deemed stable; sustained growth towards a finite-amplitude periodic state indicates that
 ${\textit{Re}}_0$
exceeds
 ${\textit{Re}}_{0,cr}$
. This procedure is repeated for successive Reynolds numbers to accurately bracket the critical value.
Near the critical condition, the simulations were continued for at least 100–200 shedding periods when oscillations developed, until the variations of
 $C_{L,\textit{max}}$
and
 $C_{D,\textit{max}}$
fell below
 $0.01\,\%$
, indicating amplitude saturation. After apparent convergence of the limit-cycle amplitude, the computations were further extended for an additional 50 shedding periods to ensure statistical stationarity. In cases where decay occurred, the calculation was continued until the perturbation amplitude dropped below the prescribed
 $10^{-6}$
threshold, which was selected to be well above the intrinsic numerical noise level of the solver. Additional tests with different perturbation amplitudes confirmed that the identified
 ${\textit{Re}}_{0,cr}$
remained within the reported
 $\pm 0.5$
uncertainty. Further extension of integration time did not alter the stability classification. Figure 7 presents representative probe signals below and at
 ${\textit{Re}}_{0,cr}$
, demonstrating exponential decay in the stable regime and sustained oscillations at criticality for the PTT fluid with
 $\varepsilon = 0.01$
at
 ${\textit{Wi}}_0 = 0.1$
.
Temporal evolution of the transverse velocity at
 $(1,0.25)$
after a controlled perturbation for PTT model with
 $\varepsilon = 0.01$
at
 ${\textit{Wi}}_0 = 0.1$
: below
 ${\textit{Re}}_{0,cr}$
, the disturbance decays; at
 ${\textit{Re}}_{0,cr}$
, sustained oscillations develop, marking the onset of vortex shedding.

We compare the individual effects of shear-thinning and elasticity on
 ${\textit{Re}}_{0,cr}$
in figure 8, which shows the time evolution of
 $C_D$
and
 $C_L$
at
 ${\textit{Wi}}_0=1$
for
 ${\textit{Re}}_0=47$
and
 $53$
, along with the corresponding shedding frequencies
 $f_{\textit{CL}}$
and drag amplitudes
 $\Delta C_D$
for each case.
Development from steady to unsteady flow via the onset of vortex shedding for: (a) Newtonian fluid, (b) elasticity-dominated, (c,e) viscoelastic and (d, f) shear-thinning regimes at two Reynolds numbers with
 ${\textit{Re}}_0 = 47$
(red, drag coefficient; black, lift coefficient) and
 ${\textit{Re}}_0 = 53$
(orange, drag coefficient; grey: lift coefficient).

Comparison between the Newtonian and CY models with
 $\varepsilon = 0.01$
and
 $0.1$
shows that stronger shear-thinning reduces the time required for the onset of vortex shedding and increases both
 $\Delta C_D$
and
 $f_{\textit{CL}}$
; indeed, the CY fluids already exhibit unsteady shedding at
 ${\textit{Re}}_0 = 47$
(figures 8
a, 8
d and 8
f). In contrast, the Oldroyd-B fluid remains steady at
 ${\textit{Re}}_0 = 47$
(figure 8
b), indicating that elasticity alone delays the transition to unsteadiness. The PTT models with
 $\varepsilon = 0.01$
and
 $0.1$
are also completely steady at
 ${\textit{Re}}_0 = 47$
(figures 8
c and 8
e), demonstrating that for
 ${\textit{Wi}}_0 = 1$
elastic effects overcome shear-thinning and that viscoelasticity as a whole postpones the onset of vortex shedding.
From a physical perspective, the elasticity of viscoelastic fluids consumes a portion of the flow energy to overcome elastic forces. This energy dissipation contributes to greater flow stability and delays the onset of instabilities such as vortex shedding. These findings highlight the complex interplay between elasticity and shear-thinning in viscoelastic flows, with elasticity acting as a stabilizing factor and shear-thinning promoting earlier transition to unsteady behaviour.
To further validate these observations, we monitor velocity values at several points in the wake region, which yields consistent results with the drag and lift coefficients for all cases; a representative example is shown in figure 7 for the PTT fluid with
 $\varepsilon = 0.01$
at
 ${\textit{Wi}}_0 = 0.1$
.
4.2. Mapping the stability boundary:
 ${\textit{Re}}_{0,cr}$
versus
${\textit{Wi}}_0$


To investigate the effects of elasticity and shear-thinning on vortex shedding, we conduct simulations across the full range of
 ${\textit{Wi}}_0$
(
 $0$
–
 $10\,000$
) for four constitutive models to determine the critical Reynolds number,
 ${\textit{Re}}_{0,cr}$
. Each simulation corresponds to a distinct
 ${\textit{Re}}_0$
, incremented in small steps, so that
 ${\textit{Re}}_{0,cr}$
is identified within an interval of
 $\pm 0.5$
. Multiple unsteady simulations capture the onset of time-dependent flow, with velocity and pressure signals characterizing the transitional dynamics.
Figure 9(a) summarizes the results for
 ${\textit{Re}}_{0,cr}$
, marking where the vortex shedding happens. The flow exhibits Newtonian behaviour for
 ${\textit{Wi}}_0 \lt 0.1$
, while
 ${\textit{Re}}_{0,cr}$
decreases with
 ${\textit{Wi}}_0$
for all CY fluids for
 ${\textit{Wi}}_0 \gt 0.1$
. In contrast,
 ${\textit{Re}}_{0,cr}$
increases with
 ${\textit{Wi}}_0$
for the purely elastic Oldroyd-B fluid, indicating that elasticity delays vortex shedding. For the PTT model with
 $\varepsilon = 0.01$
, elasticity also delays instability at moderate
 ${\textit{Wi}}_0$
, while for
 $\varepsilon = 0.1$
, enhanced shear-thinning shifts the peak
 ${\textit{Re}}_{0,cr}$
to
 $0.5 \lt {\textit{Wi}}_0 \lt 1$
with a lower value
 ${\textit{Re}}_{0,cr} = 48$
. At higher
 ${\textit{Wi}}_0$
, shear-thinning dominates, leading to a decreasing
 ${\textit{Re}}_{0,cr}$
. This non-monotonic behaviour has been reported in studies on circular (Sahin & Owens Reference Sahu, Chhabra and Eswaran2004; Pipe & Monkewtiz Reference Pipe and Monkewtiz2006) and triangular cylinders (Tezel Reference Tezel2016; Sun et al. Reference Sun, Wen, Si, Xie, Li, Cao and Zhu2024), reflecting the complex balance of inertia, elasticity and shear-thinning in determining flow physics.
Variations of (a)
 ${\textit{Re}}_{0,cr}$
variations with
 ${\textit{Wi}}_0$
for different constitutive equations, and (b) variation of the scaled critical Reynolds number
 ${\textit{Re}}_{r,cr}$
as a function of
 ${\textit{Wi}}_r$
, where the scaling is performed using the effective viscosity evaluated at the surface-averaged characteristic shear rate. The comparison highlights the stabilizing effects of viscoelasticity relative to the Newtonian reference case.

As evidenced by the material functions presented in Appendix C, beyond a certain
 ${\textit{Wi}}_0$
, the shear viscosity reaches a plateau. At high
 ${\textit{Wi}}_0$
, elastic effects saturate due to the finite extensibility of the polymer chains, as demonstrated by Lieu et al. (Reference Lieu, Jovanović and Kumar2013) for FENE-type models. This saturation arises because polymer molecules cannot extend beyond their maximum length, limiting further stress growth. Consequently, shear-thinning becomes the dominant rheological characteristic. At extremely large
 ${\textit{Wi}}_0 \gt 1000$
, even the shear-thinning effect approaches saturation, and the fluid behaviour asymptotically approaches a Newtonian-like state due to the finite extensibility parameter. It should be emphasized that the recovery is model-dependent and strongly influenced by the PTT parameter
 $\varepsilon$
and the presence of a solvent viscosity (Evans et al. Reference Evans, Junior and Oishi2017). As a result, the variation of
 ${\textit{Re}}_{0,cr}$
with
 ${\textit{Wi}}_0$
saturates, and all constitutive models converge towards approximately the same
 ${\textit{Re}}_{0,cr}$
.
It is worth noting that, although the wake dynamics differ in the unsteady regime, the highest shear rates remain confined to the near-wall region. Figure 9(b) shows the variation of the scaled critical Reynolds number
 ${\textit{Re}}_{r,cr}$
with
 ${\textit{Wi}}_r$
. Shear-thinning acts as a stabilizing mechanism, as
 ${\textit{Re}}_{r,cr}$
exceeds the Newtonian critical value over a finite range of
 ${\textit{Wi}}_r$
, consistent with the findings of Coelho & Pinho (Reference Coelho and Pinho2003). Physically, the viscosity reduction in the high-shear near-wall region weakens the amplification of disturbances in the separated shear layers, leading to an increase in
 ${\textit{Re}}_{r,cr}$
.
For the PTT model, the marked increase in
 ${\textit{Re}}_{r,cr}$
relative to the Newtonian reference over an intermediate range of
 ${\textit{Wi}}_r$
reflects an additional stabilizing contribution of elastic stresses, beyond the effect of shear-thinning alone, which has also been observed in linear stability analyses of viscoelastic cylinder wakes (Sahin & Owens Reference Sahu, Chhabra and Eswaran2004; Pipe & Monkewtiz Reference Pipe and Monkewtiz2006). The convergence of both the CY and PTT models towards an asymptotic regime at sufficiently large Weissenberg numbers indicates that, once the effective viscosity approaches its high-shear plateau, additional elastic or shear-thinning effects no longer significantly alter the global instability threshold.
5. Viscoelastic wake topology
5.1. Shear-thinning wake elongation
Viscoelasticity can strongly affect flow structures, with this influence expected to intensify in certain regimes due to the sharp corners of the square-cylinder geometry. To quantify the structural modifications of the wake, the recirculation length is reported in two complementary forms. Figure 10(a) presents the nominal vortex length
 $L/D$
as a function of
 ${\textit{Wi}}_0$
for the different constitutive equations. In addition, to isolate genuine elastic effects from those arising purely from viscosity variations, the vortex length is also normalized by the corresponding viscosity-matched Newtonian value, and plotted against
 ${\textit{Wi}}_r$
in figure 10(b).
Variations of (a) vortex length with
 ${\textit{Wi}}_0$
, and (b) rescaled vortex length with
 ${\textit{Wi}}_r$
for different constitutive equations. The results for the PTT model with
 $\varepsilon \sim 0$
coincide exactly with the Oldroyd-B curve and are therefore not separately shown.

Streamlines of flow of CY fluid around the cylinder in different flow conditions: (a)
 $n=0.2235, \lambda _C = 17.75, \alpha = 1.688$
(
 $\equiv$
PTT model,
 ${\textit{Wi}}_0 = 1000$
,
 $\varepsilon \sim 0$
); (b)
 $n=0.22448, \lambda _C = 178.4, \alpha = 1.688$
(
 $\equiv$
PTT model,
 ${\textit{Wi}}_0 = 10\,000$
,
 $\varepsilon \sim 0$
); (c)
 $n=0.2265, \lambda _C = 5687, \alpha = 1.6974$
(
 $\equiv$
PTT model,
 ${\textit{Wi}}_0 = 10\,000$
,
 $\varepsilon = 0.1$
).

The Newtonian flow provides a baseline for evaluating viscoelastic effects, exhibiting a symmetric wake with a recirculation length of approximately
 $L/D \sim 0.65$
, which is also observed in all viscoelastic models at low
 ${\textit{Wi}}_0$
. For the Oldroyd-B model with
 ${\textit{Wi}}_0 \lt 1$
, the recirculation length and shape remain nearly identical to the Newtonian case, accompanied by only minor changes in drag, consistent with the observations of Şahin & Atalık (Reference Şahin and Atalık2019) for weakly elastic fluids. Corroborating the increasing trend of
 $L/D$
in figure 10(a), the purely shear-thinning effects are isolated in the streamlines of the CY model shown in figure 11, demonstrating that the recirculation length grows with both
 ${\textit{Wi}}_0$
and
 $\varepsilon$
. Physically, as
 $\varepsilon$
increases and shear-thinning intensifies, the effective viscosity near the wall decreases, weakening viscous diffusion and leading to an elongation of the recirculation bubble in the nominal scaling. However, when this length is compared with a viscosity-matched Newtonian reference, i.e.
 $L/L_{\mathrm{\textit{Newt}}}$
in figure 10(b), the elongation is substantially attenuated, indicating that a significant portion of the apparent increase in
 $L/D$
originates from viscosity reduction rather than a genuine topological modification of the wake. This observation aligns with the stability results presented in § 4, where shear-thinning alone does not strongly destabilize the flow when expressed in terms of
 ${\textit{Re}}_{r,cr}$
.
This behaviour is also reflected in the onset of structural instability in the wake; the critical
 ${\textit{Wi}}_0$
threshold for the appearance of such instability is
 ${\textit{Wi}}_0 = 5$
(
 ${\textit{Wi}}_r = 8.5$
) for
 $\varepsilon = 0.01$
, and
 ${\textit{Wi}}_0 = 2$
(
 ${\textit{Wi}}_r = 4.6$
) for
 $\varepsilon = 0.1$
. This indicates that stronger shear-thinning accelerates the nominal elongation of the recirculation region, although this effect becomes substantially weaker when evaluated relative to the viscosity-matched Newtonian reference.
Additionally, increasing the Weissenberg number can also elongate the recirculation region by up to
 $165\,\%$
with
 $L/D = 1.7$
relative to the Newtonian model, as shown in figure 11(c). This progressive elongation of the recirculation region with increasing shear-thinning aligns with observations in square-square contraction flows, where stronger shear-thinning promotes upstream vortex growth (Sousa et al. Reference Sousa, Pinho, Oliveira and Alves2011). Viscosity reduction near solid boundaries facilitates flow separation and delays reattachment, thereby expanding the vortex. Moreover, as demonstrated by Xue, Phan-Thien & Tanner (Reference Xue, Phan-Thien and Tanner2011), vortex patterns in sudden contractions are directly linked to the fluid’s extensional behaviour, a mechanism equally relevant to the wake behind a square cylinder, where strong extensional flow coexists with shear-dominated regions.
5.2. Elastic vortex transformation
The PTT model exhibits more complex behaviour, particularly at intermediate
 $\varepsilon$
values such as
 $\varepsilon = 0.01$
. In this regime, the magnitudes of shear-thinning and elasticity are comparable, leading to a non-trivial dependence of flow structure on
 ${\textit{Wi}}_0$
, as shown in figure 12. For
 ${\textit{Wi}}_0 \leqslant 1$
(
 ${\textit{Wi}}_r \leqslant 1.5$
), the recirculation region behind the cylinder closely matches the Newtonian case seen in figure 12(a). At
 ${\textit{Wi}}_0 = 5$
(
 ${\textit{Wi}}_r = 8.5$
), however, the vortex length unexpectedly decreases to
 $0.38D$
, reflecting strong competition between elasticity and shear-thinning as seen in figure 12(b). This trend intensifies at
 ${\textit{Wi}}_0 = 10$
(
 ${\textit{Wi}}_r = 20.1$
), where the vortex length reaches
 $0.14D$
, the smallest value observed among all models as shown in figure 12(c). This competition mirrors the behaviour observed in contraction flows, where the interplay between fluid extensibility and shear-thinning determines the onset and growth of upstream vortices (Carlson, Shen & Haward Reference Carlson, Shen and Haward2021; Dhawan et al. Reference Dhawan, Das and Panigrahi2023). Specifically, Dhawan et al. (Reference Dhawan, Das and Panigrahi2023) demonstrated that a square cylinder placed upstream of a contraction plane effectively predeforms the fluid, altering the vortex dynamics in a manner consistent with the present observations. Notably, this pronounced contraction of the vortex core persists when normalized by the viscosity-matched Newtonian length, confirming that the reduction in recirculation length at intermediate
 ${\textit{Wi}}_r$
is genuinely elastic in origin rather than a consequence of viscosity variations alone as demonstrated in figure 10(b).
As
 ${\textit{Wi}}_0$
increases to 50 (
 ${\textit{Wi}}_r = 124.9$
), the vortex length recovers to approximately
 $0.4D$
, indicating the onset of shear-thinning dominance over elastic effects, and by
 ${\textit{Wi}}_0 = 130$
(
 ${\textit{Wi}}_r \sim 317.9$
) the vortex region expands further as shear thinning becomes the dominant mechanism, revealing a non-monotonic trend arising from the competition between elasticity and shear thinning within this range of
 ${\textit{Wi}}_0$
. For higher
 ${\textit{Wi}}_0$
between 100 and 10 000, the vortex length continues to grow and eventually reaches
 $1.72D$
, highlighting shear-thinning’s dominance at large
 ${\textit{Wi}}_0$
, as illustrated in figures 12(d) and 12(e), 10(a) and 10(b). However, at extreme Weissenberg numbers, the vortex length approaches an asymptotic value, indicating a saturation of elastic effects, stemming from the finite extensibility of polymer molecules, which bounds the amplification of polymer stress fluctuations even as
 ${\textit{Wi}}_0 \to \infty$
(Lieu et al. Reference Lieu, Jovanović and Kumar2013). This saturation is a specific feature of models with finite extensibility, such as the PTT model; for fluids described by the Oldroyd-B model, the wake structure would continue to evolve with increasing
 ${\textit{Wi}}_0$
until numerical breakdown occurs.
The corresponding CY model, equivalent to the PTT model with
 $\varepsilon = 0.01$
, predicts a vortex length of
 $0.68D$
at
 ${\textit{Wi}}_0 = 10$
(
 ${\textit{Wi}}_r = 20.1$
), nearly five times larger than the
 $0.14D$
obtained with the PTT model under the same conditions. This sharp contrast highlights the essential role of elasticity in reducing vortex dimensions in the PTT model. A similar trend appears when comparing PTT results at
 $\varepsilon = 0.1$
and
 $\varepsilon = 0.01$
for
 ${\textit{Wi}}_0 = 10$
(
 ${\textit{Wi}}_r = 20.1$
), where weaker elasticity at higher
 $\varepsilon$
produces a vortex length roughly six times greater. At very high
 ${\textit{Wi}}_0$
up to 10 000 (
 ${\textit{Wi}}_r = 22\,980$
), the vortex length approaches
 $1.75D$
in all three cases, indicating shear-thinning ultimately dominates under extreme flow conditions, as shown in figure 10(a). This strong contrast remains evident under viscosity matching, where
 $L/L_{\mathrm{\textit{Newt}}}$
for the PTT fluid remains substantially below unity at intermediate
 ${\textit{Wi}}_r$
, whereas the corresponding CY case exhibits only mild deviations from the Newtonian reference, as illustrated in figure 10(b).
Streamlines of flow of PTT fluid with
 $\varepsilon = 0.01$
around the cylinder in different
 ${\textit{Wi}}_0$
s: (a)
 ${\textit{Wi}}_0 = 1$
(
 ${\textit{Wi}}_r = 1.5$
); (b)
 ${\textit{Wi}}_0 = 5$
(
 ${\textit{Wi}}_r = 8.5$
); (c)
 ${\textit{Wi}}_0 = 10$
(
 ${\textit{Wi}}_r = 20.1$
); (d)
 ${\textit{Wi}}_0 = 100$
(
 ${\textit{Wi}}_r = 245.9$
); (e)
 ${\textit{Wi}}_0 = 10\,000$
(
 ${\textit{Wi}}_r = 22\,980$
).

For the PTT model with
 $\varepsilon = 0.01$
, four distinct regimes can be identified according to the phase diagrams presented in figures 10(a) and 10(b). At low
 ${\textit{Wi}}_0$
s (
 ${\textit{Wi}}_0 \leqslant 1$
,
 ${\textit{Wi}}_r \leqslant 1.5$
), elastic and shear-thinning effects are negligible, and the flow structure resembles the Newtonian regime. In the range
 $1 \leqslant {\textit{Wi}}_0 \leqslant 10$
(
 $1 \leqslant {\textit{Wi}}_r \leqslant 20.1$
), elastic forces dominate the flow dynamics, reducing the recirculation length by up to 80 % compared with the Newtonian case. In the range
 $10 \leqslant {\textit{Wi}}_0 \leqslant 100$
(
 $20.1 \leqslant {\textit{Wi}}_r \leqslant 450$
), a complex competition between elasticity and shear-thinning produces non-monotonic behaviour. Within this range, as
 ${\textit{Wi}}_0$
increases, shear-thinning progressively outweighs elasticity, restoring the recirculation length towards its previous values. At high
 ${\textit{Wi}}_0$
s (
 ${\textit{Wi}}_0 \gt 100$
,
 ${\textit{Wi}}_r \gt 450$
), shear-thinning completely dominates, leading to a dramatic increase in vortex length by approximately 170 %.
5.3. Elastic signatures: upstream and triangular vortices generation
The interplay between inertia, elasticity and shear-thinning in the moderate range with
 $1 \lt {\textit{Wi}}_0 \lt 100$
(
 $1.5 \lt {\textit{Wi}}_r \lt 450$
) generates distinctive vortex morphologies absent in both Newtonian and purely shear-thinning flows. Within this regime, the recirculation region undergoes remarkable transformations, including triangular vortex formation, internal elastic oscillations, the emergence of upstream vortical structures and, eventually, the symmetry breaking of these upstream vortices.
Figure 13 illustrates two distinct elastic signatures, including the emergence of a vortex pair at the cylinder’s sharp corners on top and front surfaces of the cylinder, and the deformation of the wake vortex into a distinctly triangular shape. Comparing flow structures between the PTT and CY constitutive models at
 ${\textit{Wi}}_0 = 10$
(
 ${\textit{Wi}}_r = 20.1$
) highlights the purely elastic origin of both phenomena.
Comparison of streamlines for the viscoelastic (PTT,
 $\varepsilon = 0.01$
, black solid lines) and equivalent purely shear-thinning (CY, red dashed lines) models at
 ${\textit{Wi}}_0 = 10$
(
 ${\textit{Wi}}_r = 20.1$
). Elastic vortical structures unique to the PTT flow are highlighted, including the upstream vortex in orange circle and the surface vortex above the rear corner in green circle, illustrating the role of elasticity in modifying the near-wall topology.

The two small but distinct vortices emerge, one located upstream of the front face and another above the rear corner, first observed by Kenney, Poper & Chapagain (Reference Kenney, Poper and Chapagain2013). These lip-like structures exemplify elastic instabilities characteristic of contraction–expansion flows, where abrupt geometric transitions generate strong extensional stresses and normal-stress gradients that promote upstream vortex formation (Rothstein & McKinley Reference Rothstein and McKinley2001; Dhawan et al. Reference Dhawan, Das and Panigrahi2023). A similar mechanism appears in planar contractions, where the Oldroyd-B model exhibits vortex reduction alongside a small lip vortex (Alves et al. Reference Alves, Oliveira and Pinho2003b ). The square cylinder thus acts as a localized contraction–expansion element, and the corner vortices observed reflect the same stress-driven elastic mechanism.
According to the findings of Peng et al. (Reference Peng, Tang, Li, Zhang and Yu2023), which show that the intensity and spatial extent of these structures increase with
 $\beta$
owing to the amplification of normal stresses at higher retardation ratios, we performed a detailed analysis at
 $\beta = 0.8$
, where accumulated normal stresses in the stagnation region generate an elastic reverse flow that gives rise to a pronounced upstream vortex, consistent with the Pakdel–McKinley criterion (McKinley, Pakdel & Öztekin Reference McKinley, Pakdel and Öztekin1996). This criterion establishes that purely elastic instabilities arise from the coupling of large normal stresses with curved streamlines, precisely the conditions prevailing in the stagnation region of a square cylinder.
Streamlines superimposed on contours of
 $N_1$
showing the formation of front and upper-surface vortical structures in PTT flow (
 $\varepsilon = 0.01$
,
 $\beta = 0.8$
) at different
 ${\textit{Wi}}_0$
: (a)
 ${\textit{Wi}}_0 = 1$
; (b)
 ${\textit{Wi}}_0 = 4$
; (c)
 ${\textit{Wi}}_0 = 6$
; (d)
 ${\textit{Wi}}_0 = 10$
. Panel (d) is an instantaneous snapshot during the unsteady regime, captured when the upstream vortex extends to the upper edge of the cylinder.

Figure 14 illustrates the formation and evolution of these structures with increasing
 ${\textit{Wi}}_0$
at
 $\beta = 0.8$
, together with the contours of non-dimensioned
 $N_1$
. At
 ${\textit{Wi}}_0 = 1$
in figure 14(a), the stress concentration around the downstream vertex expands, and the first small pair of upstream vortices becomes identifiable near the upper edge of the front face. As
 ${\textit{Wi}}_0$
increases to 4 in figure 14(b), symmetric vortices become larger and occupy the frontal surface, while the size of the downstream wake vortex decreases and adopts a more triangular shape, indicating that increasing elasticity redistributes the vortical structures from the wake towards the upstream region. At this stage, the
 $N_1$
contour in front of the cylinder forms a distinct negative region, indicating that the upstream vortex formation is directly driven by the imbalance between streamwise and transverse normal stresses (
 $N_1$
), a mechanism widely discussed in viscoelastic flow (Bird et al. Reference Bird, Armstrong, Hassager and Forbes1987; McKinley et al. Reference McKinley, Pakdel and Öztekin1996) and in vortex growth dynamics of contraction–expansion flows, where the ratio of elastic normal stresses in shear to those in uniaxial extension governs whether a corner vortex develops upstream of the contraction plane (Rothstein & McKinley Reference Rothstein and McKinley2001).
At
 ${\textit{Wi}}_0 = 6$
in figure 14(c), the upstream structure loses symmetry, while the downstream vortex continues to shrink while preserving its triangular geometry. In addition, a small vortex appears near the right-hand edge of the upper surface and grows with increasing
 ${\textit{Wi}}_0$
. The increasing
 $N_1$
around the vortex boundary, highlighting the direct role of elastic normal stresses in triggering local boundary-layer separation, commonly referred to as elastic boundary-layer separation (Davoodi, Domingues & Poole Reference Davoodi, Domingues and Poole2019).
Contours of
 $N_1$
in the near wake for
 ${\textit{Wi}}_0 = 4$
,
 $6$
and
 $10$
for PTT fluid with
 $\varepsilon = 0.01$
at
 ${\textit{Re}}_0 = 10, \beta = 0.8$
. Strong elastic-stress localization along the recirculation boundaries becomes increasingly pronounced with
 ${\textit{Wi}}_0$
and correlates with the deformation of the vortex core into a triangular topology.

Finally, at
 ${\textit{Wi}}_0 = 10$
in figure 14(d), the flow enters an unsteady regime. The upstream vortices deform asymmetrically and exhibit clear temporal oscillations, with their instantaneous size shrinking. The contour corresponds to a representative instant at which the upstream vortex has expanded up to the upper edge of the cylinder. The downstream vortex undergoes only minor geometric variations and remains comparatively weakly affected by the front-vortex dynamics, indicating that, in this regime, elasticity not only triggers the formation of upstream vortical structures but, at higher levels, interacts with shear-thinning effects to constrain their growth and long-term stability (Peng et al. Reference Peng, Tang, Li, Zhang and Yu2023).
Experimental investigations (Haward et al. Reference Haward, Toda-Peters and Shen2018) and numerical simulations of viscoelastic flow around circular cylinders in channels have shown that the formation of upstream vortices typically requires confinement with blockage ratio
 ${\lt }50\,\%$
. In contrast, for flow past an unconfined square cylinder, upstream vortices arise even in the absence of geometric confinement, consistent with the established understanding that purely elastic instabilities originate from the interaction between large normal stresses and curved streamlines in regions of abrupt geometric variation, as reviewed by Alves, Oliveira & Pinho (Reference Alves, Oliveira and Pinho2021). The resulting corner vortices reflect a general stress-driven elastic mechanism, while also underscoring the distinctive role of the square-cylinder geometry, whose sharp corners intensify stress concentration and amplify these purely elastic instabilities (McKinley et al. Reference McKinley, Pakdel and Öztekin1996; Arratia et al. Reference Arratia, Thomas, Diorio and Gollub2006).
The transformation of the downstream recirculation region into a triangular vortex in figure 13 indicates that the wake of the PTT fluid is more compact than that of its CY counterpart, where shear-thinning alone produces a diffuse and elongated wake. This contrast suggests that elasticity acts as an invisible skeleton, reinforcing vortex integrity through energy storage in polymer bonds.
To clarify the origin of the triangular vortex structure, the contours of the first normal stress difference
 $N_1$
are plotted alongside the streamlines at a higher retardation ratio with
 $\beta = 0.8$
in figure 15. The spatial distribution of
 $N_1$
closely follows the boundaries of the recirculation region, and forms a region of elevated elastic stress surrounding the vortex (figure 15
a), indicating that the vortex geometry is strongly influenced by the spatial organization of elastic stresses.
This stress localization originates from strong polymer stretching in regions of large velocity gradients, which generates substantial streamwise normal stresses and modifies the momentum balance in the wake, a behaviour previously reported in viscoelastic cylinder flows where polymer stresses alter wake structure and stability (Richter, Iaccarino & Shaqfeh Reference Richter, Iaccarino and Shaqfeh2012). As
 ${\textit{Wi}}_0$
increases, the magnitude of
 $N_1$
around the recirculation region intensifies, forming a stress envelope that progressively constrains the vortex core. The recirculation region therefore becomes increasingly confined by these surrounding elastic-stress regions, causing the vortex boundaries to align with the
 $N_1$
contours and the vortex core to deform into a wedge-like structure that appears triangular at sufficiently large
 ${\textit{Wi}}_0$
shown in figures 15(b) and 15(c).
The notable decrease in the recirculation length of the Oldroyd-B model in figures 10(a) and 10(b), after an initial increase with
 ${\textit{Wi}}_0$
up to
 ${\textit{Wi}}_0 \leqslant 2.5$
(
 ${\textit{Wi}}_r \leqslant 1.8$
), signals the emergence of a purely elasticity-driven phenomenon. Figure 16 illustrates the streamline patterns around the cylinder for the Oldroyd-B model at
 $\beta = 0.6$
for different Weissenberg numbers. At
 ${\textit{Wi}}_0 = 3$
in figure 16(a), the flow field is perfectly symmetric, with two vortices upstream of the cylinder in the stagnation region and two in the wake. As the Weissenberg number increases to
 ${\textit{Wi}}_0 = 4$
in figure 16(b), symmetry breaking appears in the upstream region, with a small vortex forming on the upper side of the front face while its counterpart on the lower side vanishes, paralleling the lip-vortex formation near the sharp corner, as a precursor to more complex instabilities (Afonso et al. Reference Afonso, Oliveira, Pinho and Alves2011). Remarkably, the rear vortices remain symmetric, although their size is reduced compared with the
 ${\textit{Wi}}_0 = 3$
case, owing to the strong interaction between upstream and downstream regions via the pressure field; as noted by Afonso et al. (Reference Afonso, Oliveira, Pinho and Alves2011), the growth and merging of upstream vortices alter the pressure distribution along the wall, thereby influencing the downstream separation region. At
 ${\textit{Wi}}_0 = 5$
in figure 16(c), the front vortex persists, with a size and morphology nearly identical to that observed at
 ${\textit{Wi}}_0 = 4$
, and the rear vortices become even smaller. By
 ${\textit{Wi}}_0 = 6$
in figure 16(d), the flow exhibits unsteady behaviour with periodic oscillations in the stress components, consistent with Afonso et al. (Reference Afonso, Oliveira, Pinho and Alves2011)’s observations for
 $De \geqslant 6$
.
Streamlines (black lines) superimposed on contours of the flow type parameter
 $\xi$
for the Oldroyd-B fluid at
 $\beta = 0.6$
: (a)
 ${\textit{Wi}}_0 = 3$
; (b)
 ${\textit{Wi}}_0 = 4$
; (c)
 ${\textit{Wi}}_0 = 5$
. The symmetric front vortices at
 ${\textit{Wi}}_0 = 3$
, coinciding with an asymmetric distribution of the
 $\xi \approx 1$
region, while the rear vortices remain symmetric but decrease in size.

The elastic instabilities in viscoelastic flows with high elasticity first emerge in regions with the highest pure extensional rates and maximum normal stresses (Afonso et al. Reference Afonso, Oliveira, Pinho and Alves2011). In the square cylinder geometry, such a region is located upstream of the cylinder, where the flow decelerates and polymer molecules undergo intense stretching. To visualize these regions and quantitatively investigate the origin of the asymmetric front vortex, we employ the flow type parameter
 $\xi$
, introduced by Afonso et al. (Reference Afonso, Oliveira, Pinho and Alves2011), defined as
 \begin{equation} \xi = \frac {\big|\dot {\tilde {\gamma }}\big| - \big|\tilde {\varOmega }\big|}{\big|\dot {\tilde {\gamma }}\big| + \big|\tilde {\varOmega }\big|} \end{equation}
where
 $\boldsymbol{\tilde {\varOmega }} = [\boldsymbol{\nabla } \boldsymbol{U} - (\boldsymbol{\nabla } \boldsymbol{U})^T]/2$
is the vorticity tensor. The parameter
 $\xi$
ranges from
 $-1$
to
 $1$
and serves to distinguish regions of pure extension with
 $\xi \approx 1$
, which are the initiation sites of instability, from the wake region, dominated by rotational with
 $\xi \approx -1$
and shear with
 $\xi \approx 0$
mechanisms, which remains stable until disturbances are convected downstream.
As seen in
 $\xi$
contour at
 ${\textit{Wi}}_0 = 3$
, shown in figure 16(a), pure extension regions appear symmetrically upstream of the cylinder near the stagnation point and the leading corners, and also in small regions behind the cylinder. As
 ${\textit{Wi}}_0$
increases to
 $4$
and
 $5$
, shown in figures 16(b) and 16(c), the distribution of
 $\xi$
in the upstream region becomes asymmetric, with the zone of pure extension expanding and intensifying on the upper side of the front face, while weakening on the lower side, which is precisely coincides with the formation of an asymmetric front vortex on the upper side, shown in figure 16(b). Such correlation between the
 $\xi$
distribution and the location of the front vortex indicates that the elastic instability and symmetry breaking are directly governed by modifications in the regions of high extensional flow. For
 ${\textit{Wi}}_0 \gt 5$
the flow becomes unsteady, consistent with Afonso et al. (Reference Afonso, Oliveira, Pinho and Alves2011)’s observations of transitions to more complex regimes such as vortex back-shedding.
Throughout these cases, the downstream wake retains
 $\xi \approx 0$
or negative values, where shear or rotation dominate, and remains symmetric up to
 ${\textit{Wi}}_0 = 6$
, confirming that the instability originates exclusively in the upstream pure-extension region and is subsequently transmitted downstream via the pressure field.
Another elastic instability emerges within the vortex core, revealed by time-resolved monitoring of flow variables, manifesting as regular oscillations while the bulk flow remains globally steady. To ensure that this behaviour is not a local artefact, pressure and velocity signals were sampled at several locations inside the recirculation region; a representative example is shown in figure 17, which displays the time history recorded at
 $(x/D,\, y/D) = (0.8,\,0.2)$
, where the oscillatory signature is particularly pronounced. Periodic oscillations in pressure and streamwise velocity clearly emerge, driven by variations of the first normal stress difference, indicating a stress-induced elastic oscillatory state rather than chaotic turbulence. The oscillation amplitude peaks around
 ${\textit{Wi}}_0 = 1000$
(
 ${\textit{Wi}}_r = 2334$
) and diminishes at higher
 ${\textit{Wi}}_0$
, suppressed by shear-thinning. The existence of a confined, stress-driven limit-cycle oscillation within the recirculation region underscores the genuinely dynamical role of elasticity in reshaping wake behaviour, even at moderate inertia.
Periodic oscillations of pressure and
 $x$
-component velocity at a point
 $(x/D,\, y/D) = (0.8,\,0.2)$
located within the vortex region for flow of PTT fluid with
 $\varepsilon = 0.01$
at two different
 ${\textit{Wi}}_0$
values.

The present simulations are restricted to two-dimensional flow past a square cylinder at a low Reynolds number with
 ${\textit{Re}}_0 = 10$
, where the wake remains essentially two-dimensional and three-dimensional inertial instabilities are not expected to be active. However, viscoelastic wakes are known to exhibit purely elastic and elasto-inertial instabilities that can be intrinsically three-dimensional, especially at higher Reynolds numbers or in confined cylinder configurations (McKinley et al. Reference McKinley, Armstrong and Brown1993; Oliveira & Miranda Reference Oliveira and Miranda2005; Richter et al. Reference Richter, Iaccarino and Shaqfeh2010, Reference Richter, Iaccarino and Shaqfeh2012). In such regimes, one may anticipate quantitative changes in the onset conditions and nonlinear saturation of wake instabilities, including shifts in the critical Reynolds and Weissenberg numbers, modifications of the spanwise structure of the wake and altered amplitudes and frequencies of force oscillations once fully three-dimensional modes become active. The focus on a two-dimensional, low-
 ${\textit{Re}}_0$
configuration is designed to isolate and quantify the competition between elasticity and shear-thinning without the additional complexity of three-dimensional modes. Extending the current elasto-thinning framework to fully three-dimensional simulations at higher Reynolds numbers represents a natural direction for future work and is necessary to evaluate the robustness of the regimes and mechanisms identified here when intrinsically three-dimensional instabilities develop in the wake.
6. Conclusion
We have carried out a systematic numerical study of viscoelastic flow past a square cylinder, focusing on the interplay between elasticity and shear-thinning across a vast range of
 $0.1 \leqslant {\textit{Wi}}_0 \leqslant 10^{4}$
at a fixed
 ${\textit{Re}}_0=10$
. Using four constitutive models, Newtonian, Oldroyd-B, CY and PTT, we disentangled the individual and combined effects of elastic stresses and shear-thinning rheology on the macroscopic and microscopic flow features.
Results demonstrate that elasticity dominates at low
 ${\textit{Wi}}_0$
, increasing drag and delaying the onset of vortex shedding. Flow separation is strongly suppressed, leading to a significant reduction in recirculation length and enhanced wake stability. Distinct elastic signatures emerge in the transitional regime with
 $50 \leqslant {\textit{Wi}}_0 \leqslant 500$
, including triangular vortex cores and the appearance of secondary upstream vortices, and their subsequent symmetry breaking at higher Weissenberg numbers in purely elastic flows. These structures persist longer at higher solvent viscosity ratios, underscoring the role of elastic normal stresses in shaping the flow topology.
As
 ${\textit{Wi}}_0$
increases further, shear-thinning becomes the dominant mechanism, reducing drag and restoring nearly Newtonian-like vortex structures. The
 ${\textit{Re}}_{0,cr}$
decreases, while the shedding frequency rises markedly, with trends strongly dependent on the shear-thinning parameter
 $\varepsilon$
. At very high
 ${\textit{Wi}}_0$
with
 ${\textit{Wi}}_0 \gtrsim 10^3$
, elastic effects saturate due to the finite extensibility of polymer molecules, and shear-thinning becomes dominant. For models with finite extensibility, such as PTT, the flow gradually approaches a Newtonian-like state, with all such models converging to a similar
 ${\textit{Re}}_{0,cr}$
. This asymptotic behaviour is not universal; it is absent in purely elastic models like Oldroyd-B, which lack finite extensibility and exhibit unbounded stress growth. The recovery is also strongly dependent on the PTT parameter
 $\varepsilon$
, with larger values leading to more rapid convergence.
Together, these findings establish distinct rheological roles, with elasticity stabilizing and reorganizing the wake at moderate
 ${\textit{Wi}}_0$
, while shear-thinning dominates at intermediate to large
 ${\textit{Wi}}_0$
, gradually eroding elastic effects until Newtonian dynamics are reinstated. Importantly, the study provides quantitative benchmarks for drag modification, vortex suppression and wake transitions that may guide experimental and computational work in more complex geometries and higher
 ${\textit{Re}}_0$
regimes.
Future investigations could extend this framework to unsteady three-dimensional flows, where elasticity–shear-thinning interactions may generate richer instabilities, or to particle-laden and turbulent suspensions, where viscoelasticity can fundamentally alter transport and mixing.
Supplementary material
Supplementary material is available at https://doi.org/10.1017/jfm.2026.11725.
Acknowledgements
The authors acknowledge support from the National Natural Science Foundation of China (grants nos. 12302294, 12432010 and 12504544).
Declaration of interests
The authors report no conflict of interest.
Appendix A. Grid and time step independence and solver verification
To ensure the accuracy and reliability of the numerical results, we conduct a grid independence study in both steady and unsteady flow regimes. Table 2 details three refined grids, with the resolution dictated by the number of cells at the inlet, including the near-cylinder region, the wake and the upper and lower domain boundaries.
Effect of grid size on drag coefficient accuracy in steady regime.

Grid independence was first assessed for a steady viscoelastic case (
 ${\textit{Re}}_0 = 10$
,
 ${\textit{Wi}}_0 = 10$
,
 $\varepsilon = 0.1$
), with grid 2 deemed sufficient based on the convergence of
 $C_D$
in table 2. To further validate the spatial convergence for unsteady flows, a separate study was conducted for an unsteady PTT flow at
 ${\textit{Re}}_0 = 40, {\textit{Wi}}_0 = 40, \varepsilon = 0.1 \text{ and } \xi ' = 0.01$
. The temporal evolution of
 $C_D$
,
 $C_L$
for the three grids is presented in figure 18(a), confirming that the selected grid 2 adequately resolves the transient dynamics.
However, recognizing the importance of accurately capturing the stress field, particularly near the sharp corners of the square cylinder where singularities may arise, we examine the distributions of velocity and
 $\tau _{pol_{\textit{xx}}}$
along a horizontal line
 $0.02D$
above the top surface
 $y/D = 0.52$
to assess the resolution of local stress concentrations. The results, presented in figure 18(b), demonstrate excellent convergence of these sensitive local quantities.
Grid convergence study: (a) temporal evolution of
 $C_D$
and
 $C_L$
in unsteady regime at
 ${\textit{Re}}_0 = 40, {\textit{Wi}}_0 = 40, \varepsilon = 0.1, \text{ and } \xi ' = 0.01$
; (b) distribution of
 $\tau _{\textit{xx}}/(\eta _0 U_\infty /D)$
and
 $u/U_\infty$
along a horizontal line
 $0.02D$
above the top surface.

To ensure the temporal convergence of our numerical solutions, we perform all simulations in an unsteady formulation. Given the inherent sensitivity of the numerical simulation of viscoelastic flow to the time step size, we implemented a two-tier strategy to establish time step independence, ensuring temporal convergence across the wide range of Weissenberg numbers and rheological regimes investigated in this study.
First, we conduct a baseline assessment for a representative unsteady viscoelastic flow, i.e. PTT model with
 ${\textit{Re}}_0 = 40$
,
 ${\textit{Wi}}_0 = 40$
,
 $\varepsilon = 0.1$
, using three constant non-dimensional time steps,
 $\Delta t U_\infty /D = 0.1$
,
 $0.01$
and
 $0.001$
. As summarized in table 3, the differences in both the mean drag coefficient
 $C_{D_{ave}}$
and the maximum lift amplitude
 $C_{L_{max}}$
between
 $\Delta t = 0.01$
and
 $\Delta t = 0.001$
are negligible, confirming that
 $\Delta t = 0.01$
provides a temporally converged solution. For all production runs, however, we employed an adaptive time stepping scheme controlled by a maximum Courant number of 0.4, which automatically reduces the time step in regions of high velocity or mesh refinement, typically yielding effective time steps of the order of
 $O(0.001)$
or smaller, thereby providing a conservative margin of safety.
Effect of time step on accuracy of results for PTT case with
 ${\textit{Re}}_0 = 40$
,
 ${\textit{Wi}}_0 = 40$
,
 $\varepsilon = 0.1$
and
 $\xi '=0.01$
.

Second, recognizing that sharp corners can localize high stress gradients and different elasto-thinning regimes may pose unique challenges, we perform targeted time step verification for two critical and representative flow conditions.
For shear-thinning dominant regime at extreme
 ${\textit{Wi}}_0$
, a strong shear-thinning PTT flow with
 $\varepsilon = 0.1$
,
 ${\textit{Re}}_0=20$
and
 ${\textit{Wi}}_0=5000$
was simulated using four different maximum allowable time steps
 $\Delta t = 0.1, 0.01, 0.001, 0.0001$
under the adaptive scheme. The evolution of
 $\tau _{\textit{xx}}$
at a probe point located
 $0.03D$
from the rear top corner of the cylinder with
 $x/D = 0.53$
and
 $y/D = 0.53$
was monitored. The results in figure 19(a
) demonstrate excellent agreement across all time steps, confirming convergence even in the high-
 ${\textit{Wi}}_0$
shear-thinning regime.
For elastic-dominant regime near the critical
 ${\textit{Re}}_0$
, to verify temporal convergence in a regime where elasticity delays vortex shedding, we monitored
 $\tau _{\textit{xx}}$
near the cylinder corner. A flow at
 ${\textit{Wi}}_0=10$
and
 ${\textit{Re}}_0=70$
, slightly above the critical
 ${\textit{Re}}_{0,cr} \approx 63$
for the PTT model with
 $\varepsilon =0.01$
as shown in figure 9(a
), was simulated. The time evolution of
 $\tau _{\textit{xx}}$
at the same probe point is shown in figure 19(b) for simulations with adaptive
 $\Delta t_{\textit{max}} = 0.001$
and
 $0.0001$
. The identical stress history confirms the temporal convergence of the solution.
Time step convergence study for critical flow regimes: evolution of non-dimensional
 $\tau _{\textit{ij}}$
at a probe point with
 $x/D=0.53, y/D=0.53$
for simulations with different time steps. (a) Shear-thinning dominant regime (PTT,
 $\varepsilon =0.1$
,
 ${\textit{Re}}_0=20$
,
 ${\textit{Wi}}_0=5000$
). (b) Elastic-dominant regime (PTT,
 $\varepsilon =0.01$
,
 ${\textit{Wi}}_0=10$
,
 ${\textit{Re}}_0=70$
). Both studies validate the temporal convergence achieved with
 $\Delta t = 0.001$
, the baseline time step employed for all simulations in this work. Plots are arranged from bottom to top for
 $\tau _{\textit{xx}}^*$
,
 $\tau _{\textit{yy}}^*$
and
 $\tau _{\textit{xy}}^*$
, respectively.

To establish the accuracy and reliability of the numerical methodology, which encompasses steady and unsteady flows of viscoelastic fluids around a sharp-edged square cylinder, we perform a three-part validation strategy.
The solver’s capability for simulating bluff-body flows was first verified against the benchmark Newtonian case of flow past a square cylinder with the drag coefficients at
 ${\textit{Re}}_0 = 5, 10, 40$
were computed and compared with established numerical data (Sharma & Eswaran Reference Sharma and Eswaran2004; Akhilesh, Chhabra & Eswaran Reference Akhilesh, Chhabra and Eswaran2009; Sen, Mittal & Biswas Reference Sen, Mittal and Biswas2011), as summarized in table 4.
Comparison of drag coefficient with literature data at various
 ${\textit{Re}}_0$
s. Note that percentage difference is calculated relative to the present study.

Validation of the numerical method: (a) time evolution of
 $C_D$
and
 $C_L$
in the periodic regime for viscoelastic flow (Oldroyd-B model) past a circular cylinder at
 ${\textit{Re}}_0 = 100$
and
 ${\textit{Wi}}_0 = 0.6$
; (b) distribution of non-dimensional
 $N_1$
along the wall of the smaller downstream channel (
 $y/L = 1$
) for the benchmark
 $4:1$
planar contraction flow (Oldroyd-B model with
 ${\textit{Re}}_L = 0.01$
,
 ${\textit{Wi}}_L = 1$
and
 $\beta = 0.5$
). In (b), solid lines correspond to the present study, while symbols denote data from Evans et al. (Reference Evans, França and Oishi2019).

To validate the solver’s ability to capture time-dependent elastic flows, we reproduced the results of Oliveira (Reference Oliveira2001) for flow past a circular cylinder. The temporal evolution of
 $C_D$
and
 $C_L$
at
 ${\textit{Re}}_0 = 100$
and
 ${\textit{Wi}}_0 = 0.6$
is presented in figure 20(a
). The close agreement confirms its robustness in predicting the onset and dynamics of viscoelastic vortex shedding.
To further validate the accuracy of resolving the stress field in the vicinity of sharp corners, we reproduced the planar
 $4:1$
contraction flow benchmark investigated by Evans et al. (Reference Evans, França and Oishi2019). For the mesh refinement in the vicinity of the re-entrant corner, we generated a significantly refined mesh of 121 600 cells for the planar contraction, where
 $L$
denotes the half-width of its smaller downstream section and
 $U_2$
represents the mean velocity in that section. Simulations were performed for an Oldroyd-B model at
 ${\textit{Re}}_L = 0.01 0$
,
 ${\textit{Wi}}_L = 1$
and
 $\beta = 0.5$
. A detailed comparison is presented in figure 20. The distribution of
 $N_1$
along the wall of the smaller downstream channel with
 $y/L = 1$
is presented in figure 20(b). The excellent agreement between our numerical results denoted by lines and the reference data denoted by symbols across all these metrics confirms that our numerical methodology reliably captures both the global flow features and the local singular stress behaviour near sharp corners.
Appendix B. Numerical verification of corner stress singularities
We detail the numerical verification of the polymeric stress field near the sharp corners of the square cylinder, a critical step given the known sensitivity of viscoelastic flows to geometric singularities (Hinch Reference Hinch1993; Evans et al. Reference Evans, Junior, Oishi and Neto2022), confirming that our simulations, stabilized by the log-conformation formulation, yield consistent and mesh-convergent solutions in these regions despite the theoretical stress singularity.
The log–log variation of
 $\tau _{\textit{xx}}$
and
 $\tau _{\textit{xy}}$
as functions of
 $r$
, evaluated along the angular directions
 $\theta = 3\pi /4$
and
 $\pi$
. Results are shown for the three computational grids, demonstrating mesh convergence in the near-corner region and weak power-law behaviour. Circular symbols correspond to
 $\theta = 3\pi /4$
, while gradient symbols denote
 $\theta = \pi$
.

Following the approach used for contraction flows (Evans et al. Reference Evans, Junior, Oishi and Neto2022), we analyse the asymptotic behaviour of the velocity and polymeric stress tensor along radial line probes emanating from the top-front and top-rear corners of the cylinder. For a selected steady-state case (
 ${\textit{Re}}_0=10$
,
 ${\textit{Wi}}_0=10$
,
 $\varepsilon =0.1$
), stress components are sampled along radial lines emanating from the corner vertex at fixed angles
 $\theta = 3\pi /4 \text{and } \pi$
. To assess numerical convergence, this procedure is repeated for the three systematically refined grids described in Appendix A.
Figure 21 presents the log–log variation of the polymeric stress components
 $\tau _{\textit{xx}}$
and
 $\tau _{\textit{xy}}$
as functions of the radial distance
 $r$
from the corner vertex, for the angular directions
 $\theta =3\pi /4$
and
 $\pi$
. Results are shown for the three computational grids in order to assess the sensitivity of the corner stress behaviour to mesh resolution.
For both stress components, the coarsest grid shows noticeable deviations near the corner at small
 $r$
, indicating that the steep stress gradients induced by the geometric singularity are insufficiently resolved. The two finer grids collapse well over the radial range exhibiting an approximately linear trend in the log–log plot, with minor discrepancies only at points closest to the corner, consistent with the theoretical stress singularity and finite spatial resolution.
Within the approximately linear regions of the log–log plots, weak power-law behaviour of the form
 $\tau _{\textit{ij}} \sim r^{-\alpha }$
can be identified. For the streamwise normal stress
 $\tau _{\textit{xx}}$
, the extracted slopes are
 $\alpha \approx 0.083$
for
 $\theta =3\pi /4$
and
 $\alpha \approx 0.135$
for
 $\theta =\pi$
, while the shear stress
 $\tau _{\textit{xy}}$
exhibits smaller exponents, with
 $\alpha \approx 0.031$
and
 $\alpha \approx 0.057$
for the same angular directions, respectively. These values were obtained by linear fitting over the radial intervals corresponding to the visibly linear portions of the curves and remain essentially unchanged when comparing the two finest grids.
The relatively small magnitude of the extracted exponents indicates a weak corner singularity, consistent with theoretical and numerical studies of the PTT model. The finite extensibility mechanism in the PTT constitutive equation attenuates stress singularities compared with models such as Oldroyd-B or the upper-convected Maxwell fluid (Renardy Reference Renardy1997; Evans Reference Evans2010b ), while the exponent’s dependence on the angular direction reflects the anisotropic nature of the corner flow (Hinch Reference Hinch1993; Evans et al. Reference Evans, Junior, Oishi and Neto2022).
Furthermore, to investigate the temporal evolution of stresses in the critical corner region, we monitored the history of
 $\tau _{\textit{xx}}$
at a fixed probe point located at
 $x/D = 0.53, y/D = 0.53$
for five representative cases spanning different constitutive models and flow regimes, including (i) Oldroyd-B at
 ${\textit{Wi}}_0=5$
(purely elastic); (ii) PTT (
 $\varepsilon =0.01$
) at
 ${\textit{Wi}}_0=100$
; (iii) PTT (
 $\varepsilon =0.01$
) at
 ${\textit{Wi}}_0=1000$
(high
 ${\textit{Wi}}_0$
); (iv) PTT (
 $\varepsilon =0.1$
) at
 ${\textit{Wi}}_0=100$
; and (v) PTT (
 $\varepsilon =0.01$
) at
 ${\textit{Wi}}_0=10$
,
 ${\textit{Re}}_0=70$
(unsteady, above critical
 ${\textit{Re}}_0$
). As shown in figure 22, for all steady cases (i–iv) the corner stress evolves from an initial transient and converges to a constant, time-invariant value. In the unsteady case (v),
 $\tau _{\textit{xx}}$
attains a sustained periodic oscillation corresponding to the developed vortex-shedding cycle. The convergence of these temporal histories under our adaptive time stepping scheme (
 $Co_{\textit{max}}=0.4$
) confirms that the dynamics associated with the corner singularity are temporally well-resolved.
Temporal evolution of the polymeric normal stress
 $\tau _{\textit{xx}}$
at a fixed probe point located
 $0.03D$
from the rear top corner of the square cylinder (
 $x/D = 0.53, y/D = 0.53$
). Results are shown for five representative cases at
 ${\textit{Re}}_0=70$
. For steady cases, the stress converges to a constant value after an initial transient. In the unsteady case,
 $\tau _{\textit{xx}}$
exhibits sustained periodic oscillations corresponding to the vortex-shedding cycle.

Overall, the present results demonstrate that, although polymeric stresses remain theoretically singular at sharp corners, the singularity is weak and numerically well controlled in the present simulations. The use of the log-conformation formulation, combined with systematic spatial and temporal resolution studies, ensures stable and convergent solutions. This allows the asymptotic behaviour and temporal evolution of the stress field near the corners of the square cylinder to be captured in a physically consistent manner, providing confidence in the global flow predictions.
Appendix C. Methodology for material function calculation and model fitting
We outline the numerical procedure for calculating material functions and fitting the CY model to the PTT shear viscosity. For each case with parameters (
 $\lambda , \varepsilon , \eta _{\textit{pol}}, \eta _s$
), we solve the simplified constitutive equations for simple shear flow, as follows:
 \begin{equation} \begin{cases} \dfrac {\text{d}\tau _{\textit{xy}}}{\text{d}t} = \dfrac {\eta _{{\textit{pol}}}}{\lambda } \dot {\gamma } - \dfrac {f(\tau _{\textit{xx}},\tau _{\textit{yy}},\tau _{\textit{zz}})}{\lambda } \tau _{\textit{xy}}(t), & \tau _{\textit{xy}}(0) = 0, \\[10pt] \dfrac {\text{d}\tau _{\textit{xx}}}{\text{d}t} = 2\dot {\gamma }\tau _{\textit{xy}}(t) - \dfrac {f(\tau _{\textit{xx}},\tau _{\textit{yy}},\tau _{\textit{zz}})}{\lambda } \tau _{\textit{xx}}(t), & \tau _{\textit{xx}}(0) = 0, \end{cases} \end{equation}
where
 $f(\tau _{\textit{xx}}, \tau _{\textit{yy}}, \tau _{\textit{zz}})$
is the exponential PTT function defined in (2.5), with
 $\tau _{\textit{yy}} = \tau _{\textit{zz}} = 0$
for simple shear flow. The time derivatives are discretized using forward differencing and solved iteratively with a chosen time step and final time. Once
 $\tau _{\textit{xy}}$
and
 $\tau _{\textit{xx}}$
are obtained for a given shear rate, the shear viscosity is computed as
 \begin{equation} \eta _{\textit{shear}}(\dot {\gamma }) = \dfrac {\tau _{\textit{xy}}(t_{\textit{max}})}{\dot {\gamma }} + \eta _s. \end{equation}
This procedure was repeated across a wide range of
 $\dot {\gamma }$
to obtain the full shear viscosity curve, solving the equations iteratively in MATLAB with a convergence tolerance of
 $10^{-16}$
. The CY parameters were then determined by fitting (2.7) to these data using MATLAB’s lsqcurvefit, which minimizes the sum of squared residuals via nonlinear least squares.
Although the flow is primarily shear near the cylinder walls, it becomes extensional along the centreline, allowing computation of the elongational viscosities of the four constitutive models. This requires a steady-state uniaxial extensional flow simulation, governed by
 \begin{equation} \begin{cases} \tau _{\textit{xx}} f(\tau _{\textit{xx}}, \tau _{\textit{yy}}, \tau _{\textit{zz}}) = 2\dot {\varepsilon }(\lambda \tau _{\textit{xx}} + \eta _p), \\ \tau _{\textit{yy}} f(\tau _{\textit{xx}}, \tau _{\textit{yy}}, \tau _{\textit{zz}}) = -\dot {\varepsilon }(\lambda \tau _{\textit{yy}} + \eta _p), \end{cases} \end{equation}
where
 $\dot {\varepsilon }$
is the extensional rate. Unlike simple shear, uniaxial extension yields
 $\tau _{\textit{yy}} \neq 0$
, so that
 $\text{tr}(\tilde {\tau }{\textit{pol}}) = \tau {\textit{xx}} + 2\tau _{\textit{yy}}$
. The system is solved iteratively in MATLAB using the same approach as for shear viscosity, and the extensional viscosity is obtained from
 \begin{equation} \eta _{\textit{ext}}(\dot {\gamma }) = \frac {\tau _{\textit{xx}} - \tau _{\textit{yy}}}{\dot {\varepsilon }}. \end{equation}
The Trouton ratio
 $Tr = \eta _{{\textit{ext}}} / \eta _{{\textit{pol}}}$
quantifies a fluid’s resistance to extensional flow relative to its shear resistance (Yang & Dou Reference Yang and Dou2005):
 \begin{equation} Tr = \frac {\eta _{\textit{ext}}}{\eta _{\textit{pol}}}. \end{equation}
For a Newtonian fluid
 $Tr = 3$
, whereas for non-Newtonian fluids
 $Tr$
can be substantially lower or higher depending on the extensional rate. Figure 23(a) illustrates the shear behaviour of the models across
 ${\textit{Wi}}_0$
for
 $\varepsilon \sim 0.0001$
, as a representative case. Figure 23(b) depicts the extensional behaviour, showing that the Oldroyd-B model predicts unbounded growth of the extensional viscosity, while the PTT model with
 $\varepsilon \gt 0$
exhibits a physically realistic saturation, thereby moderating the elastic response.
Constants of the CY model for various
 ${\textit{Wi}}_0$
and extensional parameters
 $ \varepsilon$
, corresponding to a viscoelastic fluid modelled with the PTT formulation.

Selected shear viscosity of viscoelastic models at
 $\varepsilon =0.0001$
, (b) Trouton ratio of viscoelastic fluids in some selected
 ${\textit{Wi}}_0$
.

Table 5 lists the fitted CY constants for various
 ${\textit{Wi}}_0$
and
 $\varepsilon$
. The fits are excellent, with
 $R^2 = 1.00$
, root-mean-square error values between 0.0001 and 0.0002, and mean absolute percentage error ranging from 0.12 % to 0.22 % across all datasets.

 Wi0
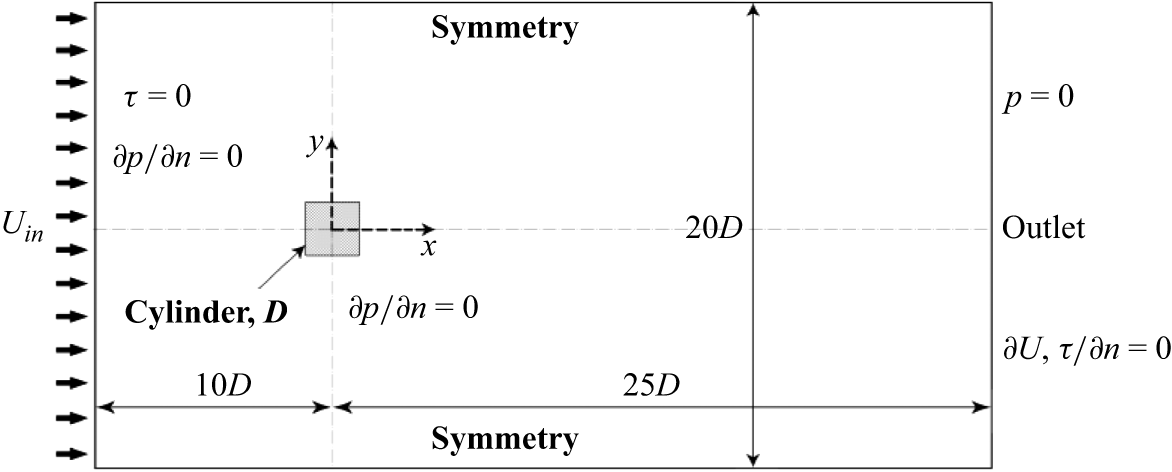
 D
 10D
 10D
 25D

 n

 CD
 Wi0
 CD/CD,Newt
 Wir
 Wir
 ε
 CD,Newt

 Wi0
 CDN
 τxx
 CDPn
 CDPt
 CDs
 CDpol
 CDP
 CD
 Wi0

 Wir
 ε=0.01
 Wi0
 ε=0.01

 ε=0.01
 CD,CY
 CD,Newt
 Wir
 CD
 Wir
 ε=0.1

 (1,0.25)
 ε=0.01
 Wi0=0.1
 Re0,cr
 Re0,cr

 Re0=47
 Re0=53

 Re0,cr
 Wi0
 Rer,cr
 Wir

 Wi0
 Wir
 ε∼0

 n=0.2235,λC=17.75,α=1.688
 ≡
 Wi0=1000
 ε∼0
 n=0.22448,λC=178.4,α=1.688
 ≡
 Wi0=10000
 ε∼0
 n=0.2265,λC=5687,α=1.6974
 ≡
 Wi0=10000
 ε=0.1

 ε=0.01
 Wi0
 Wi0=1
 Wir=1.5
 Wi0=5
 Wir=8.5
 Wi0=10
 Wir=20.1
 Wi0=100
 Wir=245.9
 Wi0=10000
 Wir=22980

 ε=0.01
 Wi0=10
 Wir=20.1

 N1
 ε=0.01
 β=0.8
 Wi0
 Wi0=1
 Wi0=4
 Wi0=6
 Wi0=10

 N1
 Wi0=4
 6
 10
 ε=0.01
 Re0=10,β=0.8
 Wi0

 ξ
 β=0.6
 Wi0=3
 Wi0=4
 Wi0=5
 Wi0=3
 ξ≈1

 x
 (x/D,y/D)=(0.8,0.2)
 ε=0.01
 Wi0
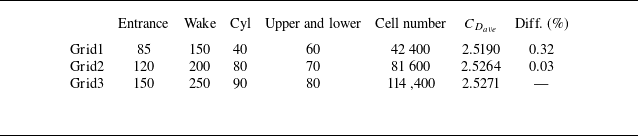

 CD
 CL
 Re0=40,Wi0=40,ε=0.1, and ξ′=0.01
 τxx/(η0U∞/D)
 u/U∞
 0.02D

 Re0=40
 Wi0=40
 ε=0.1
 ξ′=0.01

 τij
 x/D=0.53,y/D=0.53
 ε=0.1
 Re0=20
 Wi0=5000
 ε=0.01
 Wi0=10
 Re0=70
 Δt=0.001
 τxx∗
 τyy∗
 τxy∗
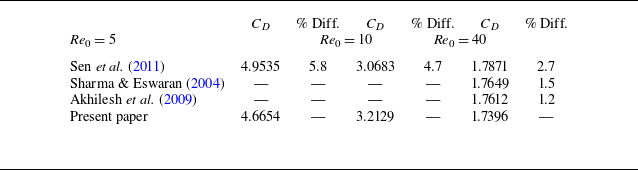
 Re0

 CD
 CL
 Re0=100
 Wi0=0.6
 N1
 y/L=1
 4:1
 ReL=0.01
 WiL=1
 β=0.5

 τxx
 τxy
 r
 θ=3π/4
 π
 θ=3π/4
 θ=π

 τxx
 0.03D
 x/D=0.53,y/D=0.53
 Re0=70
 τxx
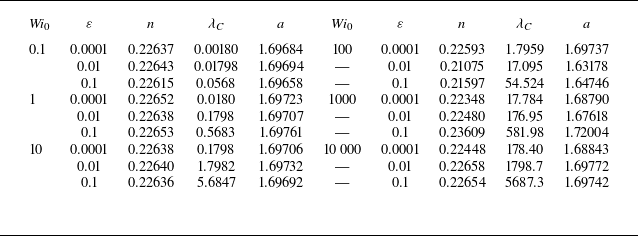
 Wi0
 ε

 ε=0.0001
 Wi0



