I. INTRODUCTION
The medium carbon Nb–V microalloyed steel, as typical nonquenched and tempered steel, has been widely used for cutting shaft parts in machine tool and other machinery industry. Reference Jahazi and Eghbali1,Reference Bakkali El Hassani, Chenaouia, Dkiouak, Elbakkali and Alomar2 This steel can be directly used for cutting products after shaping into parts, as the mechanical properties are obtained at the end of the forming process. So an important saving of costs and energy can be reached by reducing the number of operations (such as heat treatment and straightening). Reference Luo, Peng, Wang and Wu3–Reference Kaynar, Gündüz and Türkmen6 Recently, more and more attention has been paid on this kind of steel. Reference Shen, Zhang, Zhang, Xu and Shi7
This kind of steel is often produced by hot rolling or forging process, which consists of several deformation passes, including inter-pass periods between deformation passes. During the inter-pass periods in hot rolling, three distinct softening mechanisms may take place: static recovery, static recrystallization, and metadynamic recrystallization (MDRX). Reference Roucoules, Hodgson, Yue and Jonas8,Reference Xu and Sakai9 MDRX is the growth of dynamically formed nuclei after cessation of hot deformation. It can cause the changes of austenite grain size and distribution of steels. So it is important to investigate the MDRX behavior of steels.
Recently, a large amount of work has been performed to investigate the MDRX behavior during inter-pass time of dynamically recrystallized austenite. Lin et al. Reference Lin and Chen10,Reference Lin, Chen and Zhong11 have investigated the MDRX behavior of 42CrMo steel, and developed the softening kinetic equations and microstructure evolution model. Li et al. Reference Liu, Liu, Lin and Li12 have analyzed the effect of deformation temperature and strain rate on MDRX behavior of 300M steel. Beladi Reference Beladi, Cizek and Hodgson13,Reference Beladi, Cizek and Hodgson14 has proposed a novel mechanism of metadynamic softening in a Ni–30Fe alloy on the basis of the experimental investigation of the grain structure, crystallographic texture, and dislocation substructure evolution. Zhao et al. Reference Zhao, Zhao, Li and Lu15 have found that the MDRX of a V–N microalloyed steel can easily occur due to the low activation energy. Medeiros et al. Reference Medeiros, Prasad, Frazier and Srinivasan16 have studied the microstructure of MDRX in hot working of IN 718 superalloy, and the grain size was represented with the process parameters. There are also some researches about the MDRX behavior in aluminum and magnesium alloy Reference Ullmann, Graf, Schmidtchen and Kawalla17–Reference Lin, Li and Xia19 and titanium alloy. Reference Vo, Jahazi and Yue20,Reference Fan, Yang and Gao21 However, the studies on MDRX behavior of Nb–V microalloyed nonquenched and tempered steel are limited. It is well known that the recrystallization of steel can be influenced by the microalloyed elements of Nb and V. And by the retardation of recrystallization, the microstructure and property of the steel can be influenced. Reference Zhang, Liu, Liang and She22,Reference Baker23 Therefore, it is of great important to understand the MDRX behavior of Nb–V microalloyed nonquenched and tempered steel.
In this paper, the MDRX behavior of Nb–V microalloyed nonquenched and tempered steel was investigated by two-stage isothermal hot compression tests. The effects of deformation temperature, strain rate, initial grain size, and inter-pass time on the MDRX behavior were discussed. The kinetic equations and grain size model of the tested steel were developed. Based on the above mathematic models, an finite element (FE) model was built to simulate the MDRX process of the tested steel, and the simulation results were agree well with the experimental ones.
II. EXPERIMENTS
The chemical composition of the tested steel in this paper is given in Table I. To perform the isothermal hot compression tests, cylindrical specimens with a diameter of 8 mm and a height of 12 mm were machined. To reduce the friction between the anvils and the end faces of the specimens during the compression process, tantalum foils with a thickness of 0.05 mm were placed between anvils and specimens.
Chemical composition of the tested steel (wt%).

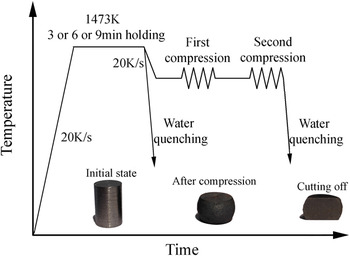
Isothermal hot compression tests were conducted on a Gleeble-1500 thermo-mechanical simulator (Dynamic Systems Inc., Poestenkill, New York). As shown in Fig. 1, the specimens were heated to 1473 K at the rate of 20 K/s and held for 3 or 6 or 9 min to make the alloyed elements completely dissolve and obtain different initial grain sizes. Then, the specimens were cooled to the testing temperatures (1273, 1323, 1373, and 1423 K) at the rate of 20 K/s and held for 30 s to eliminate the temperature gradient. Subsequently, the 1st compression was performed at a strain of 0.4 (all the critical stain for dynamic recrystallization (DRX) is smaller than 0.4) at the testing temperatures with the constant strain rates (0.01, 0.1, 1, and 5 s−1). When the 1st compression finished, the specimens were held for inter-pass time of 0.5, 1, 2, and 10 s. Then the 2nd compression was performed with the same processing parameters in the 1st compression. After the 2nd compression, the specimens were water quenched immediately to room temperature. Besides, to obtain the initial grain size, some specimens were water quenched before the 1st compression as shown in Fig. 1.
Experimental procedure for the two-stage isothermal hot compression.

To observe the microstructure of the specimens after compression, all specimens are sectioned along the longitudinal axis as shown in Fig. 1. Then, the longitudinal sections of the specimens were polished and etched. The microstructures in the sections of the specimens were examined by optical microscopy. The linear intercept method is used to calculate the average grain size.
III. RESULTS AND DISCUSSION
A. Initial microstructures and flow stress–strain curves
The initial microstructures of the specimens heated at 1473 K and hold for 3, 6, and 9 min are observed. And the initial microstructures before compression consists of equiaxed austenite grains and the average grain sizes of the three different holding times are about 92, 139, and 149 μm, respectively.
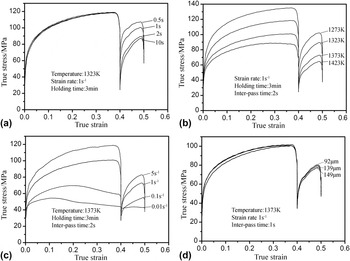
Typical stress–strain curves from the two-stage isothermal hot compression tests with different inter-pass times, temperatures, strain rates, initial grain sizes are shown in Fig. 2. It can be seen that all the stresses in second compression are lower than the interrupted stresses in the first compression, which indicates that some amount of softening has occurred. Because the strain imposed on the first compression is larger than the critical strain for the onset of DRX, so the softening type occurred during the inter-pass time is MDRX. It can be seen from Fig. 2(a) that the flow stresses in second stage compression decrease with the increasing of inter-pass time. This indicates that the softening fraction of MDRX increases with the increasing of inter-pass time. From Figs. 2(b) and 2(c), it is found that temperature and strain rate have significant influence on flow stress. The flow stress increases markedly with the decreasing of temperature and increasing of strain rate. But it can be seen from Fig. 2(d) that the flow stress reduces slightly with the increasing of initial grain size. Additionally, it should be pointed out that some flow curses in second compression exhibit platform, such as the curve of 0.01 s−1 in Fig. 2(c). The reason is that the inter-pass time is too short for enough amount of MDRX to be achieved, so the dislocation density retains high, then the work hardening and dynamic recrystallization rapidly reach balance in second compression.
Flow stress–strain curves of the tested steel deformed at different (a) inter-pass times; (b) temperatures; (c) strain rates; and (d) initial grain sizes.

B. Effect of processing parameters on the MDRX softening
In present study, the 0.2% offset-stress method is used to quantify the softening fraction of MDRX. Reference Fernández, López and Rodríguez-Ibabe24,Reference Djaic and Jonas25 The softening fraction X is determined as follows:
 $$X = {{{\sigma _{\rm{m}}} - {\sigma _2}} \over {{\sigma _{\rm{m}}} - {\sigma _1}}}\quad ,$$
where σm (MPa) is the interrupted stress in the first compression and σ1 (MPa) and σ2 (MPa) are the offset yield stresses for the first and second compression, respectively.
1. Effect of deformation temperature
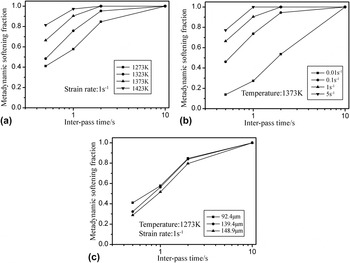
The effect of deformation temperature on the MDRX softening fraction at a strain rate of 1 s−1 is shown in Fig. 3(a). It can be seen that the deformation temperatures have a big influence on the MDRX softening fraction. The MDRX softening fraction increases with the increase of deformation temperature at a certain inter-pass time. The MDRX softening fraction at deformation temperature of 1423 K is larger and faster to obtain 100% than that at other deformation temperatures. This is because that the MDRX is a thermally activated process. Atomic vibrations can be enhanced with increasing temperature and the atomic-binding forces become weak, which promotes dislocation movement and then promotes recrystallization.
The effect of processing parameters on the MDRX softening fraction (a) temperature; (b) strain rate; and (c) initial grain size.

2. Effect of strain rate
The effect of strain rate on the MDRX softening fraction at a deformation temperature of 1373 K is shown in Fig. 3(b). It can be seen that the MDRX softening fraction increases with the increasing of strain rate at a certain inter-pass time. At an inter-pass time of 0.5 s, the MDRX softening fraction is 0.15 at strain rate of 0.01 s−1 and it increases to 0.79 at strain rate of 5 s−1. This is because that high strain rate increases the effect of work hardening and decreases the effect of DRX and DRV, which results in higher dislocation density and stored energy that contributes to the driving force of MDRX. In addition, high strain rate increases the nuclei of recrystallization which can accelerate the MDRX process. Reference Zhao, Zhao, Li and Lu15
3. Effect of initial grain size
The effect of initial grain size on the MDRX softening fraction at a deformation temperature of 1273 K and strain rate of 1 s−1 is shown in Fig. 3(c). It can be seen that the MDRX softening fraction increases with the decrease of initial grain size. In general, this is because that the smaller the initial grain size, the larger the area of the grain boundary in the per unit volume, which leads to an increase in the density of potential nucleation sites for recrystallization. However, this phenomenon is not very obvious, which means the MDRX softening fraction of the tested steel is not very sensitive to the initial grain size.
4. Effect of inter-pass time
From Fig. 3, it can be seen that with a constant deformation temperature, strain rate, and initial grain size, the MDRX volume fractions increase markedly with inter-pass time increasing before 1 s, while the increasing trend slows at the inter-pass time above 1 s. At the initial stage of MDRX, dislocation movement and grain boundary migration is driven by the stored energy, then the MDRX softening fraction increases rapidly. With the release of stored energy, the increasing trend slows at the end stage of MDRX.
C. The kinetics of metadynamic recrystallization
The kinetics of MDRX is widely defined by the Avrami equation of the following form Reference Vo, Jahazi and Yue20 :
 $${X_{\rm{m}}} = 1 - \exp \left[ { - 0.693{{\left( {{t \over {{t_{0.5}}}}} \right)}^n}} \right]\quad ,$$
where X m is the volume fraction of MDRX, and its value is assumed to be same as the MDRX softening fraction, t is the inter-pass time, n is the material constant, t 0.5 is the time for the MDRX softening fraction of 50%, which can be expressed as follows:
 $${t_{0.5}} = A{\dot \varepsilon ^p}\mathop {{d_{\rm{0}}}}\nolimits^q \exp \left( {{Q \over {RT}}} \right)\quad ,$$
where Q is the apparent activation energy of MDRX (kJ/mol), and T is the absolutely temperature, R is the gas constant (J/mol K), and p, q, and A are the material dependent constants.
1. Determination of n
To calculate the material constant n, taking the natural logarithm on the both sides of Eq. (2) twice gives
 $$\ln \left( {\ln \left( {{1 \over {1 - {X_{\rm{m}}}}}} \right)} \right) = \ln \,0.693 + n\,\ln \,t - n\,\ln \,{t_{0.5}}\quad .$$
By substituting the values of X
m obtained from Eq. (1) and the corresponding inter-pass times into Eq. (4), the relationship between
 $\ln \left( {\ln \left( \displaystyle{{1 \over {1 - {X_{\rm{m}}}}}} \right)} \right)$
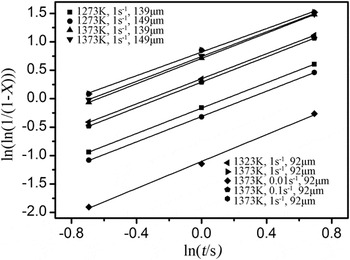
and ln t can be obtained, as shown in Fig. 4. Using the linear regression method, it is easy to obtain the average value of constant n as 1.113.
The relationship between ln(ln 1/(1 − X m)) and ln t.

2. Determination of t 0.5
Taking the natural logarithm on the both sides of Eq. (3) gives
 $$\ln {t_{0.5}} = \ln A + p\ln \dot \varepsilon + q\ln {d_0} + {Q \over {RT}}\quad .$$
According to Eq. (4), the values of t
0.5 under each condition can be calculated easily. Then, substituting the values of t
0.5 and the deformation parameters into Eq. (5), the relationships between ln t
0.5 and
 $\ln \dot \varepsilon$
, ln d
0, and l/T can be obtained. Using linear regression method, the apparent activation energy of MDRX is obtained as 127.366 kJ/mol, and the material dependent constants p and q are −0.378 and 0.227, respectively. Additionally, the material constant A can be obtained as 1.697 × 10⁻⁶ based on the above constants.
Therefore, the kinetics of MDRX of the tested material can be represented as the following:
 $${X_{\rm{m}}} = 1 - \exp \left[ { - 0.693{{\left( {{t \over {{t_{0.5}}}}} \right)}^{1.113}}} \right]\quad ,$$
 $${t_{0.5}} = 1.697 \times {10^{ - 6}}{\dot \varepsilon ^{ - 0.378}}{d_0}^{0.227}\exp \left( {{{127366} \over {RT}}} \right)\quad .$$
D. The grain size model for MDRX
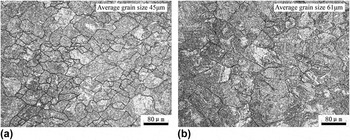
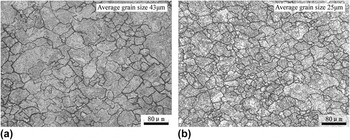
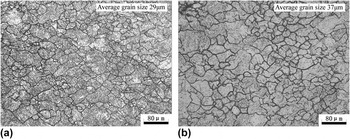
To investigate the MDRX grain size evolution model, the optical microstructure observation on the cross section of specimens at different deformation temperatures, strain rate, and initial austenite grain size are performed as shown in Figs. 5–7, respectively. It can be seen that the MDRX grain size increases with the increasing deformation temperatures and initial austenite grain size and decreasing strain rate.
The MDRX grain with a strain rate of 1 s−1, initial grain size of 149 μm, and deformation temperatures of (a) 1273 K and (b) 1373 K.

The MDRX grain with deformation temperatures of 1273 K, initial grain size of 92 μm, and strain rates of (a) 0.1 s−1 and (b) 5 s−1.

The MDRX grain with deformation temperatures of 1273 K, strain rates of 1 s−1, and initial grain sizes of (a) 92 μm and (b) 149 μm.

The MDRX grain size can be expressed as a function of deformation temperature, strain rate, and initial austenite grain size Reference Gu, Zhang, Zhang and Shen26,Reference Chen, Cui, Sui and Fu27 :
 $${d_{\rm{m}}} = C{\dot \varepsilon ^h}\mathop {{d_{\rm{0}}}}\nolimits^m \exp \left[ {{{Q'} \mathord{\left/ {\vphantom {{Q'} {RT}}} \right. \kern-\nulldelimiterspace} {RT}}} \right]\quad ,$$
where d m is the MDRX grain size. C, h, m, and Q′ are material dependent constants.
Taking the logarithm of both sides of Eq. (8) gives:
 $$\ln {d_{\rm{m}}} = \ln C + h\,\ln \,\dot \varepsilon + m\,\ln \,{d_0} + {{Q'} \mathord{\left/ {\vphantom {{Q'} {RT}}} \right. \kern-\nulldelimiterspace} {RT}}\quad .$$
Taking the grain size data into Eq. (9), the constants C, h, m, and Q′ can be obtained through multiple linear regressions. Then, the MDRX grain size evolution model for the tested steel can be expressed as follows:
 $${d_{\rm{m}}} = 1804.6{\dot \varepsilon ^{ - 0.12}}\mathop {{d_{\rm{0}}}}\nolimits^{0.63} \exp \left[ {{{ - 73778} \mathord{\left/ {\vphantom {{ - 73778} {RT}}} \right. \kern-\nulldelimiterspace} {RT}}} \right]\quad .$$
E. The verification of kinetics of MDRX
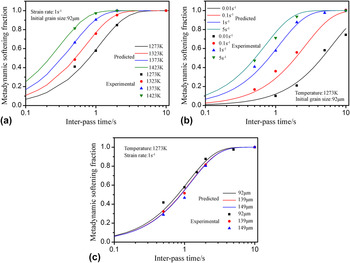
To verify the kinetics of MDRX obtained above, the comparisons of MDRX softening fraction between experiment results and calculated ones are illustrated in Fig. 8. It can be seen that the calculated results are in good agreement with experimental ones, which indicates that the kinetics of MDRX developed above can be used to predict the MDRX softening fraction for the tested steel.
Comparisons of MDRX softening fraction between experiment and calculated results with different (a) strain rates; (b) temperatures; and (c) initial grain sizes.

IV. NUMERICAL SIMULATION OF THE TWO-STAGE ISOTHERMAL HOT COMPRESSION
A. FE model
To investigate the MDRX behavior more clearly, an FE model has been developed with the above mathematical models using the commercial code MSC.Marc. According to the characteristics of axial symmetry, an eighth of the specimen is used in the FE model. The isoparametric hexahedral element is used and the element number of the FE model is 4500. An adiabatic heating condition is applied, and a shear friction model is used to model the friction at the die–specimen interfaces and the friction coefficient is 0.3. Reference Gu, Zhang, Zhang, Ruan and Zhen28 The friction coefficient 0.3 is comprehensively a consideration of real friction and the inhomogeneous temperature induced by deformation heating and heat transfer between die and specimen. The top die is set as a rigid body and moved along the central axis of specimen. The simulation process is from the beginning of the first compression to the finishing of the second compression, and the initial grain sizes are set as the values received from the experiments.
B. Simulation results analysis
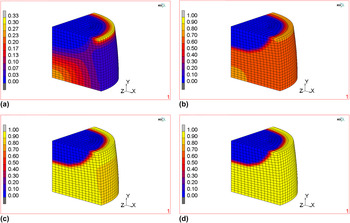
Figure 9 shows the recrystallization fraction during the two-stage isothermal hot compression under 1373 K and 1 s−1. It can be seen that the distribution of the recrystallization fraction is inhomogeneous. This is caused by the friction at the die–specimen interfaces, which leads to inhomogeneous strain and strain rate. The comparison of simulation result with experiment parameters illustrates that it is the central area of specimen that meets the process conditions. It can be seen from Fig. 9(a) that some amount of DRX has occurred during the 1st compression. Then the MDRX occurred at the DRX happening area during the inter-pass time, and the MDRX fraction increases with the increasing inter-pass time, as shown in Figs. 9(b)–9(d). This indicates that the strain imposed on the 1st compression is larger than the critical strain for the onset of DRX, and then the dynamically formed nuclei begin to grow during the inter-pass time, which is called MDRX.
Recrystallization fraction evolution during the two-stage isothermal hot compression under 1373 K and 1 s−1 (a) DRX fraction after 1st compression; (b)–(d) MDRX fraction at inter-pass times of 0.5, 1, and 2 s.

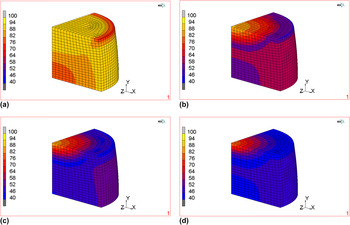
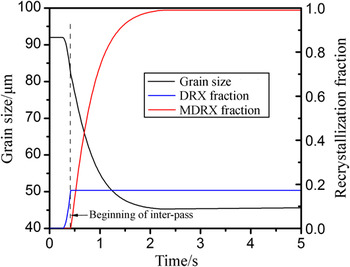
Figure 10 shows the grain size evolution during the two-stage isothermal hot compression under 1373 K and 1 s−1. It can be seen from Fig. 10(a) that the grain size becomes a little small after 1st compression, because of the occurring of some amount of DRX. Then the grain size continues to decrease with the increasing inter-pass time, as shown in Figs. 10(b)–10(d). This is because that the MDRX fraction increases with the increasing of inter-pass time and the average grain size decreases gradually. The grain size and recrystallization fraction evolution under 1373 K and 1 s−1 are shown in Fig. 11. It can be seen that about 16% volume fraction of DRX has occurred during the 1st compression, and the grain size decreases with the increasing volume fraction of DRX. When the inter-pass starts, the MDRX begin to occur. The MDRX completely finishes within about 2 s, which is identical to the experimental ones. The grain size decreases from the beginning of DRX to the finishing of MDRX, and the value decreases from 92 to 45 μm.
Grain size evolution during the two-stage isothermal hot compression under 1373 K and 1 s−1 (a) after 1st compression; (b)–(d) at inter-pass time of 0.5, 1, and 2 s.

Grain size and recrystallization fraction evolution during the two-stage isothermal hot compression under 1373 K and 1 s−1.

C. Numerical simulation verification
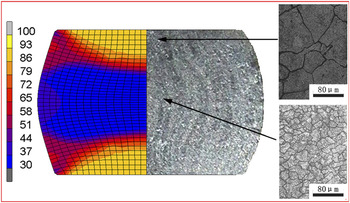
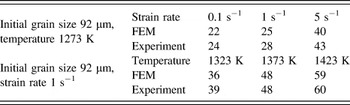
To verify the numerical simulation results, the grain size distribution after compression of FE model and experiment (under 1273 K and 0.1 s−1) is shown in Fig. 12. It is found that the grain size distribution in FE model is inhomogeneous. The grain size near the end face of the specimen is big and that near the center of the specimen is small. And the same phenomenon is found in experiment, which verifies the accuracy of the numerical simulation. Additionally, the average grain sizes obtained from FE model and experiment under different deformation temperatures and strain rates are shown in Table II. The grain size of FE model and experiment is taken from the area around center of the specimens. Because that the deformation in this area is closer to the setting conditions in the experiment. It can be seen that the simulation results agree well with the experimental ones, which illustrates that the FE model simulation results are reliable. Additionally, it also suggests that the obtained kinetics and the grain size model of MDRX of the tested steel are effective and accurate.
Grain size distribution of FE model and experiment under 1273 K and 0.1 s−1.

Comparison between the predicted and experimental grain size (μm).

V. CONCLUSIONS
The two-pass isothermal compression of a Nb–V microalloyed nonquenched and tempered steel has been conducted on Gleeble-1500 thermal-mechanical simulator. The MDRX behavior of the tested steel was analyzed based on the experiments. Besides, an FE model has been built to simulate the MDRX behavior. The main conclusions are summarized as follows:
-
(1) The MDRX softening of the tested steel increases markedly with the increasing deformation temperature, strain rate, and inter-pass time. And it decreases with the increase of initial grain size, but it is not very sensitive to the initial grain size.
-
(2) The MDRX grain size of the tested steel increases with the increasing deformation temperatures and initial austenite grain size and decreasing strain rate.
-
(3) The kinetics of MDRX softening of the tested steel can be expressed as follows:
 ${X_{\rm{m}}} = 1 - \exp \left[ { - 0.693{{\left( \displaystyle{{t \over {{t_{0.5}}}}} \right)}^{1.113}}} \right]$
;
${t_{0.5}} = 1.697 \times {10^{ - 6}}{\dot \varepsilon ^{ - 0.378}}\mathop {{d_{\rm{0}}}}\nolimits^{0.227} \exp \left( \displaystyle{{{127366} \over {RT}}} \right)$
, and the grain size model can be expressed as
${d_{\rm{m}}} = 1804.6{\dot \varepsilon ^{ - 0.12}}\mathop {{d_{\rm{0}}}}\nolimits^{0.63} \exp \left[ { - 73778/RT} \right]$
.
-
(4) Based on the above mathematic models, an FE model was built to simulate the MDRX process of the tested steel. The simulation results show good agreement with the experimental ones, which indicate that finite element method (FEM) is an effective approach to the analysis of the MDRX behavior and the established mathematic models of the tested steel are reliable and accurate.


ACKNOWLEDGMENTS
The authors are very grateful to the financial support received from the Suzhou Suxin Special Steel Group Co., Ltd, and the National Natural Science Foundation of China (No. 51604058).