Patients with coronavirus disease 2019 (COVID-19) have a wide range of clinical presentations, including asymptomatic infection. Reference Guan, Ni and Hu1 Asymptomatic severe acute respiratory coronavirus virus 2 (SARS-CoV-2) infections play a critical role in transmission dynamics given the infectivity of SARS-CoV-2. Reference Hu, Song and Xu2,Reference Syangtan, Bista, Dawadi, Rayamajhee, Shrestha, Tuladhar and Joshi3 The reported prevalence of asymptomatic individuals varies across settings from 1% to 57%. Reference Oran and Topol4–Reference Goldfarb, Diouf and Barth9 Quarantining asymptomatic patients is a crucial strategy for stopping the spread of the SARS-CoV-2 virus. However, asymptomatic infections are often difficult to identify because widespread surveillance has not been the norm in the United States. The rate of asymptomatic infections in healthcare settings is of particular concern becuase they may expose healthcare providers or other patients at high risk of developing severe disease. In an effort to control SARS-CoV-2 transmission within the hospital setting, some hospitals have implemented universal SARS-CoV-2 testing among all consecutive admissions. Reference Mizumoto, Kagaya, Zarebski and Chowell7–Reference Goldfarb, Diouf and Barth9
Our research group previously reported a 1% prevalence of asymptomatic infections at 2 large academic hospitals in Wisconsin from April to June 2020. Reference Rivera, Safdar, Ledeboer, Schaack, Chen and Munoz-Price10 However, as the pandemic intensified in Wisconsin, positivity rates among asymptomatic patients increased to 6% (data nonpublished). Predicting hospital-level asymptomatic rates using COVID-19 county-level data may be useful for individual facilities. Thus, we investigated whether COVID-19 rates reported at the county level could predict the SARS-CoV-2 positivity rates among asymptomatic patients tested in a large academic health system.
Methods
This observational study was conducted from April 23, 2020, to December 10, 2020 at Froedtert Health hospitals. Located in the greater in Milwaukee County, Froedtert Health comprises a large academic medical center and 2 community hospitals (961 beds and 46,206 admissions annually).
Asymptomatic SARS-CoV-2 infections
On April 23, 2020, Froedtert Health implemented SARS-CoV-2 surveillance among all consecutive hospital admissions not suspected of COVID-19, all patients scheduled for elective procedures and deliveries, and all asymptomatic patients with known exposures. Test orders were labeled with a different name than those tests used for symptomatic patients. Tests with orders used for symptomatic patients were excluded from this analysis. Providers collected nasopharyngeal and oropharyngeal swab specimens from patients according to institutional procedures, and samples were processed at Wisconsin Diagnostic Laboratory (WDL) using reverse-transcription polymerase chain reaction (RT-PCR). As previously described, Reference Rivera, Safdar, Ledeboer, Schaack, Chen and Munoz-Price10 both swabs were combined into a single container with viral transport media. Specimens were tested using the ThermoFisher TaqPath SARS-CoV-2 assay (ThermoFisher Schientific, Waltham, MA) or the Roche Cobas 6800 SARS-CoV-2 assay (Roche Diagnostics, Basel, Switzerland) according to the manufacturer’s instructions for use under the US Food and Drug Administration emergency use authorization.
COVID-19 cases in Milwaukee County
We accessed the Wisconsin Department of Health Services (WDHS) public COVID-19 database to obtain the daily numbers of newly COVID-19 cases confirmed in Milwaukee County. 11 The WDHS defines confirmed cases as those unique persons with positive SARS-CoV-2 molecular tests. The WDHS does not recognize a positive antigen or a positive antibody test as a confirmed COVID-19 case. 11
Statistical analysis
For the purposes of this study, COVID-19 rates or SARS-CoV-2 positivity rates were defined as the percentage of positive tests among all daily tests performed at the county level or within Froedtert Health, respectively. The association between daily positivity rates among SARS-CoV-2 asymptomatic patients at Froedtert Health (dependent variable) and daily COVID-19 rates in Milwaukee County (independent variable) was assessed using autoregressive moving-average time-series analysis (ARIMA). First, we fit a linear regression model to obtain the residuals (estimated errors). We then examined the residuals using the autocorrelation function and partial autocorrelation function plots. Finally, we estimated the parameters for the daily COVID-19 incidence rate in Milwaukee County and the ARIMA model for the residuals. We examined the residuals for the final model using autocorrelation function and partial autocorrelation function to confirm that there were no autocorrelated residuals. Two-sided P values <.05 were considered to be statistically significant.
We used patient ZIP codes to plot home addresses locations and to obtain their corresponding Area Disadvantage Index (ADI). 12 Maps were created using Excel 2016 3D Maps software (Microsoft, Redmond, WA) and Inkscape 2020 software (Inkscape Project, open source).
Results
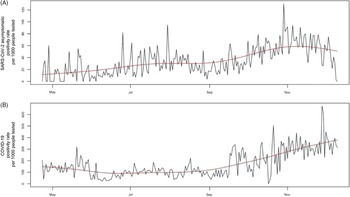
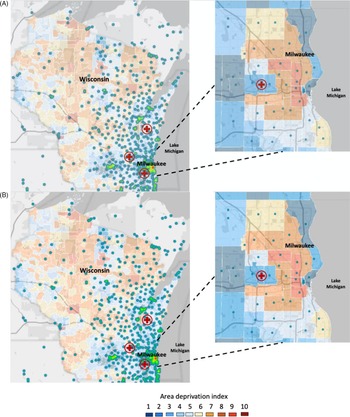
Over the 8 months of observation, 2,347 new asymptomatic infections occurred at Froedtert Health and 75,196 new confirmed cases in Milwaukee County. Figure 1 shows the time-series plots of SARS-CoV-2 asymptomatic positivity rates at Froedtert Health and COVID-19 rates in Milwaukee County. The overall positivity rate of asymptomatic infections at Froedtert Health was 37.8 per 1,000 people tested, and the overall positivity rate of COVID-19 infection in Milwaukee County was 172.3 per 1,000 people tested. Both monthly SARS-CoV-2 infection rates at Froedtert Health and the county-level COVID1-9 rates peaked in November 2020. In December 2020, the county-level COVID-19 rates were elevated, and rates of asymptomatic SARS-CoV-2 infections began to decline at Froedtert Health. The lowest COVID-19 rate at Froedtert Health was observed in May 2020, and the lowest COVID-19 rate for the county was observed in August 2020. To examine the association between the daily positivity rate of asymptomatic infections at Froedtert Health and the daily COVID-19 rate in Milwaukee County, we fitted a seventh-order autoregression for the residuals based on the autocorrelation function and the partial autocorrelation function. As the COVID-19 rate in Milwaukee County increased by 1 unit, the asymptomatic infection rate at Froedtert Health decreased by 0.024 units (95% CI, −0.053 to 0.004; P = .095) after accounting for autocorrelation over time. Thus, there was no strong association between positivity rates among SARS-CoV-2 asymptomatic patients at Froedtert Health and COVID-19 incidence rates in Milwaukee County. Supplementary Figure 1 shows the autocorrelation function and partial autocorrelation function plots of the residuals after fitting a seventh-order autoregression for error terms, which indicates that no autocorrelated errors occurred in the final model. Finally, most asymptomatic cases were located in Milwaukee County (Fig. 2A), even though the catchment area for all tests was fairly large (Fig. 2B). Based on ADIs, hotspots of asymptomatic patients occurred in the most disadvantaged areas in the county (Fig. 2B).
Time-series plots of positivity rates. (A) SARS-CoV-2 asymptomatic patients at Froedtert Health and (B) COVID-19 in Milwaukee County. The red line indicates moving average over time.

Map of ZIP-code addresses corresponding to Froedtert Health patients with positive SARS-CoV-2 asymptomatic patients (panel A) and total SARS-CoV-2 asymptomatic patients tested (panel B) with an overlay of area deprivation indexes at the county level. The numbers of positive asymptomatic cases (panel A) or total patients tested (panel B) are represented by circles with colors green, yellow, and red, representing lowest to highest number of tests, respectively. Area Disadvantage Index (ADI) scores in Wisconsin counties were shaded using colors blue (lowest) to red (highest). The red cross indicates the location of hospitals that belong to the Froedtert Health network. The map was created using Excel 2016 3D Maps software (Microsoft, Redmond, WA) and Inkscape 2020 software (Inkscape Project, open source).

Discussion
Using time-series analyses, we found that COVID-19 positivity rate at the county level was not associated with asymptomatic SARS-CoV-2 infections at a regional medical center after accounting for autocorrelation over time.
Universal testing for SARS-CoV-2 infections may help to identify asymptomatic infections and reduce SARS-CoV-2 transmission. However, implementing screening programs in cities or counties is difficult because it is expensive and logistically challenging. In addition, there are no national or international guidelines that define for whom, where, or when it is most feasible to perform massive screening for asymptomatic infections. In response, hospitals have implemented infection control and preventive measures based on how the COVID-19 pandemic behaves within the community, strengthening or relaxing restrictions based on COVID-19 epidemic curves at the state, county, or city level. However, it is important to consider that the patient population at an individual health system may not be representative of the population at the county level.
We used data from a single health system and a single county, which may have limited our analysis. We did not analyze individual-level data; thus, we were unable to determine whether differences among patients could affect the association between COVID-19 rate and asymptomatic infection rate. Also, we did not evaluate the effects of test availability at the county level and how this may have affected the incidence rates. Based on our findings, we suggest that COVID-19 rates at the county level may not be reflective of asymptomatic infection rates in local health systems. Each hospital needs to test its population to implement specific policies to reduce SARS-CoV-2 transmission regardless of county-level spread, especially when their patient population does not reflect the composition of the population at the county level.
Supplementary material
To view supplementary material for this article, please visit https://doi.org/10.1017/ice.2021.282
Acknowledgments
Financial support
This study was performed in part with support from the Advancing a Healthier Wisconsin Foundation.
Conflicts of interest
All authors report no conflicts of interest relevant to this article.