The development of social insurance has played an essential role in improving the well-being and working conditions of insured populations. After emerging at the end of the nineteenth century, public social insurance gradually captured greater shares of public spending and has spread progressively throughout the world. However, its rise has been very uneven and substantial differences remain, not only between developed and developing countries, but also among similar economies.Footnote 1
A vast amount of research has aimed at disentangling the sources of those international differences. Social spending shares of Gross Domestic Product have been used both in historical studies of the rise of welfare states and in contemporary work.Footnote 2 Yet, there are several problems with the social spending share measure. First, the definitions of social spending across countries are not uniform. Second, a focus on public programs misses private methods for protecting against risk in the form of employer pension and life insurance plans and family activities like long-term care of relatives. Third, social expenditure measures are sensitive to the economic cycle. A rise in unemployment could increase social expenditures as a share of GDP without any change in social welfare programs.Footnote 3
Seeking to produce more realistic pictures of welfare typologies, scholars have developed new definitions and classifications of welfare systems. The most influential contribution is still Gøsta Esping-Andersen's classification of welfare systems into three “worlds” —liberal, conservative-corporatist and social democratic.Footnote 4 But this approach and the extensions that followed face at least two problems. First, they assume that welfare categories are static, which misses the dynamic changes in policy orientation. Second, the classifications, which focus heavily on traditions and policy choice, dwell on the defining features of each typology and/or the causes for persistent specificities, and provide few quantitative measures for statistical work. Also, this perspective downplays the fact that social policy is driven by both domestic and external factors. Among the latter, trade and trade partners have been singled out as variables of special importance.Footnote 5
As an alternative way to measure the welfare state across countries, I have built a database of the parameters of old-age pension legislation for a sample of countries over an extended period of time.Footnote 6 I have then used those parameters to estimate the pensions that representative individuals with a given level of earnings and work histories would have received in each country and at each point in time. I focus on old age pensions because this category of spending constitutes one of the largest items in most government budgets, is still expanding, and is among the earliest forms of social insurance. As of 2007, public pensions represented 16.5 percent of total government spending in OECD countries with Italy at the top of the rank at 29.4 percent. Moreover, pension spending is projected to grow around 40 percent faster than GDP over the period 2010 to 2060.Footnote 7 Also, the long history of old age pensions allows the examination of a long period of time. It should be noted that generosity in old age pensions may not be matched by generosity in other programs, so some caution is needed in drawing general conclusions across all programs.Footnote 8
Finally, in the last part of this article, I use the estimates of the “generosity of the pension systems” drawn from the new database to address which factors have influenced these outcomes. Special attention is paid to the weight of domestic and external factors for which I will attempt to identify the most relevant channels of diffusion (or inhibition) of pension policy. By testing the effect of a number of a priori relevant socioeconomic variables, I will show which factors were strongly related with pension outcomes.
ESTIMATION PROCEDURES
The creation of a pension database has required gathering social insurance legislation for a significant sample of countries and a long time span. As for country cases, I have tried to cover classical categorizations of welfare traditions which may translate into significant differences in pension outcomes. Hence, selected countries include France, Germany, Italy, Portugal, Spain, Sweden, the United Kingdom, and the United States.Footnote 9
Pension calculation rules have been examined in these countries from the time when state pensions for dependent workers were first introduced until the present. Therefore, our database spans from 1889, when Bismarckian Germany introduced its pioneering system of old age pensions, until 2000. Pension legislation has been examined every ten years. For each of the periods and countries, information has been collected on the coverage of the system, top and bottom income thresholds, qualifying periods, calculation rules, maximum and minimum pensions, and other factors. Importantly, I have concentrated exclusively on public and general regime pensions. Although I will focus on pension outcomes and replacement rates in particular, other variables, particularly rules on coverage, help determine the generosity of pensions.Footnote 10
Pension calculation rules have been applied to workers with a given level of earnings and work history with the aim of providing a measure of the differential treatment of earnings by pension systems. Estimates have been developed for nine types of workers earning, respectively, 25, 50, 75, 100, 150, 200, 250, 300, and 400 percent of the average wage earnings before taxes.
Several assumptions have been made. First, earnings are flat during all working years, in a way that, for instance, a worker retiring in 1950 with earnings equaling the average level in the economy in that year is assumed to have had that nominal salary during his whole past work history.Footnote 11 Second, I assume that workers provided labor without interruptions from the age of 20 to the normal retirement age scheduled in each pension act. Third, in order to stick to the analysis of benefits strictly resulting from the provision of work and not increasing due to any personal circumstance, pensions are calculated for the case of single men without dependents. Fourth, and most importantly, I assumed that a worker retiring in year i had been subject during his entire working life to pension calculation rules applicable in year i. This assumption is analogous to demographers’ use of “period rates,” as opposed to cohort rates, which have been used in calculating life expectancy or divorce rates. Therefore, the analysis will capture only a short-run snapshot of each year's pension policy impact.
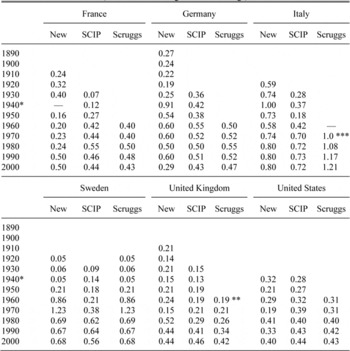
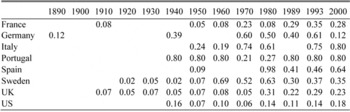
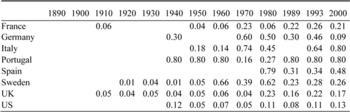
My data add to two other sources on pension generosity of widespread use. One is the Walter Korpi and Joakim Palme's Social Citizenship Indicator Program (SCIP) database, which covers 18 countries and provides information on different programs for the years 1930, 1933, 1939, 1947, 1950, and thereafter every fifth year up to 2000. The SCIP measures the replacement rates corresponding to a single worker with the gross average industrial wage. The second source is Lyle Scruggs’ data set of Welfare State Entitlements. In this case, female employees’ are explicitly included in the calculation of the average wage. The data is offered yearly for 18 countries between 1971 and 2002. Table 1 compares these two sources against my own results.
REPLACEMENT RATES OF PENSIONS WITH RESPECT TO EARNINGS, DIFFERENT SOURCES (workers with average level of earnings)

* Corresponds to 1939.
* Corresponds to 1961.
*** Corresponds to 1971.
Sources:
Scruggs, Welfare State Entitlements; Korpi and Palme, Social Citizenship; and author's own elaboration.
LONG-TERM TRENDS IN PENSION OUTCOMES
The history of old age insurance has translated into significant transformations of pension policies. This evolution is not only related to changing economic cycles in a century-long time span, but also to different welfare traditions. Esping-Andersen's classification of the worlds of welfare was an influential attempt to identify some of the most relevant differences and set welfare categories accordingly. His concept of the “world of welfare” was static, in essence, because it assumed that structural factors like culture or political tradition not only had determined the present shape of welfare regimes, but were to guide their future adaptations too.
However, this conceptual framework has been challenged in several ways. From the mid-1970s and up to the latest pension reforms resulting from the current financial crisis, most welfare states have experienced notable changes. Their extent is a matter of debate between studies suggesting that welfare states have entered a period of “permanent austerity” and those that interpret new policies as adaptations applied to well-rooted historical bases.Footnote 12
Independently, change has not only taken place in the public realm. In the last decades a new balance between public and private has emerged in welfare provision.Footnote 13 In this way, welfare protection has been partially brought back to the market, even though the impact of this process varies dramatically among particular programs. Some show a greater penetration of private arrangements, such as family spending, and programs like health spending are more inelastic to changes in the public-private mix.Footnote 14
As general as these trends might be, their effect on welfare states is still a function of the welfare tradition to which they belong. This applies especially in the case of globalization. While it is generally accepted that globalization has redrawn the borders of welfare typologies, the weight and sign of the changes caused by it remain subject to debate.
From a traditional point of view, focusing on the competitive pressure introduced by greater economic integration, public social spending may have shrunk as a result of a loss of independence of states to tax and finance public protection. Authors like Martin Rhodes, and Herman Schwartz argue that globalization has led countries to a retrenchment in social spending policies in order to maintain competitive advantages in the world economy.Footnote 15 A likely consequence of this is the greater prominence of private arrangements, thus narrowing the gap between welfare regimes with different degrees of state participation. On the other hand, a hypothesis based on the demand side for social spending argues that, in compensation for the undesired effects of greater openness, an expansion of social spending may follow.Footnote 16 Therefore, convergence in social provision would follow economic integration.
These two contradictory hypotheses may be reconciled after income levels are taken into account. Countries with minimal levels of protection would expand their welfare states to cope with higher economic volatility, while more developed countries with well-developed welfare state structures are bound to retrench.Footnote 17
In spite of these trends, the transmission of globalization risks is not uniform and only some industries and workers are affected by it. As the last wave of globalization has been skill-biased, earnings structures in developed countries have become more polarized.Footnote 18 As a result, the increasing threat posed by globalization on the lowest levels of earnings might have underpinned the desire to reinforce pension provision at the lowest levels, assuming that lower earnings translate into lower pensions as a consequence of less insurance contributions paid. Finally, the relationship between globalization and the welfare state has also been denied by some researchers, arguing that domestic and not external pressures are ultimately responsible for welfare state outcomes.Footnote 19 As a matter of fact, power resources, social coalitions, and the quality of political systems have been found to be critical to determining the sign of the effect of greater internationalization on social policy.Footnote 20 The largest differences arise between democracies and autocracies, but the ability to mobilize power resources is a key element to counterbalance some of the worst effects of openness, as the case of developing countries dramatically shows.Footnote 21
Nevertheless, the demand for policy intervention from citizens seems to differ according to each country's previous record of trade openness. When faced with economic openness for the first time, citizens lack a priori knowledge of which firms/sectors will fail. Therefore, economies may tend to endogenize risk and provide for adequate social policy at a general level. After this, further increases in openness would have marginal effects on the demand for social protection.Footnote 22
In my analysis, which is concentrated on a relatively homogeneous sample of developed countries, one may argue that the redefinition of the welfare state in the last years has been moderate because of the similarity between political regimes or already high levels of integration due to EU membership. Still, the intuition is that the boundaries of welfare state classifications have changed all the same. Therefore, the dynamic nature of welfare states must be stressed once again, as the following analysis will show.
DATA
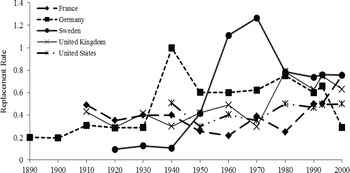
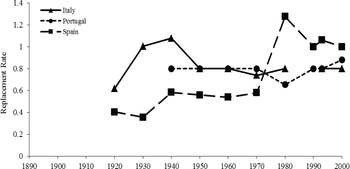
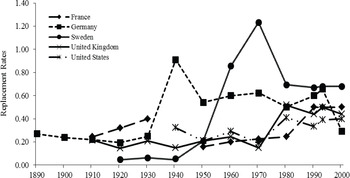
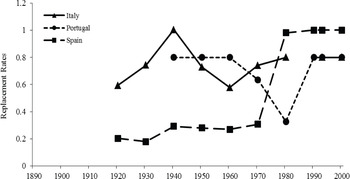
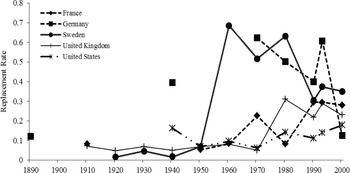
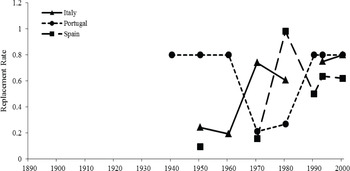
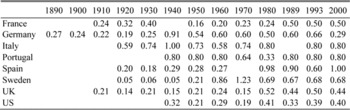
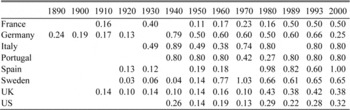
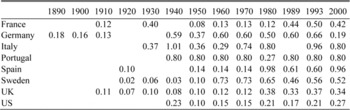
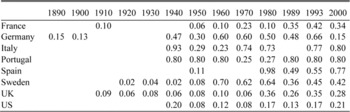
Figures 1A and 1B, 2A and 2B, and 3A and 3B display the replacement rate estimates corresponding to our sample of pension regimes. Each figure corresponds to a different type of worker defined by her earnings level.Footnote 23
According to the graphs, pension systems have evolved substantially and replacement rates of own earnings vary across earnings levels. At earnings of 50 percent of average earnings, replacement rates in Figures 1A and 1B for the United Kingdom, Sweden, and Spain were maximized as a result of flat pensions in most pension systems before World War II. After the war, it was mostly minimum pensions that raised replacement rates and generated redistribution.
However, between 1920 and 1940 a different pattern had already emerged in Italy, Germany, and Portugal, where rates approached full replacement by 1940. This had to do with the social policy of totalitarian regimes, where very high benefits were granted legally, even if these may not have translated in reality after waiting periods and subsequent legislation changes are taken into account. However, Italian and German differentials persisted after World War II, until around 1970. Sweden joined this group in 1960 after the country introduced the earnings related allmän tilläggspension (ATP) tier.
In general, the postwar era gave rise to “modern” pension systems, with a new treatment of pensions that was more sensitive to an adequate substitution of lifetime earnings levels at old age. Contributions as a function of earnings were therefore privileged. In fact, after 1950 all earnings levels were covered whereas, prior to that year, income limits had excluded higher earnings from benefits.Footnote 24 The prioritization of contributions to determine benefit levels produced the rise of replacement rates between 1950 and 1980. Italy and Germany experienced the earliest and most striking rises, but the increase became general between 1950 and 1980. Increases took place at all earnings levels but rose most for higher earnings. For instance, replacement rates rose on average for all the countries in the sample by 42.8 percent between 1950 and 1980 for workers with the average level of earnings. The rise was slightly lower (39.9 percent) in the case of pensioners who had earned 50 percent of average earnings, but for workers with 300 percent of average earnings, replacement rates rose by 120.5 percent during the same period. Therefore, the golden age of welfare states achieved the inclusion of high earners in exchange for a more generous growth of replacement rates than for other earnings categories. This may be interpreted as a way to avoid opting out from those workers, whose contributions were key to the financial sustainability of pension systems if even moderate redistribution within systems was desired. In fact, minimum pensions developed in parallel to this trend. See, for instance, the case of France, which in 1950 granted a minimum pension that was binding for earnings categories up to 100 percent of average earnings before falling to 75 percent of average earnings by 1970. In Germany, minimum pensions for low-income groups rose significantly, as the lifetime earnings of low-income workers with at least 25 years of coverage were raised for pension computation purposes to 75 percent of the national average wage.Footnote 25 However, this “agreement” between pensioners at various earnings levels was only feasible under continued economic growth and demographic equilibrium among age groups. That, of course, would not be the case in the following decades.
REPLACEMENT RATE OF PENSION BENEFITS AS PERCENTAGE OF OWN EARNINGS FOR INDIVIDUALS WITH 50 PERCENT OF AVERAGE EARNINGS

REPLACEMENT RATE OF PENSION BENEFITS AS PERCENTAGE OF OWN EARNINGS FOR INDIVIDUALS WITH 50 PERCENT OF AVERAGE EARNINGS

REPLACEMENT RATE OF PENSION BENEFITS AS PERCENTAGE OF OWN EARNINGS FOR INDIVIDUALS WITH 100 PERCENT OF AVERAGE EARNINGS

REPLACEMENT RATE OF PENSION BENEFITS AS PERCENTAGE OF OWN EARNINGS FOR INDIVIDUALS WITH 100 PERCENT OF AVERAGE EARNINGS

REPLACEMENT RATE OF PENSION BENEFITS AS PERCENTAGE OF OWN EARNINGS FOR INDIVIDUALS WITH 300 PERCENT OF AVERAGE EARNINGS

REPLACEMENT RATE OF PENSION BENEFITS AS PERCENTAGE OF OWN EARNINGS FOR INDIVIDUALS WITH 300 PERCENT OF AVERAGE EARNINGS

In the latest period, 1990–2000, it is interesting to look at the different effects of the wave of retrenchment on welfare states. Pensioners with low and average earnings experienced almost negligible changes in replacement rates. The exceptions were France, where replacement rates in the two lowest categories increased quite notably due to a significant rise in the minimum pension; and the United States and Spain, where pensioners with 100 percent of average earnings saw replacement rates rise mildly after the removal of relatively low pension ceilings. On the other hand, retrenchment occurred in the higher earnings categories (250 to 400 percent of the average), despite the fact that replacement rates grew in Spain, Sweden, the United States, and Italy after the removal of benefit capping.
Note, however, that the wave of retrenchment was earlier in some countries. For instance, the United Kingdom not only favored a gradual move towards privatization in 1980, 1986, and then 1995 that our analysis is not capturing, but also cut back pension generosity right after the significant progress that the introduction of an earnings-related tier (SERPS) in 1978 had meant. Moreover, these changes added to cuts in the basic, first-tier pension through stricter indexation.Footnote 26
Germany also retrenched earlier, as replacement rates in Figure 3A began to fall from 1960 in the highest categories, and from 1980 in the average ones in Figure 2A. A slight rise followed in the early 1990s, especially in the higher categories but then fell again in 2000 because pension points, which are awarded as a function of earnings and enter the pension formula as a multiplier, were capped at a notably lower level.Footnote 27
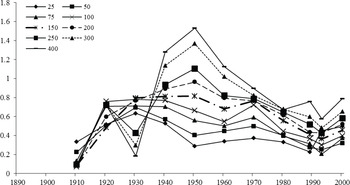
The information drawn from our database allows us to test for the cross-country convergence of pension benefits measured as replacement rates. Figure 4 shows the coefficient of variation of replacement rates as a measure of dispersion for each earnings level and year.
The dispersion increased from 1910 to 2000 in every category but the levels of dispersion in 1920 are almost the same as in 2000. There were large changes in between with peaks in 1950 for many higher earnings pensioners. Meanwhile, the dispersion for pensioners at middle and low earnings levels had flatter profiles and peaked around 1930 for categories up to 100 percent of average earnings and in 1940 for pensioners with 150 percent of average earnings. Generally, the dispersion around 1990 and 200 was substantially lower than in the peak years.
In general, the move toward economic integration that followed World War II has been associated with convergence of pension generosity for most of the period with a slight rise in dispersion between 1990 and 2000. However, the evolutions and peaks differ depending on whether high or low earnings levels are being examined. These differences show the important effect for cross-country dispersion of differences in the timing of the introduction of minimum pensions and the tightening of the link between contributions and pensions, by removing ceilings on pensionable earnings and benefits.
DISPERSION OF REPLACEMENT RATES BETWEEN COUNTRIES, FOR EACH LEVEL OF EARNINGS

THE DETERMINANTS OF PENSION POLICY
After examining the evolution of pensions throughout the twentieth century, the factors explaining these outcomes need to be identified. Therefore, I will examine the relationship between the log value of pensions and a number of correlates using my panel database. I have obtained coefficients for each of the nine earnings categories contained in the panel of data. Also, both country and year fixed effects are used to control for the time-invariant heterogeneity across countries and worldwide shocks.
Most of the variables tested are the “usual suspects” identified in the literature to explain welfare states and pension development.Footnote 28 I expect a positive relationship with real GDP per capita and with the share of the population older than 65—for both sexes together and for men only—due to “grey power.” The relationship with democracy is likely to be positive, although it is not straightforward.Footnote 29 I also check whether the share of male agricultural workers represented a burden for pension growth.
The effects of globalization are also measured. The degree of commercial openness may not capture adequately the external dimension of pension policy. Trade openness as a whole may not show how trade and economic interdependences affect the design of pension policy, so it is especially important to look at the country or group of countries with which economic exchange is more intense. Therefore, I examine two different channels of foreign influence on domestic policy, both dealing with bilateral trade. First, I look at the “dynamic adaptation” that may take place when a preferential trade partner has a generous pension regime.Footnote 30 The sign of this effect is ambiguous. On the one hand, a strong trade partnership could induce the replication of pension policy features, for instance, through ideological or policy transfers or, perhaps, as a way to control labor outflows to more generous schemes. On the other hand, the sign of the relationship could be negative if countries gave priority to the competitive advantage opened when trading with a generous welfare state. In this case, there is an incentive to keep pension standards low and compete through lower labor costs.
The second channel I look at is the “persistent” dimension of the effect of trading with an early pension developer.Footnote 31 Preferential trade partnership with an early adopter likely has a positive effect on domestic pension policy. My underlying hypothesis here is that trade with an early pension adopter means that some intangible elements, like shared traditions and ideology, in favor of welfare state expansion flow together with economic exchange and result in enhanced pension policy. Note that timing is the key element of analysis, as early adoption is not necessarily equivalent to generosity, either at the onset of the pension system in the leader countries or later.
The effect of migration rates on pension development is measured too. It has been shown that social insurance retains workers in their home countries while “welfare magnets” attract migrants to a small degree.Footnote 32 Inversely, a net share of incoming migrants may result in enhanced social spending for the lowest earnings categories, if policymakers choose to protect them against a more abundant supply of mostly low-skilled labor. The effect of migration is, thus, ambiguous.
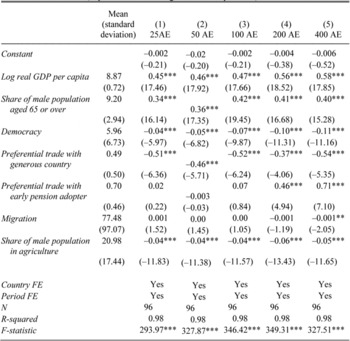
Table 2 reports the basic results. The effect of intense trade contact with an early adopter of pension insurance has a positive and significant sign in the high earnings categories of 200 to 400 percent of average earnings. This suggests that contact with a pension leader, irrespective of its later policy path, makes pension policy more generous for higher earners. Note, however, that the relationship is ambiguous and not statistically significant for average and lower earners. Therefore, the effect of trading with an early developer translates into the prioritization of the insurance-related aspects of public pensions. In other words, income replacement through insurance is favored and long, continuous contribution histories rewarded, typically through removal of earnings and contribution maxima. Interestingly, this would constitute a very particular interpretation of what the early welfare state meant, given that insurance principles dominated Bismarckian-based systems but this was clearly not the case in the United Kingdom, which also was an early adopter but more oriented towards universal benefits that guaranteed income security.
On the other hand, if the country is trading actively with a preferential partner with generous benefits, the coefficient is negative and statistically significant for all earnings levels. This means that, when a country trades with a generous welfare state, priority will be given to the competitive opportunity opened by this fact and pensions will consequently decrease.Footnote 33
There is no statistically significant relationship between migration rates and pension replacement rates until earnings reach 300 or 400 percent of average earnings. This might suggest that, in the light of their very long-term nature, pensions do not act as welfare magnets for migrants. Nor are they used to protect lower earnings against increased competition in labor markets due to new, mostly unskilled entrants. In the cases of net emigration, which dominate in the earliest observations of the sample, the absence of statistically significant results shows that the prospect of foregone pension benefits at the home country is irrelevant for the decision to migrate.
DETERMINANTS OF ESTIMATED PENSION OUTCOMES (dependent variable: log value of real pensions)Footnote 34

* Significant at the 10 percent level.
** Significant at the 5 percent level.
*** Significant at the 1 percent level.
Notes:
T-statistics are in parentheses. Democracy corresponds to the POLITY IV index of democracy in CIDCM; Preferential trade with generous country: dummy equal to 1 when a country has preferential trade with a generous pension system; Preferential trade with early pension adopter: dummy equal to 1 when a country has preferential trade with an early adopter of pension; and Migration: migration rate (immigrants + emigrants over total population)*100.
The coefficients on the share of male agricultural workers suggest that countries with larger shares of the agricultural workforce have lower pensions awarded.
Most of the remaining variables perform as expected. GDP per capita is positively related with pensions with an elasticity that ranges from 0.45 at low earnings levels to 0.58 at high earnings levels. The same applies for the share of men aged 65 or more. The positive coefficients show that “gray power” overcomes opposition based on worries about excessive pension burdens in deciding the amount of pensions provided.Footnote 35
The sign of democracy, however, constitutes a surprise, as it shows a negative relationship to pension provision for all earning levels. In light of this result, one may speculate that, if there is a positive connection between democracy and pensions, as hypothesized, it may have to do with the extension of benefit entitlement. This constitutes another side of pension generosity that is different from the benefit levels analyzed here.Footnote 36
CONCLUSION
The extension and popularity of social security throughout the world is one of the most important social and economic phenomena of the twentieth century. Therefore, the concern about whether social insurance has had a common pattern of evolution and if convergence among protection systems has taken place is well justified. This article is part of this wide debate, especially strong after the last wave of globalization. However, it has chosen a specific approach. First, it focuses on the very long run. Second, it uses a quantitative methodology that better captures the cycles of social security policy and, in particular, pensions.
The analysis of replacement rates of lifetime earnings shows that country differences matter and that distinctive welfare state traditions shaped pension outcomes, especially before World War II. At that time, differences between systems with a universal orientation and those based on prior contributions gave room to great divergences, especially in the treatment of higher earnings. To this divergence, one should add the distinctive pattern followed by the totalitarian regimes in Italy and Germany, which were ready to legislate (but perhaps not deliver) replacement rates that were far above the rest. These rates left an imprint on future postwar pension policy.
Another message drawn from the data is that pension systems are not neutral to earning levels. I have shown that there was a gradual change of perception of the aim of public pensions as a function of different earning levels. The early safety nets providing basic protection against destitution gave way, after World War II, to a greater sensitivity towards the replacement of earnings at all income levels in old age. This prioritization of income replacement is behind the rises of replacement rates between 1950 and 1980. The rises were positive for all earning levels but larger for the higher ones. Therefore, the golden age of welfare states achieved the inclusion of high earners through a relatively higher growth of replacement rates in these categories. The extension of the franchise was crucial for the social success of public pension systems but also was much needed for their financial sustainability, especially, if at least some redistribution among the insured was desired.
The article has also provided insight on the issue of convergence. Dispersion of replacement rates increased most through 1940. However, that does not mean that dispersion fell for all categories after that year. Dispersion rose somewhat for workers earning about the average or less during some periods.
The last part of the article was devoted to measuring the determinants of pension policy. In line with previous literature, income per capita had a positive effect on the level of pensions awarded, as did the share of elderly. Democracy did not produce more generous pensions.
Pensions are a product of both domestic policy and external factors. Intense trade with an early pension adopter raised pensions for higher earnings categories. This relationship is suggestive that the initial emphasis in the programs was on the insurance side of pensions. On the other hand, countries trading with generous welfare states had lower pensions, which could mean that they refrained from adopting higher pensions to gain a competitive advantage.
Appendix 1 Sources for the Pension Database
Pension Legislation Derived from:
France: 1910 in ILO, “Old Age Pensions”; 1920 in ILO, “French Government Bill”; 1930 in Oualid, “National Social Insurance”; 1940: ILO, “Old Age Allowances”; 1950 in Laroque, “From Social Insurance”; 1960 in US SSA, Social Security Programs, 1961; 1970 in AISS, Régimes; 1980 (1981) in US SSA, Social Security Programs, 1981; 1990 (1989) in Foster, ed., Employee Benefits, 1989; 2000 (2002) in US SSA, Social Security Programs, 2002.
Germany: 1890–1930 in US SSA, Social Security in America; 1940 in ILO, “Reform”; 1950 in US SSA, Social Security Programs, 1949; 1960–2000, see France.
Italy: 1920: Lex, Anno V–1919, pp. 537–56; 1930: Rabaglietti, Previdenza Sociale; 1940: Reale Decreto Legge 14 April 1939, n. 636, available in http://0-giuffre.iuritalia.com.bibliosun.iue.it/Lex/L_showdocall.asp, last accessed February 4th 2008; 1950–1980 and 2000: see Germany. For 1990 Foster, ed., Employee Benefits, 1993.
Portugal: 1940 in ILO, “Social Insurance”; 1950–2000, see Germany.
Spain: 1920–1950: Elu Terán, “Pensiones Públicas”; 1960–2000: see France.
Sweden: 1920–1950: Elmér, Folkpensioneringen; 1960–2000: see France.
United Kingdom: 1910–1920: MacNicol, Politics of Retirement; 1930: ILO, “New British Pensions Act”; 1940: ILO, “Social Insurance”; 1950–2000: see Germany.
United States: Kollmann, “Social Security”; 1950–2000: see Germany.
Earnings:
France: 1910–1940: 1911, 1927, 1930, and 1938. All towns over 10,000 inhabitants excluding Paris, adult males, hourly wage rates in Simiand, Le Salaire; 1950–2000: ILO, Yearbook.
Germany: 1890–1980; 1890 (1891): Scholliers and Zamagni, eds., Labour's Reward, appendix A4 (12), annual earnings, male and female. 1990–2000: ILO, Yearbook, male and female hourly earnings in nonagricultural activities.
Italy: 1920, 1930, and 1940 (1938) weighted average of agriculture and industry, both sexes. Nominal daily wages in industry, average. For agriculture, daily wages in Scholliers and Zamagni, eds., Labour's Reward, table A.6, appendix. Weights: 1920 and 1930 (interpolation of 1911 and 1936); 1940, of 1936 and 1951, in Cohen and Federico, Growth of the Italian Economy, p. 13; 1950–1990, nonagricultural activities in ILO, Yearbook; 2000 all activities, in ILO, Yearbook.
Portugal: ILO, Yearbook. 1940 (1935): escudos per hour in bricklayers; 1950–1990: escudos per month, both sexes in nonagricultural activities; 2000 (1999): escudos per month in all economic activities.
Spain: 1920–1960: weighted average of agricultural and industrial daily average (weights in Nicolau, “Población,” table 2.27, total active population, agriculture—agriculture and fisheries—vs. nonagriculture). Agricultural wage: 1920–1940: daily male average, Maluquer and Llonch, “Trabajo,” table 15.19. 1950 (53)–1960: national average daily salary in agriculture, Ibid, table 15.20, simple average of professional categories. Industrial wage: average industrial daily salary, weighted average of high and low qualification, Ibid, table 15.23. For 1940, take 1943 values. For 1970 (71) −2000: average earnings by worker and month, quarterly average; ibid, table 15.25.
Sweden: 1920: simple average of males in six industrial branches (mines, engineering, sawmills, pulp, food, and textiles), in Scholliers and Zamagni, eds., Labour's Reward, table A. 20, appendix; 1930–1940: men per hour, earnings in nonagricultural activities; 1950–1970, both sexes. 1980: simple average of earnings in manufacturing, men only; 1990 (1993)–2000: both sexes per hour in all activities.
United Kingdom: 1910–1980 (1979): average weekly earnings, all manual workers (males and females), in Scholliers and Zamagni, eds., Labour's Reward, table A.23, appendix; 1990–2000: annual earnings, all manual workers.
United States: total compensation, men and women, in Margo, “Wages,” table Ba4419.
-Earnings have been uniformed into yearly quantities using time of work in Huberman and Minns, “Times.” For Portugal, the Spanish time of work is used.
-Earnings and pensions outcomes transformed into U.S. dollars with the yearly average of real exchange rates; Global Financial Data.
GDP per Capita: 1990 International Geary-Khamis dollars; in Maddison, World Economy.
Agricultural Share: males only in Mitchell, International Historical Statistics.
United States, in Carter and Sobeck, “Employment,” tables Ba652-705.
France: 1940: interpolation of 1936 and 1946; 1950, of 1946 and 1954; 1970 of 1968 and 1975: 1910: 1911, 1920: 1921, 1930: 1931, 1960: 1962, 1980: 1982, 1990: 1991.
Germany: 1890: interpolation of 1882 and 1895; 1900: of 1895 and 1907; 1910 and 1920, of 1907 and 1925; 1930: 1925 and 1933; 1940 is 1939; 1990 is 1992 and 2000 is 2001. 1960–1980: data correspond to West Germany.
Italy: all years correspond to actual year plus 1, e.g., 1900 (1901), 1910 (1911). 1940 is an interpolation of 1936 and 1951.
Portugal: 1980 is 1981, 1990 is 1991 and 2000 is 2001.
Spain: 1920 is an interpolation of 1910 and 1930; 1960, of 1950 and 1964.
Sweden: 1940 is an interpolation of 1930 and 1945.
United Kingdom: all years correspond to actual year plus, e.g., 1900 (1901), 1910 (1911). 1940 is an interpolation of 1931 and 1951.
United States: 1930 is an interpolation of 1920 and 1940.
External Trade: Mitchell, International Historical Statistics. For the United States, Sutch, “Aggregate Measures,” Ca-10.
Bilateral Trade: Barbieri, Keshk, and Pollins, Correlates of War.
Population Share and Migration Rates: Mitchell, International Historical Statistics.
Life Expectancy: Life expectancy at birth (by year of death, period tables), in Human Mortality Database.
Appendix 2 Replacement Rate Database
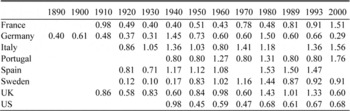
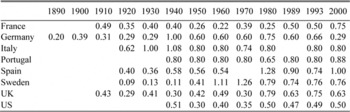
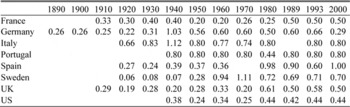
REPLACEMENT RATE OF PENSION BENEFITS AS PERCENTAGE OF OWN EARNINGS FOR INDIVIDUALS WITH 25 PERCENT OF AVERAGE EARNINGS

Source:
Author's own elaboration.
REPLACEMENT RATE OF PENSION BENEFITS AS PERCENTAGE OF OWN EARNINGS FOR INDIVIDUALS WITH 50 PERCENT OF AVERAGE EARNINGS

Source:
Author's own elaboration.
REPLACEMENT RATE OF PENSION BENEFITS AS PERCENTAGE OF OWN EARNINGS FOR INDIVIDUALS WITH 75 PERCENT OF AVERAGE EARNINGS

Source:
Author's own elaboration.
REPLACEMENT RATE OF PENSION BENEFITS AS PERCENTAGE OF OWN EARNINGS FOR INDIVIDUALS WITH 100 PERCENT OF AVERAGE EARNINGS

Source:
Author's own elaboration.
REPLACEMENT RATE OF PENSION BENEFITS AS PERCENTAGE OF OWN EARNINGS FOR INDIVIDUALS WITH 150 PERCENT OF AVERAGE EARNINGS

Source:
Author's own elaboration.
REPLACEMENT RATE OF PENSION BENEFITS AS PERCENTAGE OF OWN EARNINGS FOR INDIVIDUALS WITH 200 PERCENT OF AVERAGE EARNINGS

Source:
Author's own elaboration.
REPLACEMENT RATE OF PENSION BENEFITS AS PERCENTAGE OF OWN EARNINGS FOR INDIVIDUALS WITH 250 PERCENT OF AVERAGE EARNINGS

Source:
Author's own elaboration.
REPLACEMENT RATE OF PENSION BENEFITS AS PERCENTAGE OF OWN EARNINGS FOR INDIVIDUALS WITH 300 PERCENT OF AVERAGE EARNINGS

Source:
Author's own elaboration.
REPLACEMENT RATE OF PENSION BENEFITS AS PERCENTAGE OF OWN EARNINGS FOR INDIVIDUALS WITH 400 PERCENT OF AVERAGE EARNINGS

Source:
Author's own elaboration.