I. INTRODUCTION
A hypermonotectic alloy decomposes into two liquids when cooled in the miscibility gap. The liquid–liquid decomposition begins with the nucleation of the minority phase droplets. These droplets then grow by the diffusion of solute in the matrix. They can also move due to gravity, temperature gradient, or concentration gradient. The microstructure evolution during the liquid–liquid phase transformation is the result of the common actions of the nucleation and the diffusional growth/shrinkage of the minority phase droplets, the motions, and the spatial separation of phases. It is very complex. In particular, the motions of the minority phase droplets and the temperature difference inside the melt induce a strong flow field. The convections mix up the effects of all factors and make it extremely difficult to investigate the microstructure evolution in hypermonotectic alloys.Reference Zhao, Li and Zhao1 Efforts have been made to investigate the kinetics of the liquid–liquid demixing,Reference Zhao and Ratke2–Reference Wu, Ludwig and Ratke10 but the microstructure evolution and the convective effect remain an unsolved scientific problem. To clarify the mechanisms of the convective effect on the microstructure formation, directional solidification experiments were carried out with Al–Pb alloys. A model is presented describing the microstructure evolution during the liquid–liquid decomposition. The convective effects on the microstructure formation in hypermonotectic alloys are scrutinized.
II. EXPERIMENTS AND RESULTS
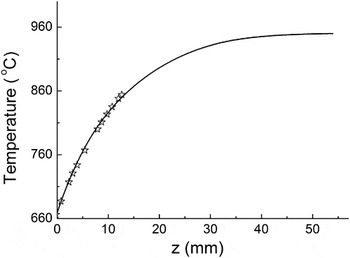
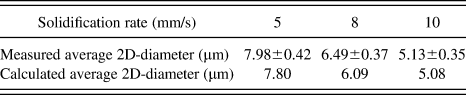
Al–Pb alloys were solidified by using a Bridgman-type solidification setup.Reference Li, Zhao and Zhang11 A graphite crucible was used as the sample container. The alloy was prepared by melting pure Al (99.99 wt.%), Pb (99.99 wt.%) in the crucible, heated to 950 °C, and the temperature held for 30 min to form a single phase liquid. The crucible was then withdrawn at different rates into a Ga–In–Sn liquid alloy bath. The samples have a cylindrical shape. The diameter and length of the samples are 8 and 120 mm, respectively. The sample weighs about 46 g. The temperature profile of the sample was measured by thermocouples. Figure 1 shows the sample solidified at the rate of 5 mm/s. Table I shows the average 2D diameter of the Pb-rich particles in the Al–5wt.%Pb samples solidified at different velocities. It shows that the Pb-rich particle diameter decreases with solidification velocity.
Measured (crosses) and calculated (solid line) temperature profile in front of the solidification interface along the central longitudinal axis (z) when the Al–5wt.%Pb alloy solidifies at a rate of 5 mm/s.

Average 2D diameter of the Pb-rich particles in the Al–5wt.%Pb samples solidified at different velocities.

III. ANALYSES OF THE MICROSTRUCTURE FORMATION
The microstructure in front of the solid/liquid interface may be described by using the droplet size distribution function f(R,r,z,t), which is so defined that f(R,r,z,t)dR gives the number of droplets per unit volume at position (r,z) and time t in a size class from R to R + dR. The f(R,r,z,t) obeys the following continuity equation during solidification:

where uSReference Ratke and Thieringer12 and uMReference Rogers and Davis13 are the Stokes and Marangoni velocities of the minority phase droplets. V is the velocity of the melt, I is the nucleation rate,Reference Christian14 and v is the growth/shrinkage rate of the minority phase droplets.Reference Zhao, Ratke and Feuerbacher15 R* is the critical radius for the nucleation of the minority phase droplets.
In the two-liquid-phase region the solute transfers through both the diffusion of solute in the matrix and the motion of the minority phase droplets. It may be reasonable to assume that outside the two-liquid-phase region the diffusional transport of solute is negligible small. The concentration field in front of the solid/liquid interface can then be obtained by solving the following partial differential equation:

where  is the supersaturation,
 is the equilibrium concentration at a flat interface boundary, C mix is the Pb content of the alloy, ϕ is the volume fraction of the minority phase droplets, C β is the concentration of the liquid within the droplet, Cm is the mean field concentration in the matrix liquid, and D is the diffusion coefficient. It can be related to the viscosity of the matrix liquid by using the Stokes–Einstein relation.
The temperature field in front of the solidification interface is determined by

where ρmix,  , and k mix are respectively the density, specific heat, and thermal conductivity of the alloy, ρm and ρβ are the density of the matrix liquid and minority phase droplets, respectively,
 and
 are the specific heat of the matrix liquid and minority phase droplets, respectively. QS/L = ρmixLV 0 is the heat released at the solidification interface per second. L is the latent heat of solidification and V 0 is the solidification velocity.
The flow field in the matrix liquid is determined by Eqs. (4) and (5):


where ηmix is the viscosity of the alloy, p is pressure, g is the gravity acceleration, β is the thermal expansion coefficient, and T m is the monotectic reaction temperature. No-slip conditions are imposed on the ampoule walls and solidification interface in the calculation.
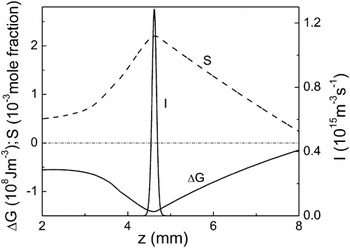
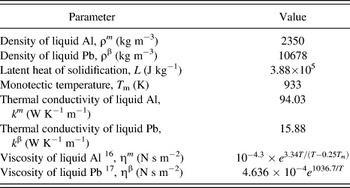
The microstructure evolution in the directionally solidified Al–5wt.%Pb alloys was calculated by solving the above equations numerically. The thermophysical parameters are given in Table II.The calculated temperature profile and average 2D diameter of the Pb-rich particles are shown in Fig. 1 and Table I. The agreement between the numerical results and the experimental ones verifies the model presented. Figure 2 shows the driving force and supersaturation for the liquid–liquid decomposition and the nucleation rate of the minority phase droplets as a function of position for the sample solidified at the rate of 8 mm/s. This indicates that the matrix melt becomes supersaturated when coming into the region of the temperature within the miscibility gap. Thereafter, the supersaturation and driving force increase continuously. The nucleation of the minority phase droplets begins at a critical supersaturation. The nucleation of droplets occurs only in a small region. After nucleation the droplets grow as they move toward the solidification interface until they are caught by the solidification interface. The Marangoni migration of droplets is overwhelmingly stronger compared with the Stokes motion of droplets. The upward Marangoni migration of droplets leads to a continuous increase in the droplet number density toward the solidification interface. When the spatial distribution of the nucleation rate, number density, and average radius of the minority phase droplets in front of the solidification interface do not vary with time anymore, the solidification comes into the steady state. A dispersed microstructure forms only if the steady state of solidification can establish. This requests that the minority phase droplets of all sizes and located at any position in the melt move toward the solidification interface or (u MZ + u S + V 0 + V CZ)∀(R,r,z) < 0, where u MZ and V CZ are respectively the z vector of the Marangoni migration velocity of droplets and the convective flow velocity of the melt. Thus, the downward Stokes motion of droplets favors the obtaining of the dispersed microstructure, while the upward Marangoni migration of droplets is against the formation of the dispersed microstructure. Convective flow is also against the formation of a dispersed microstructure.
Supersaturation of the matrix liquid (S), driving force for the liquid–liquid decomposition (ΔG), and nucleation rate of the minority phase droplets (I) in front of the solidification interface along the central z axis of the sample when the Al–5wt.%Pb alloy solidified at a rate of 8 mm/s.

Thermophysical parameters used in the calculations.

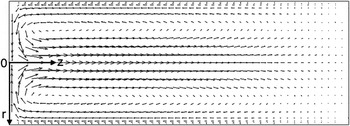
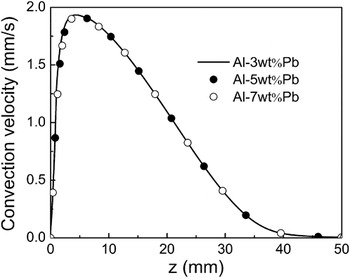
The calculated flow field in front of the solidification interface is shown in Fig. 3. The maximum convective velocity appears at the central longitudinal axis of the sample. It is about 1.93 mm/s for the alloys solidified at the rate of 8 mm/s. Calculations indicate that for Al–(3–7)wt%Pb alloys, the volume fractions of the minority phase droplets are very low and the flow field is dominated by the temperature gradient. It is almost independent of the composition of the alloys, as shown in Fig. 4.
Flow field of the melt in front of the solidification interface when the Al–7wt.%Pb alloy solidifies at a rate of 8 mm/s. The arrows show the direction of the local velocity. The size of the arrows indicates the strength of the convective flow.

Convective flow velocities of the melt in front of the solidification interface along the central z axis of the sample when the Al–Pb alloys of different compositions solidify at a rate of 8 mm/s.

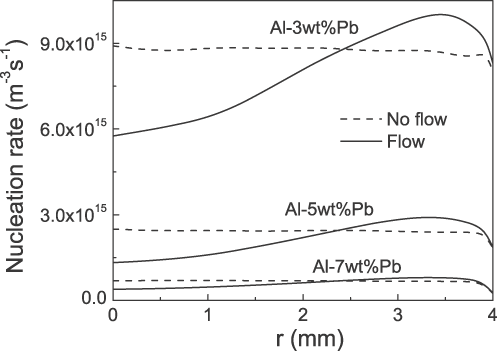
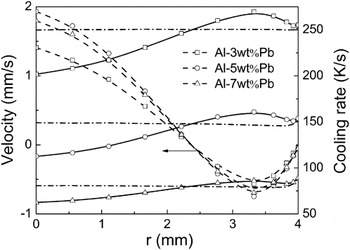
Figure 5 shows the maximum nucleation rate of the minority phase droplets as a function of the radial position. This indicates that in a sample without convections the nucleation rate shows almost a uniform distribution along the r direction except for a small region very close to the sample surface where the diffusional transfer of solute causes a decrease in the Pb content of the alloy before the beginning of the nucleation. The convections cause a nonuniform distribution of the nucleation rate. A convective flow against the solidification direction causes an increase in the nucleation rate while a convective flow along the solidification direction causes a decrease in the nucleation rate. That is, the nucleation rate is relatively low in the central region where the melt flows upward, and it is relatively high in the region close to the surface of the sample where the melt flows downward. This is mainly due to the variation of the local cooling rate of the melt caused by the convective flow, as shown in Fig. 6.
Maximum of the nucleation rate of the minority phase droplets in front of the solidification interface along the radial direction (r) of the sample when the Al–Pb alloys of different compositions solidify at a rate of 8 mm/s.

Cooling rate (solid lines) and z vector of the convective flow velocity (dashed lines) of the melt corresponding to the position where the nucleation rate of the minority phase droplets arrives at the maximum when the Al–Pb alloys of different compositions solidify at a rate of 8 mm/s.

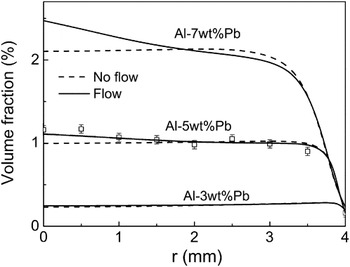
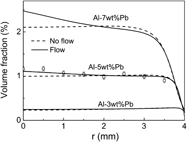
Figure 7 shows the variation of the volume fraction of the minority phase droplets. An upward convective flow causes an increase in the local volume fraction, while a downward flow leads to a decrease in the volume fraction of the minority phase droplets. In other words, the convective flow leads to a more nonuniform distribution of the minority phase droplets in the melt. It is directly against the formation of a well-dispersed microstructure.
Volume fraction of the minority phase droplets at the solid/liquid interface along the radial direction (r) of the samples when the Al–Pb alloys of different compositions solidify at a rate of 8 mm/s. The squares are the experimental results for the distribution of the volume fraction of the minority phase particles.

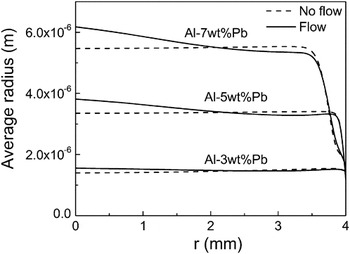
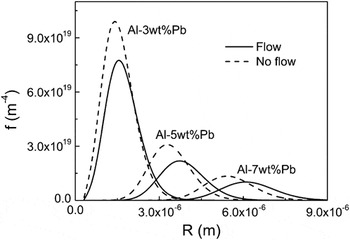
Figure 8 shows the average radius of the minority phase droplets in front of the solidification interface. The calculations indicate that an upward convective flow leads to a slower moving velocity of the droplets toward the solidification interface and, therefore, wins a longer growth/coarsening time for the droplets before they are caught by the solidification interface. Thus, one can conclude that convections lead to an increase in the maximum droplet size, as shown in Fig. 9, and make it more difficult to obtain a hypermonotectic alloy with a well-dispersed microstructure. The higher the Pb content of the alloy, the larger the increase in the maximum size of the droplets due to the convective flow (see Fig. 9), the stronger the convective effect on the microstructure formation.
Average radius of the minority phase droplets at the solid/liquid interface along the radial direction (r) of the samples when the Al–Pb alloys of different compositions solidify at a rate of 8 mm/s.

Radius distribution of the minority phase droplets at the solid/liquid interface when the Al–Pb alloys of different compositions solidify at a rate of 8 mm/s.

IV. CONCLUSIONS
Convective flow has a strong effect on the microstructure formation of hypermonotectic alloys. The convective flow against the solidification direction causes an increase in the nucleation rate, while the convective flow along the solidification direction causes a decrease in the nucleation rate of the minority phase droplets. The convective flow leads to a more nonuniform distribution of the minority phase droplets in the melt. It causes an increase in the maximum size of the minority phase droplets and is against the obtaining of the hypermonotectic alloy with a well-dispersed microstructure. For Al–Pb alloys, the convective effect on the microstructure evolution increases with the increase of the Pb content.
ACKNOWLEDGMENT
The authors are grateful for financial support from the National Natural Science Foundation of China (Nos. 51031003, 51071159, and u0837601).