




No CrossRef data available.
LEARNING TO FORECAST AND CYCLICAL BEHAVIOR OF OUTPUT AND INFLATION
Published online by Cambridge University Press: 01 February 2005
Abstract
This paper considers a sticky price model with a cash-in-advance constraint where agents forecast inflation rates with the help of econometric models. Agents use least-squares learning to estimate two competing models of which one is consistent with rational expectations once learning is complete. When past performance governs the choice of forecast model, agents may prefer to use the inconsistent forecast model, which generates an equilibrium where forecasts are only constrained rational. Output and inflation then display persistence, inflation responds sluggishly to nominal disturbances, and the dynamic correlations of output and inflation match U.S. data surprisingly well. The rational expectations equilibrium instead has great difficulty in matching any of these features.
Keywords
Information
- Type
- ARTICLES
- Information
- Copyright
- © 2005 Cambridge University Press
INTRODUCTION
One of the main objectives of macroeconomic modeling is to understand the joint behavior of aggregate output and inflation at the business-cycle frequency. Rational expectations models with nominal rigidities, workhorses of current macroeconomics, seem to have rather weak internal propagation mechanisms and therefore face substantial difficulties in matching the persistence inherent in output and inflation data. Matching the reactions of output and inflation in response to nominal shocks has proven especially cumbersome [e.g., Chari et al. (2000) and Nelson (1998)].1
This is not to say that matching the empirical impulse responses is impossible. However, it seems to require a battery of auxiliary assumptions, such as adjustment costs and habit formation [e.g., Christiano et al. (2001)].
The aim of this paper is to analyze what role deviations from rational forecasts might play in strengthening the internal propagation mechanisms of economic models and therefore their ability to match the data.
Presented is a simple business-cycle model with monopolistic competition, where prices are preset for one period and agents hold money to satisfy a cash-in-advance constraint. The model deviates from rational expectations by imposing the condition that agents can choose between either of two forecasting models to predict future inflation rates and that they must learn the parameters of the forecast functions.2
The restriction to only two such forecast models is crucial for the results that follow and detailed justifications are developed in the paper.
While one of the available forecast models can correspond to a rational expectations equilibrium once learning is complete, the other available model is “inconsistent” with rational expectations in the sense that it delivers misspecified inflation forecasts for any parameterization.
Although the forecasting restriction itself does not preclude that agents acquire rational expectations (in the limit), I find that agents may learn to use the inconsistent forecast model, giving rise to an equilibrium in which forecasts are only constrained rational. Use of the inconsistent model can be optimal because it induces a law of motion for inflation that causes both available forecast models to be underparameterized. Agents then prefer the inconsistent model whenever it provides a better approximation to the law of motion it generates.3
The term “better” should be understood in the sense of producing a lower mean-squared forecast error, which represents a quadratic approximation to a utility-based preference relation.
I find that the model's propagation mechanism with constrained rational expectations differs strongly from that under rational expectations. In particular, with constrained rational expectations the model is able to match important features of U.S. output and inflation data using white-noise nominal demand shocks as the unique driving forces. Output and inflation then show persistent deviations from steady state, output deviations tend to be followed by persistent inflation deviations in the same direction, and inflation is an indicator of future output losses. Although these features all show up in U.S. data, none of them is obtained when expectations are fully rational: Output and inflation are then white noise as the underlying shock process.
In the equilibrium with constrained rational forecasts, firms' prices initially underreact to nominal demand shocks. This is the case because inflation expectations fail to pick up immediately in response to the shock.4
In this equilibrium, expecations of future inflation depend on current inflation, which is preset.
Although the idea of allowing choice in a limited class of forecast models has been developed before, this has not been done in a business-cycle context. Evans and Honkapohja (1993), for example, consider an overlapping generations model that can generate endogenous cycles when agents choose between forecasting rules with different (constant) gain parameters. Sethi and Franke (1995) and Brock and Hommes (1997) both analyze models where agents choose between a (costly) rational predictor and a (costless) naive predictor. Evans and Ramey (1992) consider a model where agents can engage in costly expectation revisions and show that this may give rise to long-run nonneutrality and hysteresis effects.
Also, the learning approach to macroeconomic data has rarely been taken, the existing literature remaining largely theoretical.5
Evans and Honkapohja (2001) and Packalen (2000), for example, study the learnability of rational expectations equilibria in real-business-cycle models. Evans and Honkapohja (2003) and Bullard and Mitra (2002) study learnability in new Keynesian models.
Applications of learning models to financial markets include Timmermann (1993), Kasa (2004), and Bossaerts (2002). Further applications of learning models to financial markets and macroeconomics are introduced by Arifovic and Bullard (2001).
A number of empirical contributions have investigated the effects of deviations from forecast rationality, for example, Roberts (1997) or Ball (2000). Yet, the empirical literature almost never provides microfoundations for why deviations from forecast rationality may occur. Exceptions are Carroll (2003) and Branch (2003) who model the empirically observed expectations dynamics based on theories of infrequent expectations revisions and adaptively rational predictor choice, respectively.
The remainder of this paper is organized as follows. Section 2 describes important features of U.S. output and inflation that the model seeks to match. The business-cycle model is presented in Section 3 and its rational expectations solutions are outlined in Section 4. Section 5 introduces learning agents with forecasting constraints. Conditions under which such agents might learn rational or constrained rational expectations are determined in Section 6. This section also compares the implied equilibrium dynamics with features of U.S. data. Section 7 then discusses the generality of the mechanism leading to equilibria with constrained rational forecasts. Section 8 provides an outlook on work that lies ahead. Technical details can be found in the Appendix.
U.S. OUTPUT AND INFLATION: SOME FACTS
This section presents key features of the behavior of U.S. output and inflation that I seek to match in this paper.
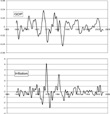
The subsequent analysis is based on U.S. GDP and GDP inflation for the period Q1:1959 to Q4:2002.7
GDP is the log of the GDP quantity index from NIPA Table 1.1.3 of the Bureau of Economic Analysis. GDP inflation is the logdifference of the GDP price index from NIPA Table 1.1.4 (Bureau of Economic Analysis) multiplied by 400 to obtain annualized inflation rates.
The filter takes out fluctuations with a frequency below 4 and above 32 quarters to get rid of seasonal and trend components. Filtering with an HP filter with a smoothing parameter of 1600 instead leads to very similar results.

Detrended U.S. data.
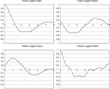
Figure 2 depicts the auto- and cross correlations of the detrended data. The panels on the main diagonal of the figure show the autocorrelation for output and inflation, respectively. Output and inflation are positively autocorrelated for about 1 year, which shows that there is considerable persistence in these variables. Thereafter, the autocorrelations turn negative, showing that above-average output (inflation) tends to be followed by below-average output (inflation) circa 1 to 4 years down the road. These findings are consistent with those reported by Stock and Watson (1999).

Auto- and cross correlations of U.S. output and inflation.
The lower-left graph in Figure 2 reveals that inflation is positively correlated with lagged output for about
years, with the maximum correlation being attained at around 1 year. This suggests that inflation responds sluggishly to output deviations. Correspondingly, the upper-right graph shows that output is negatively correlated with lagged inflation for about the first 3 years: Inflation is an indicator of future output losses. Taylor (1999) has called these features the “reverse dynamic cross correlation” of output and inflation. Qualitatively similar results have been reported by Fuhrer and Moore (1995) who estimated autocorrelation functions for output and inflation using a vector autoregression that included a short-term nominal interest rate.
Although an analysis of the dynamic correlations is informative about the comovements present in the data, it remains uninformative about the causes underlying these movements. Impulse response functions provide answers about potential causal links but require identifying assumptions.
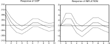
Figure 3 depicts the impulse response to a nominal demand shock obtained from fitting a vector autoregression (VAR) with two lags to yearly output and inflation data.9
Yearly data have been obtained by taking averages of the quarterly detrended values for each calendar year. Use of yearly data facilitates the comparison with the theoretical model that is presented in Section 3.
years to a monetary policy shock whereas output reacts well within the first year.

Impulse responses to a demand shock with 2 standard error Monte Carlo error bands.
Figure 3 shows the impulse response for a positive demand shock of a magnitude of 1 standard deviation. Output remains about 0.3 standard deviation above average in the year after the shock, illustrating that there is considerable output persistence. Inflation increases by about 0.4 standard deviation in both years after the shock, indicating that the price response is rather persistent, as suggested by the lower left panel in Figure 2.
In summary, the preceding analysis indicates that demand shocks should generate a persistent increase in output and a sluggish and persistent increase in inflation. Moreover, the rise in inflation should be followed by a persistent output decrease later in the cycle. The simple model discussed in the remaining part of this paper can replicate all of these facts using white-noise nominal demand disturbances as driving forces.
A SIMPLE BUSINESS-CYCLE MODEL
This section outlines a highly stylized business-cycle model with monopolistic competition [Dixit and Stiglitz (1977)] and sticky prices where firms set prices one period in advance.10
Prices can be reset each period.
In slight deviation from a standard setup there are two kinds of agents: entrepreneurs who own monopolistically competitive firms and finance consumption using the monopolistic profits, and workers who finance consumption by offering their services in a competitive labor market. To make the distinction between workers and entrepreneurs economically relevant, contingent-claim markets that would allow for risk sharing between workers and entrepreneurs are assumed to be unavailable. This ensures that workers' labor supply decisions do not depend on current and expected future profits and simplifies the analysis.
Entrepreneur i∈[0, 1] maximizes a standard utility function of the form

where cit denotes consumption, mit the entrepreneur's real money holdings at the end of period t, τt the real value of a possibly negative government cash transfer, Πt the inflation factor from period t−1 to t, and Φit the monopoly rents from ownership of firm i. The first constraint forces entrepreneurs to use money to pay for consumption goods. The second constraint is the flow budget constraint.
Each firm i produces an intermediate consumption good qi that is an imperfect substitute in the production of the aggregate consumption good c:

Profit maximization implies that each firm sets its price Pit as a fixed markup over expected production costs. When the production technology is linear in labor, this implies that

where Pt denotes the price index of the final consumption good and wt the real wage. Dividing the preceding equation by Pt−1 and assuming that all entrepreneurs and firms have identical expectations delivers

Equation (1) summarizes optimal behavior by firms.
Next, consider workers. Each worker j∈[0, 1] chooses consumption cjt and labor supply njt to maximize

When u, v∈C2, u′>0, u″<0, v′>0, v″[ges ]0,
for all c[ges ]0, and the cash-in-advance constraint is binding, utility maximization implies a labor supply function of the form11
For simplicity, we assume that agents hold point expectations, as is standard in the learning literature. Once the model is linearized, however, the point expectations may be interpreted as the mean of expectations with nontrivial support.

Inverting this labor supply function with respect to the first argument delivers an expression for the real wage,

where the linearity of the production function has been used to substitute nt by yt. Given the specified utility functions, the real wage increases in the demand for labor and in the expected inflation tax.
Finally, consider the government that issues money via lump-sum transfers.
12Alternatively, the government may issue money to purchase goods for government consumption.

where τt is a mean zero white-noise shock with small bounded support and is the only source of randomness in the model. When prices are preset and the cash-in-advance constraint is binding for all agents, output is demand determined in the short run and the previous equation is a specification of the demand side of the economy.13
Along a deterministic equilibrium path where the expected inflation factor is above the discount factor, the cash-in-advance constraint strictly binds if initial money balances are not too high. Also, in the stochastic case with small support for the shocks, surprise deflation and shocks to real cash holdings will be small, implying that agents will always wish to spend their entire money balances for consumption.

Using (1), (2), and (3), one obtains the temporary equilibrium equations that describe current output and inflation as a function of past output and expectations about future inflation rates:


The remaining part of the paper considers the linearizations of equations (4) and (5) around the deterministic steady-state equilibrium and makes different assumptions about how agents forecast inflation.
RATIONAL EXPECTATIONS EQUILIBRIA
Linearizing the model—equations (4) and (5)—around the deterministic monetary steady state yields the following linear approximation for the stochastic system14
In the monetary steady state, inflation is equal to 1 and output is given by
. As usual, there exists a second steady state where money is worthless.
The linearization uses the fact that (∂w/∂EΠt+1)/w=1 in a steady state where inflation is equal to 1, which follows from workers' first-order conditions. The linearization also assumes that the “law of iterated expectations” holds; that is, Et−1(Et[Πt+1])=Et−1[Πt+1].

where ε denotes the (real wage) elasticity of labor supply and
the steady-state output level. In Appendix Section A.2, we prove that the rational expectations solutions to (6) have a minimum state variable representation as a two-dimensional AR(1) process,

and that there are two rational expectations solutions of this form. The first solution is stationary and given by

Output in this equilibrium is white noise, and inflation responds with a delay of one period to output deviations. The second solution is nonstationary,

and diverging from the steady state (almost surely). The diverging paths have either increasing inflation rates and decreasing output levels or decreasing inflation rates and increasing output levels.16
The path with increasing output levels exists only in a local sense; see Adam (2003) for details.
LEARNING AGENTS
The preceding section considered rational inflation forecasts. This section considers agents who have to learn how to formulate their expectations.
In particular, agents are assumed to consider a limited set of econometric forecast models, to fit the considered forecast models to the data, and to choose the model with the best past prediction performance to forecast the future.
Although such behavior seems intuitively plausible, it requires that the modeler impose the set of forecasting models considered by agents. The next section supposes that agents consider a particularly simple set of forecasting models. The generality of the results obtained with this particular set are discussed in Section 7.
Learning to Forecast
Suppose agents consider the following set of simple regression models to forecast inflation rates:

Here, x denotes an explanatory variable that is believed to predict future inflation and (αt−1, βt−1) agents' least-squares estimates of the relationship between xt−1 and Πt based on information up to time t−1.
With the economy being described by two state variables (real output and inflation), there exist only two forecasting models of form (10)17
For simplicity the time subscripts for α and β will be dropped from now on.

Model Y predicts inflation using past output whereas Model Π uses past inflation. Importantly, Model Y can generate expectations that are consistent with the rational expectations equilibria (8) and (9), provided it is suitably parameterized. Model Π, however, never generates rational expectations since inflation never depends on lagged inflation in a rational expectations equilibrium.
Admittedly, the assumption regarding the set of forecasting models is ad hoc and in several ways quite special.18
Experimental evidence has given considerable support to the notion that agents consider simple forecasting rules of form (10); see Adam (2004).
Several economic interpretations exist as to why agents may consider a restricted set of forecasting models only. First, the prediction technology, that is, agents' knowledge about preparing and evaluating forecasts, may simply impose such a restriction upon them. Given the relative simplicity of the underlying economic model, restriction (10) may be interpreted as representing such a technological restriction. Second, a restricted set of forecast models may be the result of costs associated with the formulation of forecasts. Such costs cause agents to trade off forecasting performance with the cost of considering smaller or larger classes of models. Finally, the restriction may describe a situation in which agents perform a specification search for suitable forecast models and initially consider a certain simple class of models. Unsatisfactory prediction performance may then lead to changes in the considered class.19
The experimental evidence in Adam (2004) suggests that this might be the economically most relevant interpretation.
It remains to be explained how agents choose between competing forecast models. Given that agents use least-squares estimation, it seems natural to assume that the agents' model choice depends on the models' mean-squared forecast error (MSFE). In particular, agents are assumed to choose the model with the lowest past MSFE to predict future inflation. Use of the MSFE criterion can be justified on the grounds that it constitutes a second-order approximation to the correct utility-based choice criterion.
The previous assumptions imply that agents asymptotically forecast with minimal MSFE, provided learning converges and generates a stationary economic environment. Therefore, agents' forecasts will be constrained rational in any stationary equilibrium, where the equilibrium notion is made precise in the next section.
Equilibrium with Learning Agents
The economy now evolves as explained in the following. Each period, agents estimate both Model Y and Π by least squares and choose the model with the lowest past MSFE to forecast inflation. Agents then maximize utility, assuming that the economy evolves according to the forecasts from the selected forecasting model. This generates a new inflation rate and output level according to equation (6), where the operator E[·] might now denote the potentially nonrational expectations generated by the chosen forecast model. Using the new data point, agents adapt their least-squares estimates and their model choices, and the process repeats itself.
Informally, an equilibrium is a situation in which the new inflation rate and output level “reconfirm” the previous parameter estimates and the previous model choice and where a learning process would generate convergence to such a situation from starting points sufficiently close to it. The resulting equilibrium is called a model equilibrium, below.
To formally define a model equilibrium, one can build on the concept of a restricted perceptions equilibrium (RPE), developed by Evans and Honkapohja (2001), which I give here for convenience.20
The RPE has been called rational expectations equilibrium with econometric models by Anderson and Sonnenschein (1985). The RPE is related to the limited-information rational expectations equilibrium and the reduced-order limited-information rational expectations equilibrium developed by Marcet and Sargent (1989) and Sargent (1991), the consistent-expectations equilibrium of Hommes and Sorger (1997), and the self-confirming equilibrium of Fudenberg and Levine (1993) recently used by Sargent (1999) in a macroeconomic context.
DEFINITION 1. A restricted perceptions equilibrium in Model M (M=Y, Π) is a stationary sequence {yt, Πt}∞t=0 generated by equation (6) where agents use Model M with parameters (α*M, β*M) to forecast future inflation rates and where (α*M, β*M) is the orthogonal projection of Πt on

Note that the RPE takes the choice of forecast model as given and only requires optimality (in a mean-squared error sense) of the forecast model's parameterization. Building on this definition, one can then define a model equilibrium as follows.
DEFINITION 2. A Model M equilibrium (M=Y, Π) is a restricted perceptions equilibrium in Model M, where
- Model M generates a lower mean-squared forecast error than model M′={Y, Π}\{M}.
- The restricted perceptions equilibrium in Model M is expectationally stable (E-stable).
A model equilibrium requires optimality of agents' model choice and E-stability of the associated RPE. The former implies that agents forecast optimally, subject to the constraints that have been imposed. The latter ensures that agents can learn the equilibrium, since expectational stability usually governs the stability of equilibria under least-squares learning and related learning procedures [Evans and Honkapohja (2001)].21
The results of Evans and Honkapohja (2001, Chap. 13.1.2) suggest that this is the case even if the resulting equilibrium is not a rational expectations equilibrium.
CALCULATING MODEL EQUILIBRIA
This section derives conditions under which Model Y and Model Π equilibria exist and compares their properties with U.S. data.
Model Y Equilibria
Suppose that agents use Model Y to forecast inflation rates. Substituting the forecasts of Model Y for the expectations in the temporary equilibrium equations (6) implies that the actual law of motion for inflation will be given by

where the coefficients a and b depend on agents' least-squares estimates αY and βY.22
See Appendix Section A.3, for how to express Et−1[Πt+1] as a function of lagged output.
Equation (11) reveals that the actual law of motion for inflation coincides with the structural assumption of Model Y. This implies that in a Model Y equilibrium,

Otherwise the parameter estimates would not remain stable. Consequently, a Model Y equilibrium is a rational expectations equilibrium. The converse, however, is not necessarily true because a rational expectations equilibrium might fail to be stationary or expectationally stable.
Section A.3 of the Appendix shows that the stationary rational expectations equilibrium (8) is expectationally stable.23
Section A.3 also shows that the nonstationary rational expectations equilibrium (9) fails to be E-stable so that one could rule it out based on expectational stability alone.


A 1% money shock increases output and expected inflation by the same amount.24
Agents' Model Y estimate is asymptotically identical to equation (12).
Consequently, with rational expectations output and inflation are white-noise processes and inflation reacts with a delay of one period due to the stickiness of prices. The rational expectations equilibrium thus performs poorly in matching the features of U.S. output and inflation data shown in Section 2.
Model Π Equilibria
This section considers equilibria in which agents use Model Π to predict inflation rates. As argued before, agents' expectations are then only constrained rational.
Preliminaries
Suppose agents use Model Π to forecast inflation rates. Since least-squares estimates deliver forecasts that are (on average) unbiased, average inflation in a Model Π equilibrium will coincide with average expected inflation. Given that such a relation holds only at a (rational expectations) steady state, average output and average inflation in a stationary Model Π equilibrium will be same as in a Model Y equilibrium.
As a result, only the second moments of output and inflation will be affected by the use of Model Π. Moreover, on a more technical level, it implies that one can linearize the model around the same steady-state values as one usually does when calculating the linearized rational expectations solutions.
Substituting the predictions of Model Π for the inflation expectations in (6) delivers an equation that describes current inflation and output as a function of the past values of these variables, the Model Π parameters (αΠ, βΠ), and the labor supply elasticity ε25
The relevant features of this process are unaffected by the average level of output
.

The preceding equation reveals that in a potential Model Π equilibrium, inflation depends (generically) on past inflation and past output. The law of motion for inflation thus lies outside the class of forecast models that agents consider. With all forecast models being misspecified, Model Π may deliver a better fit to (14) than Model Y.
Existence of Model Π Equilibria
This section discusses conditions under which a Model Π equilibrium exists.
The least-squares estimate of βΠ in Model Π equilibrium is given by

where Πt is generated by the actual law of motion (14). Since βΠ also enters equation (14), determining a Model Π equilibrium involves solving a fixed-point problem, as when calculating a standard rational expectations equilibrium. Section A.4 of the Appendix shows how to solve for the fixed-point β*Π of equation (15).
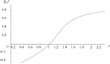
Figure 4 graphs β*Π as a function of the labor supply elasticity ε. It is shown that β*Π increases with ε and is equal to zero for ε=1. The case ε=1 is special because a 1% demand shock then generates a 1% increase in expected costs. Markup pricing by firms then causes inflation to increase by 1%. This drives the excess money balances back to zero. As a result, there is no persistence in excess demands and inflation as in the rational expectations equilibrium. As labor supply becomes more elastic, however, a 1% demand shock generates a less than proportionate labor cost and inflation increase. Excess money balances are then not devaluated in a single period but persist into future periods where they again cause above-average costs and inflation. Inflation is then positively autocorrelated, which explains the positive slope in Figure 4.

β*Π as a function of ε.
Now, substitute the solution for β*Π together with α*Π=1−β*Π into equation (14).26
The relation α*Π=1−β*Π follows from the unbiasedness of least-squares forecasts and
.
These and the subsequent boundaries are only approximate.
For the RPE to be a Model Π equilibrium, one has to verify that use of Model Π is indeed optimal and that the RPE in Model Π is expectationally stable (E-stable).
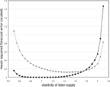
Expectational stability of the RPE is shown to hold in Section A.5 of the Appendix. This leaves the question of whether Model Π can outperform Model Y in terms of its mean-squared forecast error. Clearly, for values of ε around 1, this cannot be expected because past inflation has almost no predictive power. However, for larger and smaller values, inflation is increasingly autocorrelated; see Figure 4.
Figure 5 depicts the mean-squared forecast errors of the two forecast models for various values of ε, assuming that the economy is in an RPE in Model Π. The graph reveals that for a sufficiently elastic labor supply (εn,w[ges ]1.75), Model Π will indeed generate better predictions than Model Y, which establishes the existence of Model Π equilibria.28
Admittedly, the required supply elasticity lies on the high end of plausible values. However, similar elasticity levels are not uncommon in the macroeconomic literature. Christiano et al. (1997), for example, report satisfactory performance of a limited participation model for a labor supply elasticity of 2.

Mean-squared forecast error, Model Y $(\smash{\raise0.6pt\hbox{–}}\ddiam\smash{\raise0.6pt\hbox{–}})$ vs. Model Π $(\smash{\raise0.6pt\hbox{–}}\drect\smash{\raise0.6pt\hbox{–}})$.
Output and Inflation in Model Π Equilibrium
This section presents the output and inflation dynamics in Model Π equilibrium and compares these with the behavior of U.S. data. For illustrative purposes the section assumes a labor-supply elasticity of ε=1.8, which is at the lower end of values for which Model Π equilibria exist. The effects of larger elasticity values are discussed at the end of the section.
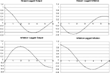
Figure 6 depicts the auto- and cross correlations of output and inflation in Model Π equilibrium for six model periods. This corresponds to the 6 years of U.S. data shown in Figure 2, provided that a model period is interpreted as a year.29
Figure 6 depicts the correlations for the unfiltered data. Transforming these “yearly” data into four equal quarterly values and applying the bandpass filter that has been used for detrending the data lead to a very similar graph. Unfiltered data are shown because they allow for a clear interpretation in terms of the model's mechanisms.

Auto- and cross correlations in Model Πequilibrium.
The auto- and cross-correlations shown in Figure 6 match those of Figure 2 remarkably well: Output and inflation are persistent; both variables are positively correlated for short lags and negatively for longer lags; output is a positive leading indicator for inflation, and inflation is a leading indicator of future output losses. However, none of these features shows up in a rational expectations equilibrium.
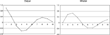
Figure 7 depicts the impulse responses to a demand shock in a Model Π equilibrium. The shock hits the economy in period 1. Inflation in period 2 reacts only sluggishly, causing output to remain above its steady-state level. Inflation increases further in period 3 and remains positive until period 4, thereby driving real balances and output below their steady-state values. Output and inflation then slowly return to their equilibrium values. Again, the shock responses qualitatively match the estimated responses for U.S. data shown in Figure 3.

Impulse responses to a demand shock in Model Π equilibrium.
The sluggish and persistent reaction of inflation in response to a demand shock can be explained as follows. In general, inflation increases because firms expect either inflation or real wages to increase. When a demand shock hits the economy, current prices are preset. This together with the use of Model Π implies that inflation expectations are “preset” and that wage expectations initially drive inflation. Since labor supply is relatively elastic, wages are expected to increase only slightly and the demand shock generates a rather weak initial inflation reaction. Once inflation has picked up, however, inflation expectations pick up and start to drive actual inflation, explaining why inflation in period 3 is even higher than in period 2. Since inflation expectations have been underreacting initially and are unbiased on average, they now overreact. This causes inflation to remain positive and drives output below its steady value.
I now briefly discuss the effects of a more elastic labor supply for the impulse responses shown in Figure 7. Clearly, the larger ε, the lower the expected cost increase. This causes the initial inflation response to be even more sluggish. Once inflation has picked up, there are two opposing effects. On the one hand, inflation shows higher persistence; see Figure 4. This causes expectations to increase more strongly in response to any given initial inflation increase. On the other hand the initial inflation increase has been less pronounced. As it turns out, the net effect is positive and the peak of inflation is higher than the one shown in Figure 7. Higher elasticity values thus generate a more sluggish initial inflation reaction, but a stronger reaction thereafter. This results in a shorter length of the cycle, and the correlations shown in Figure 6 cross the axis at an earlier date.
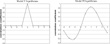
Note that the Model Π equilibrium, unlike the Model Y equilibrium, also generates empirically plausible real wage behavior. In particular, real wages are lagging over the output cycle in Model Π equilibrium, a feature documented by Galí and Gertler (1999) for the United States. Figure 8 displays the output–real wage correlation in Model Y and Model Π equilibria, respectively.30
The labor-supply elasticity is assumed to be given by ε=1.8. Higher elasticity values lead to similar pictures. The correlations have been obtained numerically from 10,000 simulated data points.

Correlation between output (t) and wage (t + i).
DISCUSSION
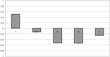
The previous sections have presented a model of constrained forecast rationality that accounts for persistence in a novel and arguably reasonable way. As is the case with all models of constrained rationality that do not ultimately converge to rational expectations, agents make systematic forecast errors. This is illustrated in Figure 9, which displays the autocorrelations for the one-step-ahead forecast errors in Model Π equilibrium.31
The figure assumes ε=1.8, which is the value used in the previous section. Higher elasticities lead to very similar error structures. The autocorrelations have been obtained numerically from 10,000 simulated data points.

Autocorrelation of forecast errors in Model Π equilibrium.}
In this simple model it is easy to see how agents could improve their behavior in Model Π equilibrium: They would have to include lagged output as an additional regressor in their forecast function. Yet, it seems reasonable to think that in more complicated models, such improvements may be difficult to find and evaluate. Already in a Model Π equilibrium, it takes on average more than 33 data points until a Box-Pierce test first rejects the hypothesis of no correlation in the forecast errors.32
This number has been obtained by running 10,000 Monte Carlo simulations where agents perform a Box-Pierce test for the first lag with a 1% critical value each time a new data point is obtained. The reported number is the average time until the first rejection of the null hypothesis of no correlation. Performing the test with lags 1–2 or 1–3 leads to very similar results.
More generally, one might ask under what conditions constraints on agents' prediction technology give rise to equilibria in which forecasts are constrained rational. Clearly, a necessary requirement for such equilibria to exist is that the class of forecast models is “open” in the sense that the use of some forecast model causes the actual law of motion of the forecasted variable to lie outside the considered class.
For the present model, there exists an apparently obvious way to obtain a closed class. One simply has to add a model containing both lagged output and lagged inflation to the two models considered thus far. The induced laws of motion will then depend at most on lagged output and inflation; see equation (6).
This argument, however, is not entirely convincing. Once agents use forecast equations with two variables they might as well consider other two-variable systems, including an equation where inflation is assumed to depend on lagged and twice-lagged inflation. Use of the latter forecast model will lead to an actual law of motion where inflation depends on three variables (two lags of inflation and one lag of output; see equation (6)). The class of forecast models will then be open again. A similar logic applies when allowing for three or more variables in the forecast equations.
In general, openness in linear models remains always a possibility as long as the maximum number of lags is finite.33
However, openness is only a necessary condition for model equilibrium with constrained rational expectations to exist. Once the number of models in the class increases, the class of competing models increases as well and the candiate model projecting the actual law of motion outside the considered class is less likely to deliver the best approximation to that actual law.
Closedness is likely to be even more difficult to obtain when allowing for nonlinear forecasts and/or nonlinear models. Moreover, models deviating from the representative-agent assumption and allowing agents to have heterogeneous forecasting capabilities may also increase the likelihood of openness in the sense above.
In the light of this discussion the openness property of the class of simple regression models considered in this paper seems to be a virtue rather than a deficiency since openness is likely to be obtained in many situations involving forecasting constraints.
OUTLOOK
Some questions related to the findings in this paper might deserve further attention. First, it seems desirable to evaluate the existence and empirical performance of model equilibria in a less stylized and more realistic model of the business cycle. If model equilibria can replicate other comovements of the data, in particular, investment and consumption dynamics, this would certainly increase confidence in the empirical relevance of such equilibria. Second, it seems important to evaluate the plausibility of forecasting restrictions directly, that is, not only via the implied model predictions but also through the use of inflation survey data or experimental evidence. The results in Ádam (2004) show that the inflation expectations reported by subjects participating in an experimental version of the presented economy are described surprisingly well by the expectations implied by the Model Π equilibrium.
APPENDIX
A.1. VECTOR AUTOREGRESSION
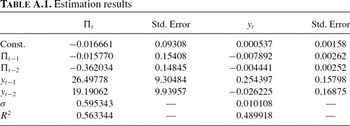
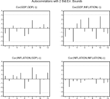
A VAR with two lags and a constant was estimated by OLS regression for yearly output and inflation data. The data consisted of the yearly averages of the bandpass-filtered quarterly inflation and output data depicted in Figure 1. The estimation results are given in Table A.1. Figure A.1 depicts the autocorrelation of the regression residuals.


VAR: Autocorrelation of residuals.
A.2. CALCULATION OF THE RATIONAL EXPECTATIONS EQUILIBRIA
Consider a stochastic linear expectational difference equation of the form

with zt, ut, k∈Rn, B0, B1, D∈Rn×n, and B1≠0, D≠0. The minimum state variable solutions of (A.1) take the form

provided there exists a real solution to the matrix quadratic equation

see Evans and Honkapohja (2001, Chap. 10.2). Then, a is given by

The AR solutions can be calculated by solving the matrix equations (A.2) and (A.3) for a and B. Because of to the sparsity of the matrices B0, B1, and D in the present model [see equation (6)], this is straightforward and delivers the solutions (8) and (9).
A.3. EXPECTATIONAL STABILITY OF RATIONAL EXPECTATIONS EQUILIBRIA
This section determines the E-stability properties of the rational expectations equilibria (8) and (9); see Evans and Honkapohja (2001) for a discussion of this concept. When agents use Model Y to forecast,


Note that (A.5) would require a forecast of future output. Using equation (3), however, one can express the output forecast in terms of an inflation forecast. In particular, linearizing (3) around the deterministic steady state from Section 4 delivers

which implies that

and leads to

Using (A.4) and (A.6) to substitute out the expectations in (6), one obtains

where

The differential equation determining E-stability is given by

E-stability (E-instability) holds if (A.7) is locally stable (unstable) at the rational expectations equilibrium, which depends on whether the real parts of the eigenvalues of

are smaller (larger) than one at the REE.
For the stationary rational expectations solution (8) the eigenvalues of (A.8) are given by λ1=1−1/ε and λ2=−1/ε and for the nonstationary solution (9) by λ1=2 and λ2=2 + 1/ε. This proves that the stationary rational expectations solution is E-stable and that the non-stationary rational expectations solution is E-unstable.
A.4. CALCULATING βΠ*
This section determines β*Π which is a function of the covariances of (14). Since the covariances are independent of the constant appearing in (14), one can ignore it and write this equation as

where zt=(Πt, yt)′ and ut=(0, τt)′. Define also Ω=Var(ut), Σ=Var(zt), Γ=Cov(zt, zt−1), and B=(bi,j).
Taking variances on both sides of (A.9) yields

which implies that

Multiplying (A.9) by zt−1 and taking expectations, one obtains the covariance with lagged variables:

Using equations (A.10) and (A.11) and remembering that

where σ2τ is the variance of the money shock, the matrices Σ and Γ are easily calculated. Using the expression for the variance of Πt from Σ and the expression for the covariance of Πt and Πt−1 from Γ, one obtains

The unique real solution to this equation is given by

where

A.5. EXPECTATIONAL STABILITY OF MODEL Π Equilibrium
This section shows that the RPE associated with Model Π equilibrium is expectationally stable (E-stable); see Evans and Honkapohja (2001) for a discussion of this concept. The RPE is said to be E-stable if the following differential equation is stable at the RPE values of α and β

where Ta(α, β) and Tb(α, β) denote the least-squares estimates for the constant and lagged inflation, respectively, when agents use Model Π with parameters α and β to forecast. Clearly, the differential equation (A.14) is stable if the real parts of the eigenvalues of

are smaller than 1. Although equation (A.12) implies that

Ta(α, β) still has to be determined. As noted in Section 6.2.2 the RPE in Model Π is stationary for 0.35<ε<2.15. Therefore, the least-squares estimate for the constant is given by

where E[Π] denotes the unconditional mean of Πt in the RPE.34
This follows from the unbiasedness of least-squares estimation.

into equation (6) and take unconditional expectations on both sides. Solving for E[Π] delivers E[Π]=1, which together with (A.17) implies

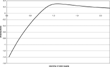
Equations (A.16) and (A.18) imply that the eigenvalues of (A.15) at the RPE are given by zero and [∂Tb(a, β)]/∂β, where the latter must be evaluated at the RPE values. E-stability of the RPE thus depends on whether [∂Tb(a, β)]/∂β<1 at the RPE. Figure A.2 graphs [∂Tb(a, β)]/∂β over the relevant range of labor supply elasticities and shows that the RPE in Model Π is indeed E-stable.

∂Tb(α, β)/∂(β) as a function of ε.
I received helpful comments from Giuseppe Bertola, Matthias Brückner, Benjamin Friedman, Tullio Jappelli, Jordi Galí, Soeren Johansen, Albert Marcet, Ramon Marimon, Athanasios Orphanides, Philippe Weil, two anonymous referees, and seminar participants at Bocconi University, Harvard University, European Central Bank, European University Institute, Federal Reserve Board, MIT, Pompeu Fabra University, and Free University of Brussels. All errors are mine.
References
Adam K.
2003
Learning and equilibrium selection in a monetary overlapping generations model with sticky prices.
Review of Economic Studies
70,
887–
908.Google Scholar
Adam K.
2004
Should Macroeconomists Consider Restricted Perceptions Equilibria?
Evidence from the Experimental Laboratory.
Mimeo, University of Frankfurt.
Anderson R.M. &
H. Sonnenschein
1985
Rational expectations equilibrium with econometric models.
Review of Economic Studies
52,
359–
369.Google Scholar
Arifovic J. &
J. Bullard
2001
Learning in macroeconomic models.
Macroeconomic Dynamics
5,
143–
147.Google Scholar
Ball L.
2000
Near-Rationality and Inflation in Two Monetary Regimes.
NBER Working paper 7988.
Bossaerts P.
2002
The Paradox of Asset Pricing.
Princeton, NJ:
Princeton University Press.
Branch W.A.
2003
The Theory of Rationally Heterogeneous Expectations: Evidence from Survey Data on Inflation Expectations.
Mimeo, College of William and Mary.
Brock W.A. &
C.H. Hommes
1997
A rational route to randomness.
Econometrica
65,
1059–
1095.Google Scholar
Bullard J. &
S. Eusepi
2003
Did the Great Inflation Occur Despite Policymaker Commitment to a Taylor Rule?
Federal Reserve Bank of St. Louis working paper 2003–013.
Bullard J.B. &
K. Mitra
2002
Learning about monetary policy rules.
Journal of Monetary Economics
49,
1105–
1129.Google Scholar
Cagan P.
1956
The monetary dynamics of hyper-inflation.
In Milton Friedman (ed.),
Studies in the Quantity Theory of Money,
pp. 25–117.
Chicago:
University of Chicago Press.
Carroll C.D.
2003
Macroeconomic expectations of hounseholds and professional forecasters.
Quarterly Journal of Economics
118,
269–
298.Google Scholar
Chari V.V.,
P.J. Kehoe &
E.R. McGrattan
2000
Sticky price models of the business cycle: Can the contract multiplier solve the persistence problem?
Econometrica
68,
1151–
1179.Google Scholar
Christiano L.J.,
M. Eichenbaum &
C. Evans
1999
Monetary policy shocks: What have we learned and to what end?
In J.B. Taylor &
M. Woodford (eds.),
Handbook of Macroeconomics.
pp. 65–148.
Amsterdam:
Elsevier.
Christiano L.J.,
M. Eichenbaum &
C. Evans
2001
Nominal Rigidities and the Dynamic Effects of a Shock to Monetary Policy.
National Bureau of Economic Research Working Paper No. 8403.
Christiano L.J.,
M. Eichenbaum &
C. Evans
1997
Sticky price and limited participation models of money: A comparison.
European Economic Review
41,
1201–
1249.Google Scholar
Dixit A.K. &
J.E. Stiglitz
1977
Monopolistic competition and optimum product diversity.
American Economic Review
67,
297–
308.Google Scholar
Evans G.W. &
S. Honkapohja
1993
Adaptive forecasts, hysteresis, and endogenous fluctuations.
Economic Review of the Federal Reserve Bank of San Francisco
1,
3–
13.Google Scholar
Evans G.W. &
S. Honkapohja
2001
Learning and Expectations in Macroeconomics.
Princeton, N.J.:
Princeton University Press.
Evans G.W. &
S. Honkapohja
2003
Expectations and the stability problem for optimal monetary policies.
Review of Economic Studies
70,
807–
824.Google Scholar
Evans G. &
G. Ramey
1992
Expectation calculation and macoeconomic dynamics.
American Economic Review
82,
207–
224.Google Scholar
Fuhrer J. &
G. Moore
1995
Inflation persistence.
Quarterly Journal of Economics
110,
127–
159.Google Scholar
Galí J. &
M. Gertler
1999
Inflation dynamics: A structural econometric analysis.
Journal of Monetary Economics
44,
195–
222.Google Scholar
Hommes C.H. &
G. Sorger
1997
Consistent expectations equilibria.
Macroeconomic Dynamics
2,
287–
321.Google Scholar
Kasa K.
2004
Learning, large deviations, and recurrent currency crisis.
International Economic Review
45,
141–
173.Google Scholar
Marcet A. &
J. Pablo Nicolini
2003
Recurrent hyperinflations and learning.
American Economic Review
93,
1476–
1498.Google Scholar
Marcet A. &
T.J. Sargent
1989
Convergence of least squares learning in environments with hidden state variables and private information.
Journal of Political Economy
97,
1306–
1322.Google Scholar
Nelson E.
1998
Sluggish inflation and optimization models of the business cycle.
Journal of Monetary Economics
42,
303–
322.Google Scholar
Packalen M.
2000
On the Learnability of Rational Expectations Equilibria in Three Business Cycle Models.
Research report 87,
University of Helsinki.
Sargent T.J.
1991
Equilibrium with signal extraction from endogenous variables.
Journal of Economic Dynamics and Control
15,
245–
273.Google Scholar
Sargent T.J.
1999
The Conquest of American Inflation.
Princeton, NJ:
Princeton University Press.
Sethi R. &
R. Franke
1995
Behavioural heterogeneity under evolutionary pressure: Macroeconomic implications of costly optimisation.
Economic Journal
105,
583–
600.Google Scholar
Stock J. &
M. Watson
1999
Business cycle fluctuations in US macroeconomic time series.
In J.B. Taylor &
M. Woodford (eds.),
Handbook of Macroeconomics,
pp. 3–64.
Amsterdam:
Elsevier.
Taylor J.B.
1999
Staggered price and wage setting in macroeconomics.
In J.B. Taylor and
M. Woodford (eds.),
Handbook of Macroeconomics,
pp. 1009–1050.
Amsterdam:
Elsevier.
Timmermann A.
1993
How learning in financial markets generates excess volatility and predictability in stock prices.
Quarterly Journal of Economics
108,
1135–
1145.Google Scholar
Detrended U.S. data.
Auto- and cross correlations of U.S. output and inflation.
Impulse responses to a demand shock with 2 standard error Monte Carlo error bands.
β*Π as a function of ε.
Mean-squared forecast error, Model Y $(\smash{\raise0.6pt\hbox{–}}\ddiam\smash{\raise0.6pt\hbox{–}})$ vs. Model Π $(\smash{\raise0.6pt\hbox{–}}\drect\smash{\raise0.6pt\hbox{–}})$.
Auto- and cross correlations in Model Πequilibrium.
Impulse responses to a demand shock in Model Π equilibrium.
Correlation between output (t) and wage (t + i).
Autocorrelation of forecast errors in Model Π equilibrium.}
Estimation results
VAR: Autocorrelation of residuals.
∂Tb(α, β)/∂(β) as a function of ε.
 You have
Access
- 40
- Cited by