


Introduction
Understanding voter preferences about the vertical distribution of power in multilayered political systems is a key topic for political science and related disciplines, but little attention has been paid to the deep-rooted factors shaping these preferences.Footnote 1 Consider that we observe a backlash against globalization and supranational integration in many countries, but certain regions within those countries resist the trend. Scotland is a region that experienced tensions with the central United Kingdom (UK) government throughout history. A plausible and widespread assumption is that such regions and groups support exit strategies: decentralization, more autonomy, or even outright secession. However, while there was a positive trend in the vote share of the secessionist Scottish National Party, Scottish public support for European integration also increased by 25% from 1979 to 1997.Footnote 2 The region also clearly favored integration in the Brexit referendum, even though integration also means a centralization of power.
This might seem paradoxical at first, but I sketch a theoretical framework of exit and integration that can explain such preferences. It explains under what conditions negative historical experiences with higher-level governments cause individuals in minority regions to support integration—that is, to a supranational level or international organization (IO)—as a means to prevent history from repeating itself. After WW1 highlighted the risk of conflict between nation-states and created new national minorities, this idea of integration emerged and culminated in the foundation of the League of Nations. I explain that integration is a relevant alternative or complementary strategy when exit strategies are costly, integration is perceived as helping minority regions, and the salience of historical tensions and the role of integration as a remedy is high enough.
I apply this framework to the European Union (EU), which can be considered as one of the most advanced international/intergovernmental organizations, as well as an ambitious attempt to develop a multilevel system through supranational integration. One reason to choose Europe is that “both nationalism and state formation, in their modern, territorial sense, originated in Europe” (Cederman Reference Cederman1997, 8). Conflicts between nation-states were prevalent for centuries, and France and Prussia were the first states to implement systematic nation-building policies to assimilate minority groups, by force if necessary. European integration was always linked to peace and the idea of constraining powerful nation-state members, and this aspect became particularly salient for minority groups and regions since the 1990s.
Empirically, prior studies document a correlation between being a minority region and support for EU integration (e.g., Jolly Reference Jolly2015), but causally attributing this to specific historical experiences, like negative exposure to the higher-level nation-states, is inherently difficult. Causal analysis requires a coherent way to assess negative exposure, a suitable treatment and control group, exogenous historical differences in negative exposure, and the possibility of observing treatment and control units in the same institutional environment today. This is very hard to achieve in a large cross-sectional panel.
Examining specific cases solves some of the difficulties, but establishing causality remains challenging. For instance, the southern part of the Austrian region Tyrol was occupied during WW1 and exposed to repressive nation-state policies by Italy afterwards. Today, this Italian part is described as a region strongly supporting EU integration.Footnote 3 However, as the counterfactual northern part remained in Austria, we cannot distinguish historical exposure from current political differences. In Spain, Catalonia was clearly exposed to nation-state repression during the Franco era, and the electorate and regional parties today are supporters of EU integration. However, the empirical challenge is that Catalonia differs from other potential counter-factual Spanish regions in many other aspects like current political tensions as well as all its unique history ranging back for centuries.
To solve this empirical challenge, I provide evidence from the initially homogeneous French-German border regions Alsace and Lorraine, which were split in a quasi-random way after the Franco-Prussian War in 1871. As I will explain in more detail, the eastern “treated” part clearly had more negative experiences with nation-state actions over the next about 80 years. Both parts belong to the same French administrative region today, so I can disentangle the effect of the historical treatment from contemporary differences. Using a municipal-level spatial regression discontinuity design (RD) at the former border, I find that more negative exposure to nation-state actions caused higher support in three referenda about European integration and less Euroscepticism in European parliamentary elections.
These results are robust to different implementations of the RD estimation and various robustness and placebo tests. Regarding mechanisms, I find no discontinuities in population changes, socioeconomic differences, or public good provision, which could have been caused by the natural experiment and affect the outcome. Instead, I find that EU support is associated with a stronger European identity—in line with Hooghe, Lenz, and Marks (Reference Hooghe, Lenz and Marks2019)—which is not related to higher perceived monetary benefits of EU membership. Finally, I present survey evidence showing that exit and integration—regionalization or delegation to the European level—are indeed complementary alternatives for respondents in the treated area.
One contribution of my paper is to outline a theoretical framework of how past experiences with higher-level governments shape individual preferences about the vertical distribution of power. This complements existing important contributions about nation-building and the relationship between nation-state conflicts and nation-building policies (e.g., Anderson Reference Anderson2006; Gellner and Breuilly Reference Gellner and Breuilly2008; Hobsbawm Reference Hobsbawm1990; Tilly Reference Tilly1995). Mylonas (Reference Mylonas2013) began to link nation-building and international relations by showing how external powers associated with domestic minority groups influence policies towards these groups. Similarly, my paper connects two lines of research that have so far been largely analyzed in isolation: the long-term effects of historical events on political preferences and outcomes and support for supranational integration and international organizations. My causal evidence thus augments other studies about long term persistence (Acharya, Blackwell, and Sen Reference Acharya, Blackwell and Sen2016; Becker et al. Reference Becker, Boeckh, Hainz and Woessmann2015; Mazumder Reference Mazumder2018a; Nisbett Reference Nisbett2018) by documenting persistent effects of differences in historical exposure on preferences regarding the vertical distribution of power.
I study negative experiences of a “group” in a case where the group is a minority compared to the nation as a whole but a majority within their home region. In contrast, most existing papers consider the effect of nation-state repression on minority immigrant groups within a foreign host country (Fouka Reference Fouka2019; Reference Fouka2020; Komisarchik, Sen, and Velez Reference Komisarchik, Sen and Velez2019). Such repressive policies against minorities can backfire, as argued by Cederman (Reference Cederman1997). Empirically, Dehdari and Gehring (Reference Dehdari and Gehring2018) show the effect of repression on the formation of a stronger regional identity, and Rozenas and Zhukov (Reference Rozenas and Zhukov2019) provide a more nuanced argument when repression in an occupied area raises opposition towards the foreign occupier. My paper extends those analyses by highlighting how such negative experiences with higher-level governments can also foster support for delegating political power upwards through integration.
This allows a better understanding of preferences about the vertical distribution of power, which is crucial for the study of federalism (e.g., Dreher et al. Reference Dreher, Gehring, Kotsogiannis and Marchesi2017; Rodden Reference Rodden2004; Reference Rodden2006). Understanding how the interests of different levels of government can strategically influence preferences about (de)centralization has been a core question dating back to The Federalist Papers (Hamilton, Madison, and Jay Reference Hamilton, Madison and Jay1787). It also relates to political economic theories about the optimal size of nations (Alesina and Spolaore Reference Alesina and Spolaore1997), but those focus more on economic arguments. I highlight that decentralization and upward integration can be complementary strategies for voters in lower-level entities that are concerned about political decisions of higher-level governments. This also connects my study to the literature on secessionist conflict, which has largely focused on exit strategies (e.g., Cederman et al. Reference Cederman, Hug, Schädel and Wucherpfennig2015) as the most plausible reaction to tensions with the central state.
Finally, by considering attitudes towards shifting decision-making to the international level, I relate to the international relations literature on regional integration (Schneider Reference Schneider2017), the political economy of international organizations in general (reviewed in Dreher and Lang Reference Dreher, Lang, Grofman, Congleton and Voigt2019) and the EU in particular (Gehring and Schneider Reference Gehring and Schneider2018), and the impact of IO conditionality (e.g., Carnegie Reference Carnegie2014; Dreher Reference Dreher2004; Gehring and Lang Reference Gehring and Lang2020). My results complement the existing literature examining EU support (e.g., Gehring Reference Gehring2020; Hooghe and Marks Reference Hooghe and Marks2004; Marks and Steenbergen Reference Marks and Steenbergen2004; Sánchez-Cuenca Reference Sánchez-Cuenca2000) and Euroscepticism (e.g., De Vries Reference De Vries2018). To a large extent, the EU support literature is focused on correlational evidence regarding individual-level attributes or current domestic aspects as explanatory factors. Hooghe and Marks (Reference Hooghe and Marks2004; Reference Hooghe and Marks2005) highlight the role of identity as a potential source of support for the EU, but they take identities as given and cannot exploit exogenous variation in their strength. My paper is, to the best of my knowledge, the first to provide causal evidence on deep-rooted structural reasons for existing differences in EU support and suggests identity as one key channel.
Theory and Application to EU and Alsace-Lorraine
Historical Experiences and the Exit versus Integration Decision
How are individual preferences and voting decisions about the vertical allocation of power influenced by negative historical experiences with nation-state governments? I begin by outlining some more universal aspects of how history relates to exit and integration options. Then, I apply the framework to a specific geographic area and type of integration—the European Union (EU)—and discuss the desirability of exit and integration options for individuals in this context. Finally I zoom in on a particular case that allows isolating the causal effect of historical negative experiences with nation-states on preferences about EU integration.
I am focusing on individuals in minority regions—referring to an ethnic, linguistic, or otherwise distinct group. The aggregated votes of those individuals can affect governments and parties, but in this paper I am not trying to explain the behavior of those actors. For the sake of emphasizing the main argument, this assumes that higher-level policies are exogenously given or imposed top-down, which is not implausible given that minorities usually cannot control central governments. Regional parties can help to maintain or shape historical memories, but my interest here is in historical experiences as a root cause of current individual preferences.Footnote 4
Individuals vote on how much decision-making power to allocate at different levels in a multilevel governance structure—for example, at the regional level, the nation-state level, and a higher international level. Voters are rational to the extent that they base their vote on a comparison of the costs and benefits of these alternatives. Instrumental aspects like economic concerns or the quality of and alignment with different governance levels matter, but culture does as well. Culture matters as our identities influence “how we are to calculate our interests” (Brubaker Reference Brubaker and Hall1998, 292). The stronger an identity at a particular level, the more positive the cost-benefit considerations about decision-making at that level.
The main examples of negative experiences with nation-states are conflicts between nation-states and repressive nation-building policies in those regions. Rokkan (Reference Rokkan1999), for instance, describes center-periphery cleavages as stemming from nation-building policies that tried to homogenize minorities by force. Negative experiences also occur if a region experiences broken nation-building processes (see, e.g., Anderson Reference Anderson2006; Rokkan Reference Rokkan1969). Broken nation-building policies are often related to war between nation-states, for instance when an area is annexed by the winner of a war and then integrated by force into the new-nation state. However, negative experiences are broader than intrusive nation-building policies, as exposure to war between nation-states itself—even without specific homogenization policies—can also affect preferences permanently.
These negative historical experiences with the nation-state could enter into individuals’ decisions about the vertical allocation of power in different ways. For instance, they can increase the perceived likelihood of future negative nation-state actions or the perceived costs associated with them. Moreover, they can shape group identities (see Tilly Reference Tilly1995), strengthening regional and possibly higher-level identities relative to national identity. Regarding the optimal net decision of an individual, each decision-making level also has specific other costs and benefits. Hence, the optimal decision does not have to be allocating all power to one level and is conditional on those other dimensions. The important feature I want to highlight is that, all else being equal, negative experiences make the allocation of decision-making power at the nation-state level relatively less attractive for individuals in affected minority regions.
This can foster support for exit strategies—delegating power downwards through more autonomy—but also support for integration—delegating political power further upwards.Footnote 5 Exit strategies have been the focus of most scholars working on areas with existing tensions between regions and central states (e.g., Cederman and Girardin Reference Cederman and Girardin2007; Morelli and Rohner Reference Morelli and Rohner2015). In contrast, I outline three criteria that determine whether history also increases support for upward integration as an alternative or complementary strategy to exit. Those are the costs and political feasibility of exit strategies, the benefits of supranational integration or IOs in overcoming history, and the salience of historical experiences.
The first criterion regarding the vertical allocation of power is the feasibility and costs of exit strategies. Outright secession is risky and has a very low likelihood of success against more powerful higher-level governments. Even political decentralization and more autonomy are often hard to achieve due to commitment problems and might not be sufficient to satisfy demands for exit (Cederman et al. Reference Cederman, Hug, Schädel and Wucherpfennig2015). Moreover, remaining part of a larger state ensures economic benefits like a more efficient provision of public goods and better trade opportunities (Alesina and Spolaore Reference Alesina and Spolaore1997). The extent of those costs depends on current national political institutions and policies, but the relevant insight is that exit options are always also associated with costs.
For integration to be considered a relevant alternative or complementary strategy for individuals in minority regions, a second criterion is the ability of integration to overcome history. Integration can create mutual benefits by enabling cooperation, which minority members take into account as well. But in addition, depending on their historical experiences, I argue that they value the supranational level’s or IO’s ability to limit the likelihood of future nation-state conflict or discriminatory actions against minorities relatively more (cf. Hooghe, Lenz, and Marks Reference Hooghe, Lenz and Marks2019).
Integration can be regarded as a means for rational actors—here nation-state governments—to engage in a governance contract that creates benefits, but it also imposes constraints on specific choices they would otherwise make. International organizations can constrain the choice set of their member-states by setting conditions for access, setting conditions for specific programs (e.g., Birchler, Limpach, and Michaelowa Reference Birchler, Limpach and Michaelowa2016; Dreher Reference Dreher2009), and enforcing rules among their members.Footnote 6 To ensure that integration promotes peace, scholars emphasize democratic rules (Pevehouse and Russett Reference Pevehouse and Russett2006) and the existence of sophisticated institutional structures (Boehmer, Gartzke, and Nordstrom Reference Boehmer, Gartzke and Nordstrom2004), including centralized courts and efficient enforcement mechanisms.
A third criterion is that the salience of both historical negative experiences with higher-level governments and the role of integration as a potential remedy must be sufficiently high. It seems plausible that the more frequent, the more negative, and the longer lasting those negative experiences were, the more likely that they remain salient today and have the potential to influence behavior. Individual knowledge or investment is not necessarily required. It can be sufficient if organizations like regional associations, parties, or the media either invest in keeping these memories alive and communicating them and potential remedies to voters, “reactivating” historical experiences (see, e.g., Fouka and Voth Reference Fouka and Voth2016; Ochsner and Roesel Reference Ochsner and Roesel2017).
The idea that supranational integration can prevent conflict and protect minority groups emerged in the nineteenth century and culminated in the foundation of the League of Nations after WW1. The League frequently discussed minority problems, and its World Court ruled repeatedly in defense of national minorities. However, it lacked the means to enforce those rulings (Zahra Reference Zahra2008). Similarly, after WW2, the United Nations (UN) as its successor ratified an “International Covenant” to protect national minorities against nation-states, but it also struggles to enforce these rulings. Accordingly, a decisive feature to make integration a desirable aim for regions with negative historical experiences is the ability not only to detect and judge potential misbehavior but also to enforce decisions to maintain peace and stop discrimination.
There are various attempts to use integration and IOs to facilitate peace and fight discrimination against minority groups today. The African Union has engaged and taken up mandates to prevent wars and act against mistreatment of minorities, albeit with limited success. Mylonas (Reference Mylonas2013) argues that ASEAN had some influence on reducing exclusionary policies and making accommodation a more likely strategy in South-East Asia. The OSCE and the Council of Europe supposedly have been “a significant driving force” to achieve better treatment of minorities in post-Soviet countries (see also Mylonas Reference Mylonas2013, 185). In federal systems, minority protection is usually assigned to higher-level governments or defined as a constitutional right that can be enforced by central courts. Hence, the concept of using integration to overcome historical problems seems widely relevant.Footnote 7
Application to the European Union
To demonstrate the empirical relevance of my framework, I apply it to the case of regions and nation-states that are members of the European Union (EU). The EU is an IO, but it is also the most ambitious recent attempt to establish a multilevel governance system through supranational integration. As Cederman (Reference Cederman1997) describes, Europe is the origin of modern nationalism. Nationalism in Europe is inseparably associated with aggressive nation-building policies against minority regions as well as reoccurring conflicts between nation-states that are affected in particular border regions. There thus exist many tensions between regions and nation-states that are grounded in history, and the memory of conflicts between nation-states in a competition for power and space is still vivid. The next paragraphs apply my framework to the EU case and examine to what degree the three criteria are satisfied.
First, what about the feasibility and costs of exit options? Decentralization is clearly not impossible in the EU, and there has been some successful devolution of power within member states, like the establishment of regional parliaments in the UK. Overall, however, a region’s political power compared with that of national governments is limited. Many attempts to decentralize or attain more autonomy have failed, most recently visible in the failed Catalan attempts to achieve independence from Spain. The widespread existence of separatist parties underscores undersatisfied demands for exit strategies. At the same time, the economic costs of exit options are highlighted by the dependence of separatist party success on perceived economic benefits (Gehring and Schneider Reference Gehring and Schneider2020). Hence, alternative or complementary strategies to exit are desirable for individuals in minority regions.
Regarding the second criterion, credibility, the EU has certainly strengthened regions against the nation-states, in particular those representing a linguistic or ethnic minority. Certain EU institutions, in particular the Committee of the Regions, allow regions to bypass national governments (Jolly Reference Jolly2007) and ensure “the protection of regional cultures” (Panara Reference Panara2019, 13). The Treaty of the EU (TEU) article 4(2) specifies respect for “regional and local self-government,” and the EU’s Copenhagen Criteria from 1993 demand “respect for and protection of minorities.”
The EU is also seen as having “the leverage to enforce commitments … for the protection of national minorities” (Galbreath and McEvoy Reference Galbreath and McEvoy2012, 279). The European Court of Justice plays a key role in that regard. Garrett (Reference Garrett1995, 171) explains that, “the court exercises judicial review … over the behavior of governments.” For instance, the court ruled to protect the fiscal autonomy of regions in the landmark “Portugal vs. Commission” case. In the “Izsák-Dabas vs. Commission” case, the court decided against the nation-states that an initiative aimed at improving the situation of national minority regions had to be allowed. European Union institutions cannot fully control member states, but it is sufficient that they are perceived as lowering the relative likelihood of nation-state conflicts and repressive policies against minority regions.
Regarding the third aspect, salience, peace and respect for cultural diversity have been crucial aspects since the early days of European cooperation. Take Robert Schuman, one of the EU’s founding fathers. He himself experienced repression while living in the Lorrainian city of Metz, and as a parliamentarian for an Alsace-Lorrainian party he advocated for more autonomy from the central state—an exit option. However, later he began to recognize “international cooperation as a way to maintain peace” (Zanoun Reference Zanoun2009, 268). In a famous 1949 speech in Strasbourg, Schuman—then French foreign minister—called all European countries to “attempt and succeed in reconciling nations in a supranational association. This would safeguard the diversities and aspirations of each nation.” These principles were formalized in the “Schuman Declaration” in 1950 and became the basis of the European Coal and Steel Community, the predecessor of the EU. Jean Monnet, another founding father, described EU integration as a process to “go beyond the concept of a nation,” and Konrad Adenauer, first German chancellor after WW2, called it an “antidote to nationalism.”
Actors representing regions ensure this aspect remains salient. Generally, regional governments and regional parties perceive the EU “as an ally against the central state” (Jolly Reference Jolly2007, 110). The Council of European Municipalities and Regions recognizes the EU’s contribution to “respect for regional and local self-government as part of national identities.” The Federal Union of European Nationalities, an interest group representing minority regions, publicly praises the importance of the EU in protecting and promoting minority regions. Its “Minority SafePack” initiative to protect minority languages and cultures was widely featured in the media and, among others, supported by South Tyrol and the Basque country.Footnote 8
Looking at data reveals a positive correlation between EU support and being in a border region (Gabel and Palmer Reference Gabel and Palmer1995) and with perceiving one’s region in a struggle with the central nation-state (Jolly Reference Jolly2015). Prior studies also find a relationship between a region having a problematic history with nation-states and higher EU support (Jolly Reference Jolly2007)—all in line with my argumentation but without being able to claim causality. Individuals’ decisions about their preferred level of vertical power allocation are influenced by a large number of other factors. This makes it hard to establish convincing counterfactuals for a large number of cases in different regions and nation-states with distinct histories and move beyond showing correlations. Instead of trying to provide a better estimate of this correlation in a large multiregion sample, I focus on the French-German border region Alsace and Lorraine as a specific historical natural experiment.
The Division of Alsace and Lorraine as a Natural Experiment
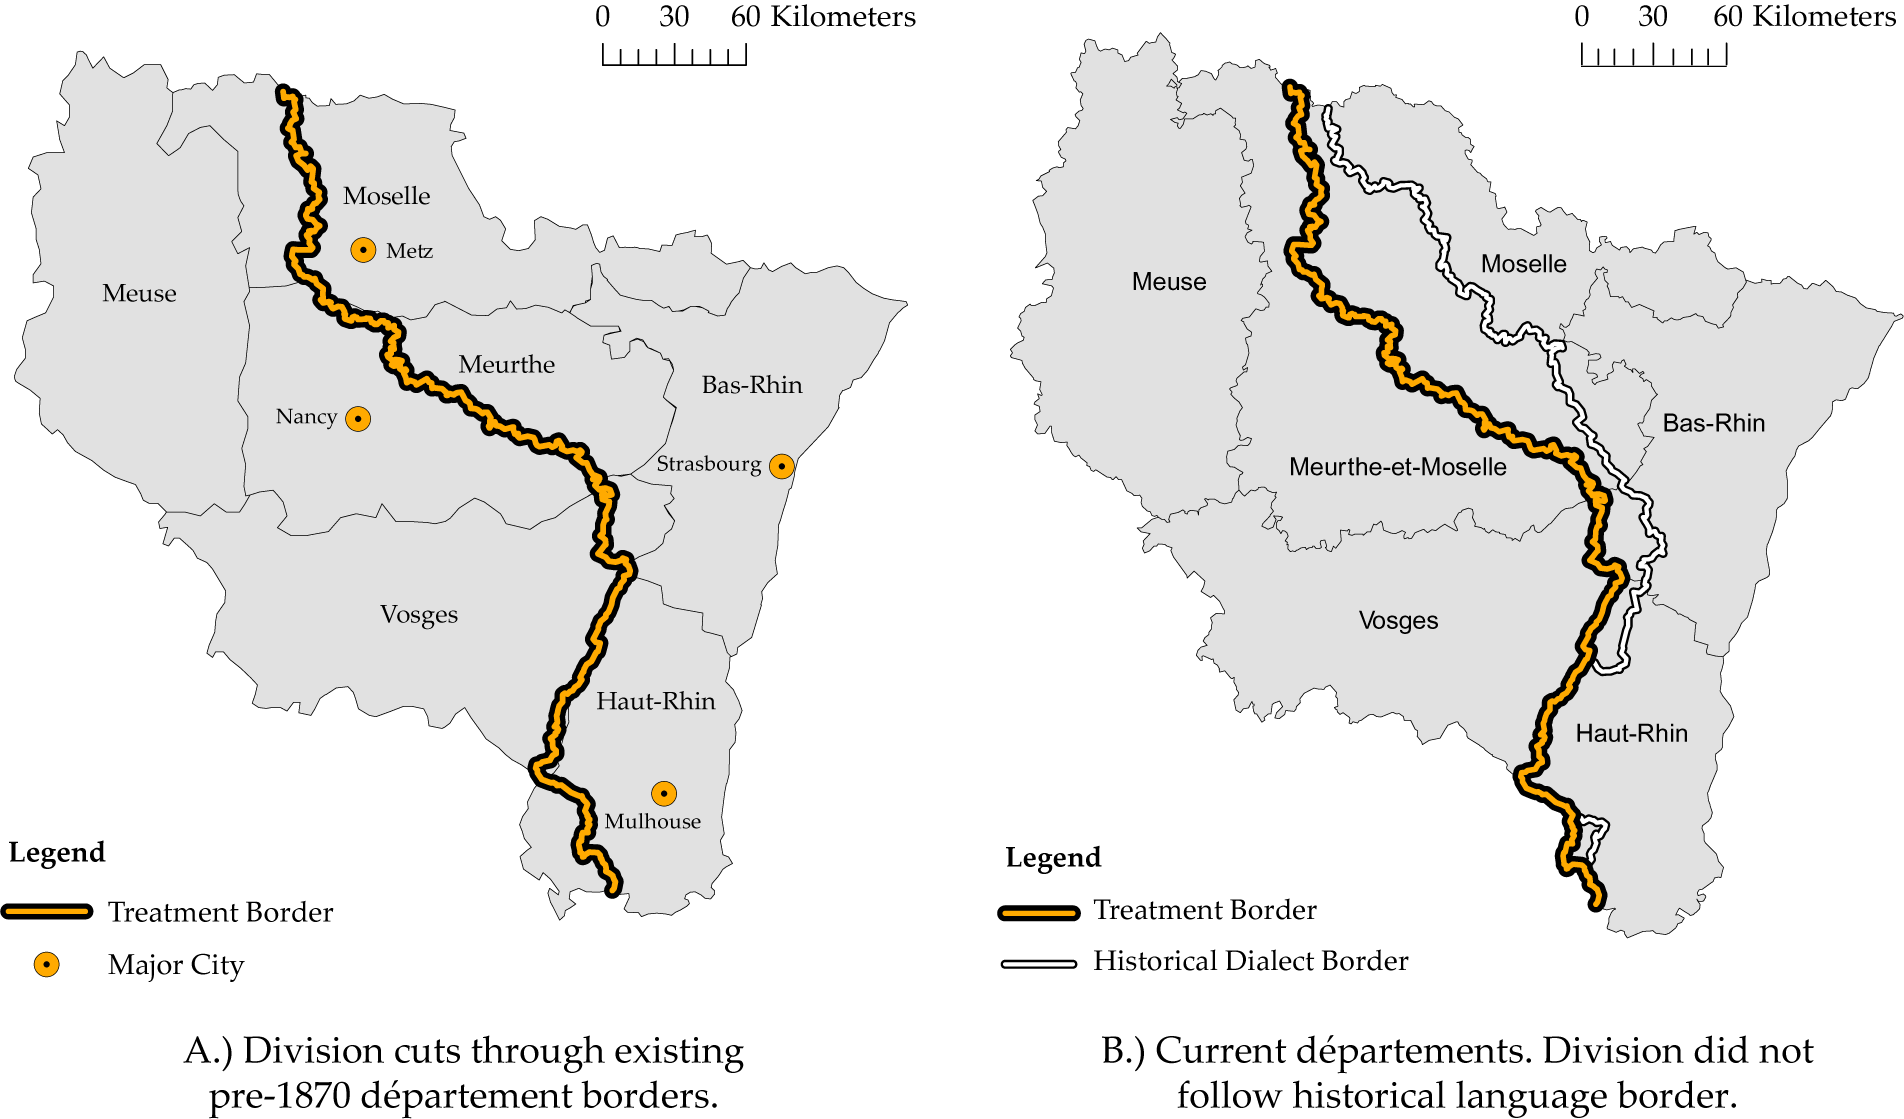
Figure 2 illustrates the relevant history of Alsace and Lorraine in a simplified way. Regarding the existence of a suitable counterfactual, it is most relevant that the whole region had been French for more than a century before it was divided. Both Alsace and Lorraine became autonomous political entities as far back as the seventh century, were united in the Duchy of Lotharingia, and became fully integrated into France in 1767. This means that, starting with Napoleon, the whole region experienced the same French nation-building policies. There are no reasons to expect systematic differences in attitudes towards the nation-state or the region. The left-hand side of Figure 1 shows a map of the region prior to 1870, with the six pre-1870 départements, and the four major cities in the region.
Alsace and Lorraine: Départements Before and After Division in 1870/71
Note: Author’s depictions using ArcGIS and official administrative shapefiles. Linguistic border georeferenced from Harp (Reference Harp1998).

The division that I exploit for causal identification originates from the Peace Treaty that ended the Franco-Prussian War (July 19, 1870 to May 10, 1871). Otto von Bismarck, chancellor of Prussia, did not aim for territorial gains with this war but wanted to unite all German states against their arch-enemy, France, and agree on founding a German nation-state (Wawro Reference Wawro2005). Still, the successful German army occupied parts of France including all of Alsace and Lorraine and then besieged Paris. The following peace negotiations with France were dominated by disagreement in the German leadership about its territorial expansion. The independent military leadership under the charismatic general Helmuth von Moltke (Förster Reference Förster1990) wanted to keep the whole region Alsace and Lorraine. Bismarck thought of this as a “major folly” and source of future wars. If anything, he wanted to restrict expansion to the eastern German-dialect speaking areas (Lipgens Reference Lipgens1964).
The negotiation process is described as dominated by pride and the clash between these two strong characters (Wawro Reference Wawro2005). For instance, Bismarck was willing to hand over Metz and the surrounding Lorrainian areas in the north (see map), but von Moltke refused, as he considered taking the city one of his major achievements. The final border was a compromise that was decided upon centrally in Versailles, which was drawn on a map largely ignoring local circumstances like existing identities, language or military-strategic considerations (Messerschmidt Reference Messerschmidt1975). Bismarck, “quite uncharacteristically wilted under the pressure” (Wawro Reference Wawro2005, 305) to annex larger parts—about half of the region. Figure 1B confirms that the resulting treatment border (i) does not follow the historical linguistic border between French- and German-dialect speakers, (ii) the existing pre-1870 département borders, (iii) nor any older historical border.Footnote 9 Hence, for causal identification I treat the border as as-good-as-random, an assumption I examine in more detail later.
Large parts, but not all of Alsace, were transformed into the German districts of Oberelsass and Unterelsass, which correspond to today’s French départements Haut-Rhin and Bas-Rhin. In the northern Lorraine area, Germany created the district Lothringen, cutting right through the prior Lorrainian départements. This corresponds to today’s département Moselle. In the remaining “control” area in the west, France created the départements Meurthe-et-Moselle, Meuse, and Vosges, all still existing today. The eastern “treated” area in the region is often referred to as Alsace-Lorraine. It remained German until WW1; afterwards, the “lost provinces” (Harvey Reference Harvey1999) were reintegrated into France and since then again belong to the same French region.
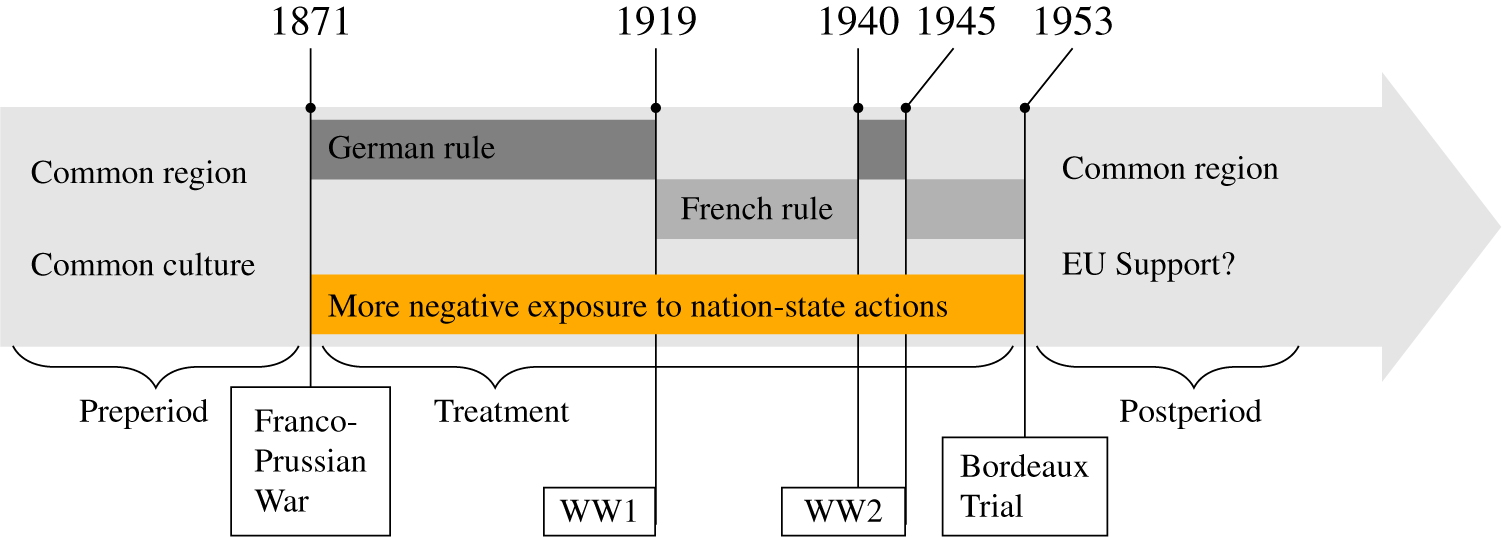
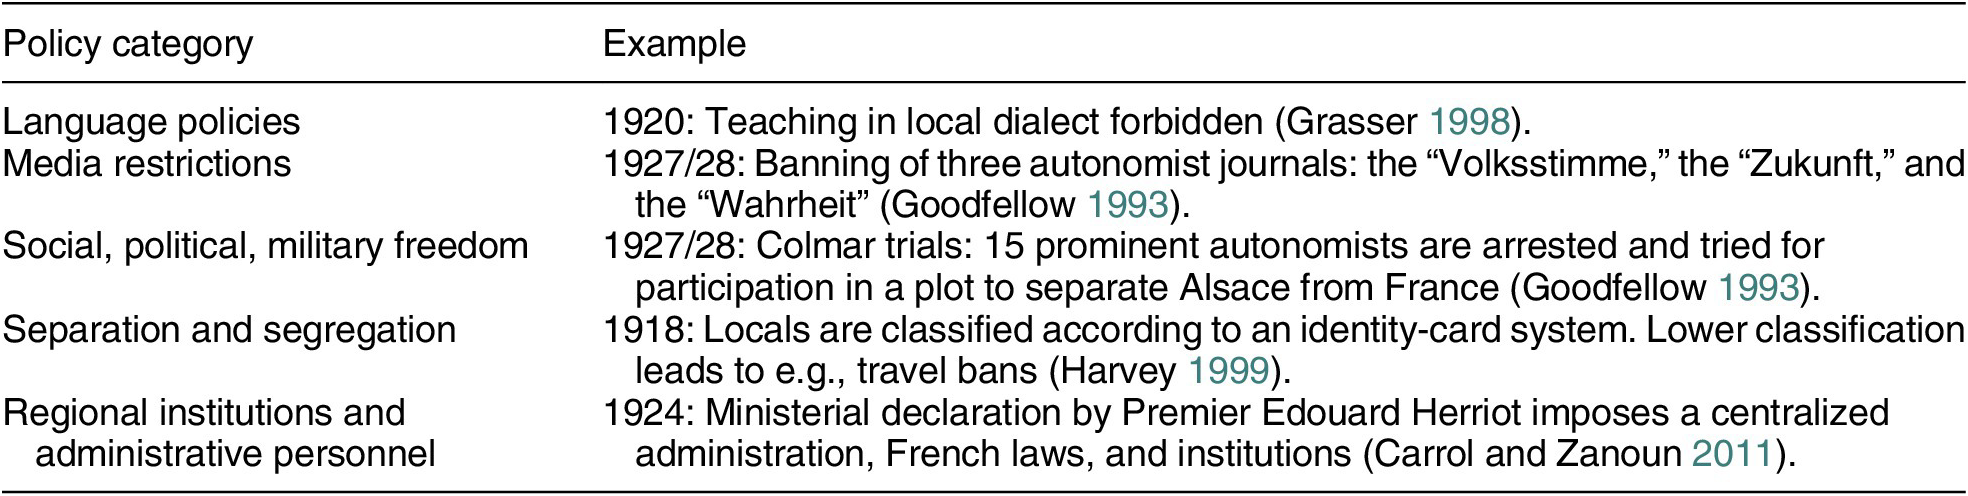
Figure 2 highlights how, after being initially comparable, the treated area clearly suffered more from the actions of nation-states for about 80 years from 1871 until the 1950s. This encompasses the consequences of war between nation-states—like occupation and having to change national affiliation—as well as repression by the states. As historians describe in great detail, the German period and the first decades back under French rule were accompanied by a wide range of discriminatory and repressive nation-state policies in the treated area (e.g., Callender Reference Callender1927; Carrol and Zanoun Reference Carrol and Zanoun2011). Table 1 provides examples of these policies in five categories, and Table B.1 gives a comprehensive list.Footnote 10
Simplified Timeline of Events in Alsace-Lorraine
Note: Author’s creation. The timeline provides a simplified version of the events in the French-German border regions Alsace and Lorraine. The Franco-Prussian War caused a split of the initially homogenous regions. Between 1870 and the 1950s, one part of the region was more negatively exposed to nation-state actions by France and Germany. Both parts were reintegrated in a common French region after WW2.

Overview of Policy Categories and Examples

Note: Sources and full list of policies in Table B.1.
Historians agree that the German nation-building policies backfired and did not create a German identity among regional citizens, but they instead fostered regional identity and skepticism against nation-states. Towards the end of the German period, observers report that “the anti-German sentiment of the population is today stronger than ever” (Carrol Reference Carrol2010, 60). Henri-Dominique Collin, a leader of the regional party Parti Lorrain Indépendant declared, “We assert ourselves as Lorrainers … and oppose Germany” (Carrol and Zanoun Reference Carrol and Zanoun2011, 470). Associating German dialect-speaking individuals with Germanophile sentiments is described as a “grossly inaccurate perception” (Zanoun Reference Zanoun2009, 71).
After initially welcoming the return to France after WW1, the repressive and discriminatory French policies further increased the skepticism towards nation-states. “Mosellans began to feel anxious at the central state’s assimilation process” and wanted to “end what they saw as France’s methodical spoliation of local customs and traditions” (Zanoun Reference Zanoun2009, 62). They became “resentful of the central powers” and developed a “strong resentment towards Germany and France” and towards “centralizing imperatives” (Carrol and Zanoun Reference Carrol and Zanoun2011, 474) in general. Speaking about the Commision de Triage, one of the repressive French institutions, the regional politician Eugene Ricklin declared that they, “accused me of being a bad Alsatian … [it] is the most shameful institution we have ever seen. Instead of making us love France, it did just the opposite” (Carrol and Zanoun Reference Carrol and Zanoun2011, 470).
The impression of being “a national minority suffering under the cultural domination of an imperialistic power” (Carrol and Zanoun Reference Carrol and Zanoun2011, 477) developed, as citizens in the treated area were constantly reminded “of their minority status within France” (Goodfellow Reference Goodfellow1993, 469). During repression, regionalist parties were established to act as “defenders of the region’s distinctive culture and traditions” (Carrol and Zanoun Reference Carrol and Zanoun2011, 477). The exposure to conflict led people in the treated area to “reassert their pacifism,” (Carrol Reference Carrol2010, 63) and the idea of “a free Alsace-Lorraine belonging to the United States of Europe, that bridges France and Germany” (Goodfellow Reference Goodfellow1993, 458) emerged.
During WW2, the whole region was occupied by Germany, but again the treated area reportedly suffered more from the war. This “further alienated Alsatians from pro-German movements and concomitantly with German cultural identity” (Goodfellow Reference Goodfellow1993, 469). Even under pressure, “no party, even among the autonomist groups, officially collaborated” (Anderson Reference Anderson1972, 23). A number of citizens from the treated area were forced to fight for the German army. After the war was over, these unfortunate soldiers—the so-called “malgré-nous”—were charged in the Bordeaux Trial for their “collaboration” with Germany. This caused massive protests against the French central state in the treated area, as the soldiers were perceived as being punished for something beyond their control. Finally, the French government realized the negative consequences of their approach. In 1953 it declared a far-reaching amnesty that settled this and other issues, marking the end of the treatment period. Since then, tensions began to calm down, and both parts were again subject to the same policies as part of the same French region.
Qualitative evidence shows that these memories are still alive today and suggests that public and private regional organizations like parties, media, and associations played an important role during the treatment period and still keep those memories alive today. Demonstrators against a recent territorial reform that was perceived as dictated by the central government were chanting, “No to an annexation,” and they complained about “history repeating itself, Paris violating our identity.” Museums like the Mémorial Alsace-Moselle display photographs and documents about the region’s difficult history. Regional TV productions like the series “Les Alsaciens ou les Deux Mathilde” highlight problems with the central state as part of a family drama.
Often, European integration plays an important role as a perceived remedy. The Mémorial Alsace-Moselle highlights the “story of European integration” in overcoming the region’s historical problems. Among regionalist parties, “Unser Land” specifically campaigns for a strong region embedded in a supranational EU framework. The “Parti des Mosellans” highlights that in Alsace and Lorraine “European integration must prove itself,” and the “Parti Lorrain” highlights European integration as one of its founding principles, together with other reforms that grant less power to the central state. Appendix C provides more qualitative evidence and all sources.
Data and Validation of Identification Strategy
Data
France is divided into 22 regions, which contain 96 départements. Those are further divided into 323 arrondisements and 1,995 cantons; the latter, however, do not possess the status of a legal entity. My main unit of analysis is the lowest administrative level, the municipality. Data on EU support exists for a maximum of 3,237 municipalities in the six départements in Alsace and Lorraine.
I use two main proxies for EU support—three referenda and electoral success of Eurosceptic parties—as well as different measures to capture mechanisms and preferences. All measures are at the municipal level, unless mentioned otherwise. Details on controls, pretreatment variables, and socioeconomic mechanisms can be found in the respective sections and the online appendix. Tables A.1–A.5 provide all details and descriptive statistics.
EU Support—1972 Referendum about the European Communities (EC) Enlargement
On April 23, 1972, voters were asked whether they approved of Denmark, Ireland, Norway, and the United Kingdom joining the EC. The referendum was approved by 68.3% of voters in France. As for the following referenda, I compute agreement as the share of “yes” votes of all valid votes. Data for 1972 are only available at the département level.
EU Support—1992 Referendum about the Treaty of Maastricht
The Maastricht Treaty, also known as Treaty of the European Union (TEU), introduced the three-pillar structure of the EU. This augmented economic cooperation with a common foreign and security policy and with the fields justice and home affairs. The TEU is seen as, until then, the furthest reaching integration step in the EU history (Moravcsik Reference Moravcsik1998), as it greatly expanded EU competences outlined in the creation of the Euro. Important for minorities, it resulted in the shifting of some nation-state powers either to the EU or to subnational authorities (Mandrino Reference Mandrino2008), and the importance of the European Court of Justice was explicitly recognized. Three countries held a referendum to ratify the treaty, including France. In the end, a close majority of 50.8% of French voters approved it.
EU Support—2005 Referendum on Treaty Establishing a Constitution for Europe
This treaty intended to replace existing EU treaties with a single constitution. As the referenda before, it would have been a major step towards more integration, for instance by replacing unanimity with qualified majority voting in more policy areas. Moreover, it further strengthened the EU as an actor compared with the nation-states. It was rejected by 55% of French voters; later parts of it were integrated in the Lisbon Treaty.
EU Support—Eurosceptic Parties
The aim is to measure the success of Eurosceptic parties in the three European elections taking place between the referenda in 1992 and 2005, occurring in 1994, 1999, and 2004. Besides the temporal fit with the two referenda, we know that the notion of a “Europe of the regions” that protected and empowered minority regions against central states was politically salient during those years.Footnote 11 My first measure classifies a party as Eurosceptic if it has a net positive Eurosceptic score in the manifesto project database (Volkens et al. Reference Volkens, Krause, Lehmann, Matthiess, Merz, Regel and Wessels2018), which contains time-varying assessments regarding the EU.Footnote 12
One potential issue with the first measure is that the far-right party Front National is a large party within the Eurosceptic group, but it also took on strong nationalistic positions. Regions with a history of tensions with the nation-state might for that reason reject to vote for the party, which could lead to a bias. Hence, I also create a second Eurosceptic measure without the Front National. Finally, the previous two measures rely on binary distinctions. For my last measure, I construct a continuous proxy for Euroscepticism by multiplying the vote share of each party running in the elections with the Euroscepticism score assigned to that party in the manifesto database. Table 2 provides descriptive statistics for the outcomes.
Descriptive Table for Outcomes

Mechanisms and Preferences
Other data are described in the respective sections and the appendix. Regarding survey data, the Observatoire Interrégional du Politique (OIP)—conducted between 1987 and 2003—is by far the best source in terms of coverage and number of participants at the French département level. Questions vary between waves, and several waves capture preferences about exit or integration, as well as identity.
Identification
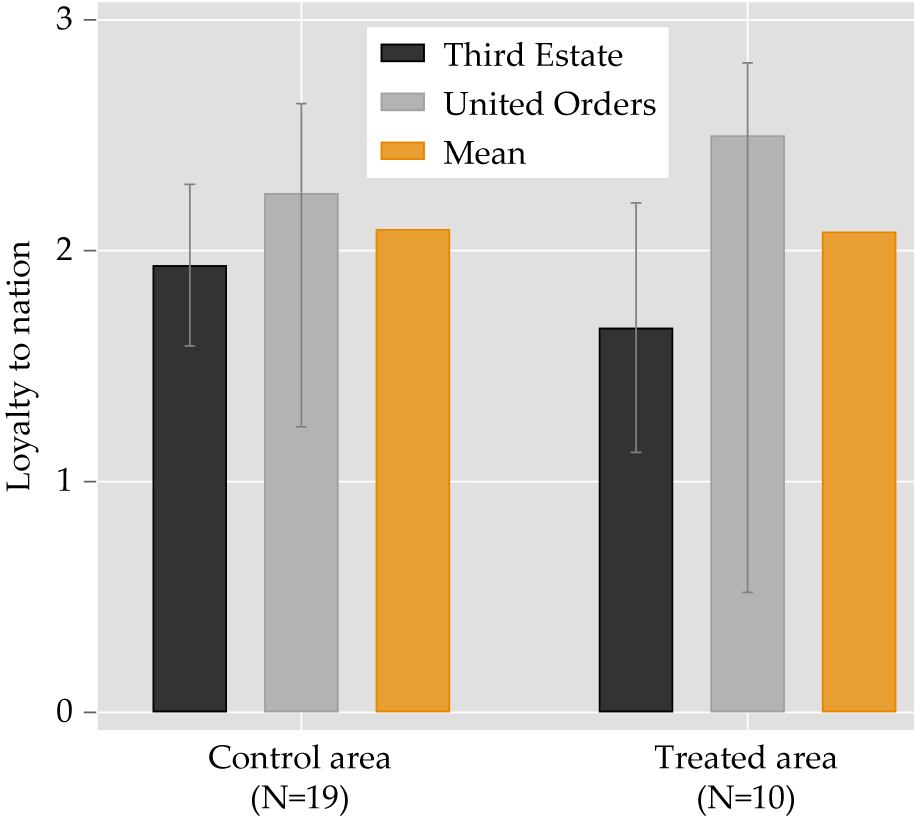
Which assumptions are required to estimate a causal effect in this natural experiment (cf. Sekhon and Titiunik Reference Sekhon and Titiunik2012)? First, for the control group to be a valid counterfactual for the treated group, there should be no differences between the two in absence of the treatment. As the whole region shares a joint history, we can at least test whether there were no pretreatment differences between both parts. Shortly before the French revolution in 1789, Louis XVI felt the need to send out his bureaucrats throughout the country to assess the loyalty of his citizens. The resulting data, known as the “Cahiers de Doléances,” specifically ask about the relative strength of regional identity compared with national identity. Figure 3 shows that there are no systematic differences between treated and control areas for the two “estates” (classes) of the French population and that the average response in the treated and control area is essentially identical.
Cahiers de Doléances
Note: Based on the city-area-level Cahiers de Doléances from 1789, as quantified by Hyslop (Reference Hyslop1968). The city-area measures are based on more disaggregate reports in verbal form. The value 3 corresponds to “National patriotism strongest,” 2 corresponds to “Mixed loyalties: national patriotism combined with regionalism or other,” and 1 corresponds to “Regional, or other, outweigh national patriotism.” I have data for two classes that represent ordinary French citizens: “third estate” and “unified orders.” Mean refers to the arithmetic average. Table A.1 shows the location of Cahiers units.

Second, the assignment of units into in the treated and control area should be as good as random. Technically, strict randomness is not required, but the assignment must have been orthogonal to the outcome. Third, more subtle, but important, historical designs such as mine make the assumption that after the treatment, no third factors that are unrelated to the treatment affect the outcomes differently. Compared with many studies examining long-term persistent effects, I am able to examine outcomes relatively shortly after the treatment (first referendum), as well as more in the midterm. Fourth, to ensure that municipalities are not differentially profiting from EU integration today, I focus on differences between municipalities that are geographically close at the treatment border. I estimate my spatial RD design using a local linear regression:
 $$ {y}_i=\alpha +\beta\;{Treatment}_i+\theta\; Distance\;{border}_i\times {Treatment}_i+{z_i}^{\prime}\gamma +{\delta}_s+{\varepsilon}_i, $$
where
 $ {y}_i $
is the outcome at the municipal level, and
 $ {Treatment}_i $
is a dummy variable taking on the value 1 if the municipality is in the treated area and 0 otherwise. The linear term for the forcing variable,
 $ Distance\kern0.5em {border}_i $
, is allowed to vary in slope on both sides of the border. Conditional on this forcing variable,
 $ \beta $
captures the causal effect of the differences in negative exposure to nation-state actions.
My preferred specification uses fixed effects (
 $ {\delta}_s $
) for five equally long border segments, as well as controls for distance to the five largest cities in the regions (
 $ {z}_i $
). This ensures that municipalities on the other side of the border that are selected as counterfactuals are also geographically close. I compute results for two bandwidths: 10 kilometers and the efficient bandwidth (Calonico, Cattaneo, and Titiunik Reference Calonico, Cattaneo and Titiunik2015). Ten kilometers is picked as the minimum bandwidth given the average diameter of a municipality; to a large extent this captures only municipalities directly at the border.Footnote
13 Standard errors are clustered at the canton level—the second-lowest administrative division in France—accounting for potential correlation across space within cantons.
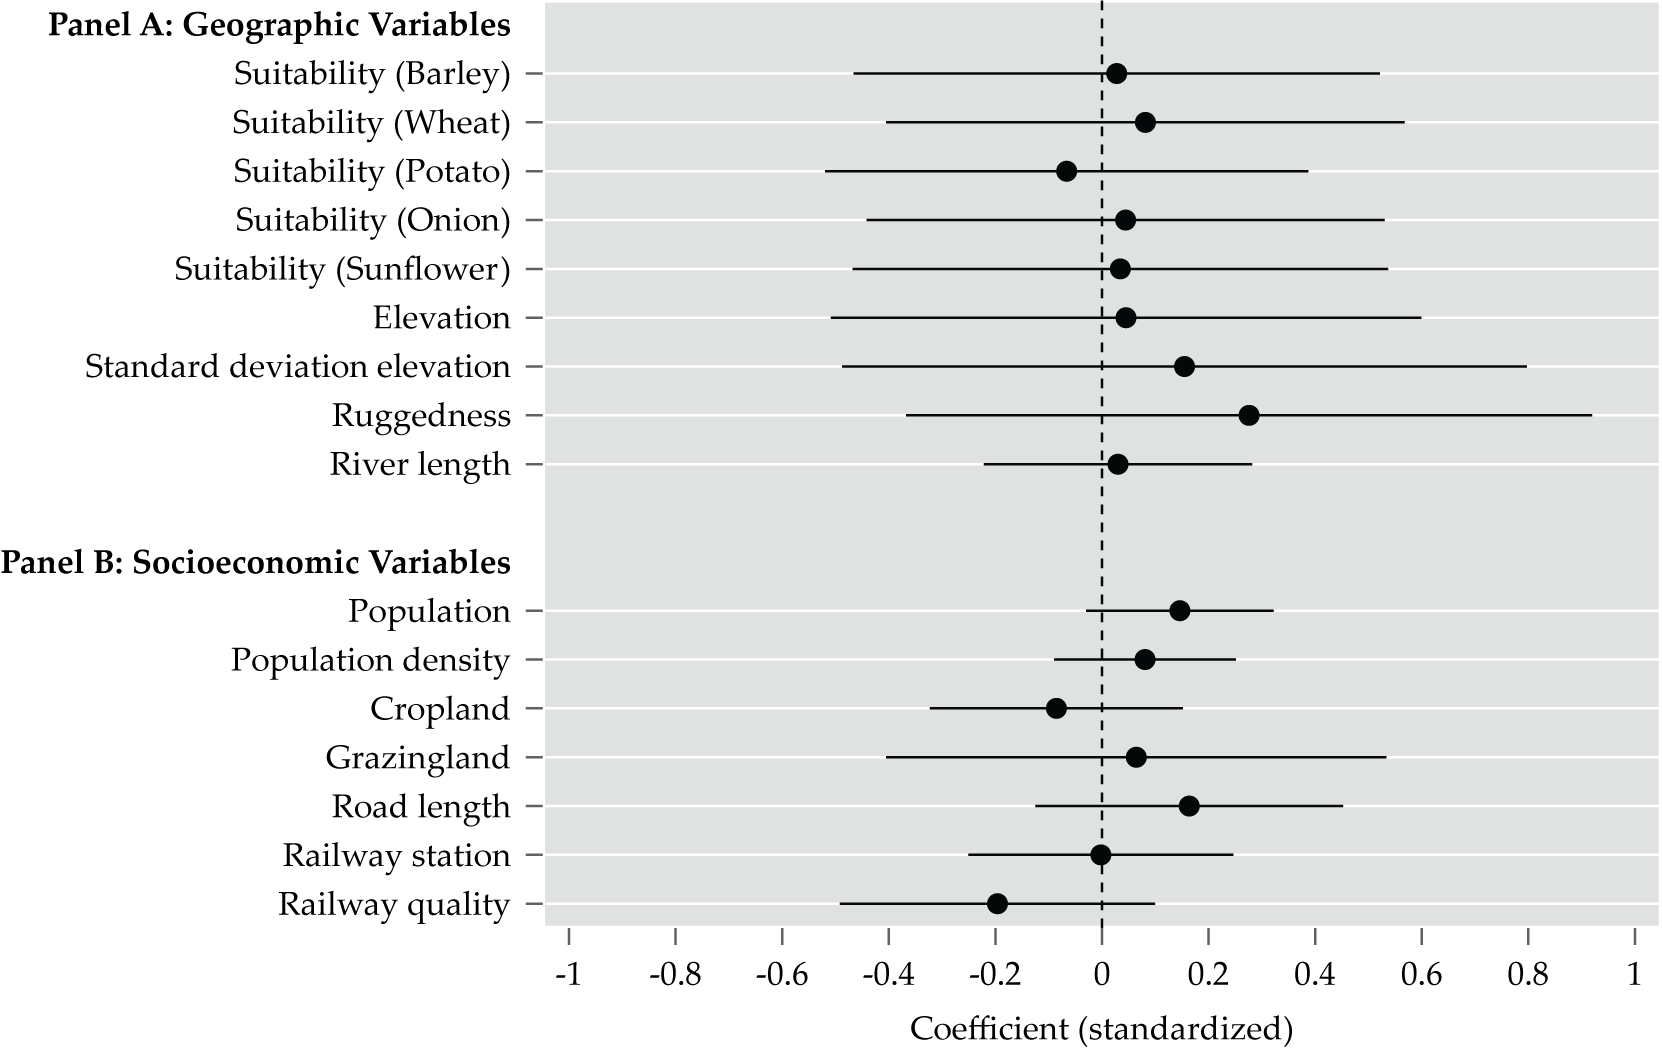
I begin by using the formal RD specification to augment the historical narrative about the border being as-if random with more systematic evidence. If the border location was decided upon from far away in Paris and driven by pride rather than strategic considerations, we would not expect differences at the border in geographic and pretreatment socioeconomic measures. Figure 4 shows that for geographical factors that would suggest strategic considerations influenced the exact local position of the border, there are no discontinuities. I also gathered data from various sources to show that there are no pretreatment discontinuities in a wide range of socioeconomic variables like population (Motte et al. Reference Motte, Seguy, There and Tixier-Basse2003), the share of cropland and grazing land (from HYDE v.3.2), road length (Perret, Gribaudi, and Barthelemy Reference Perret, Gribaudi and Barthelemy2015), and railroad connection and quality (Mimeur et al. Reference Mimeur, Queyroi, Banos and Thévenin2018). Furthermore, Table D.2 shows no discontinuities for 10 years before the division in 1860 in measures like wages and revenues, which are available at the arrondisement level. The absence of significant discontinuities further supports that local geographic, political, or economic conditions did not decide the precise border location.
Smoothness in Pretreatment Variables at the Border
Note: The table shows the RD coefficients with 95% confidence interval. All variables are standardized with mean zero and variance one. Detailed regression results in Table D.1.

Main Results
European Union Support — Referenda
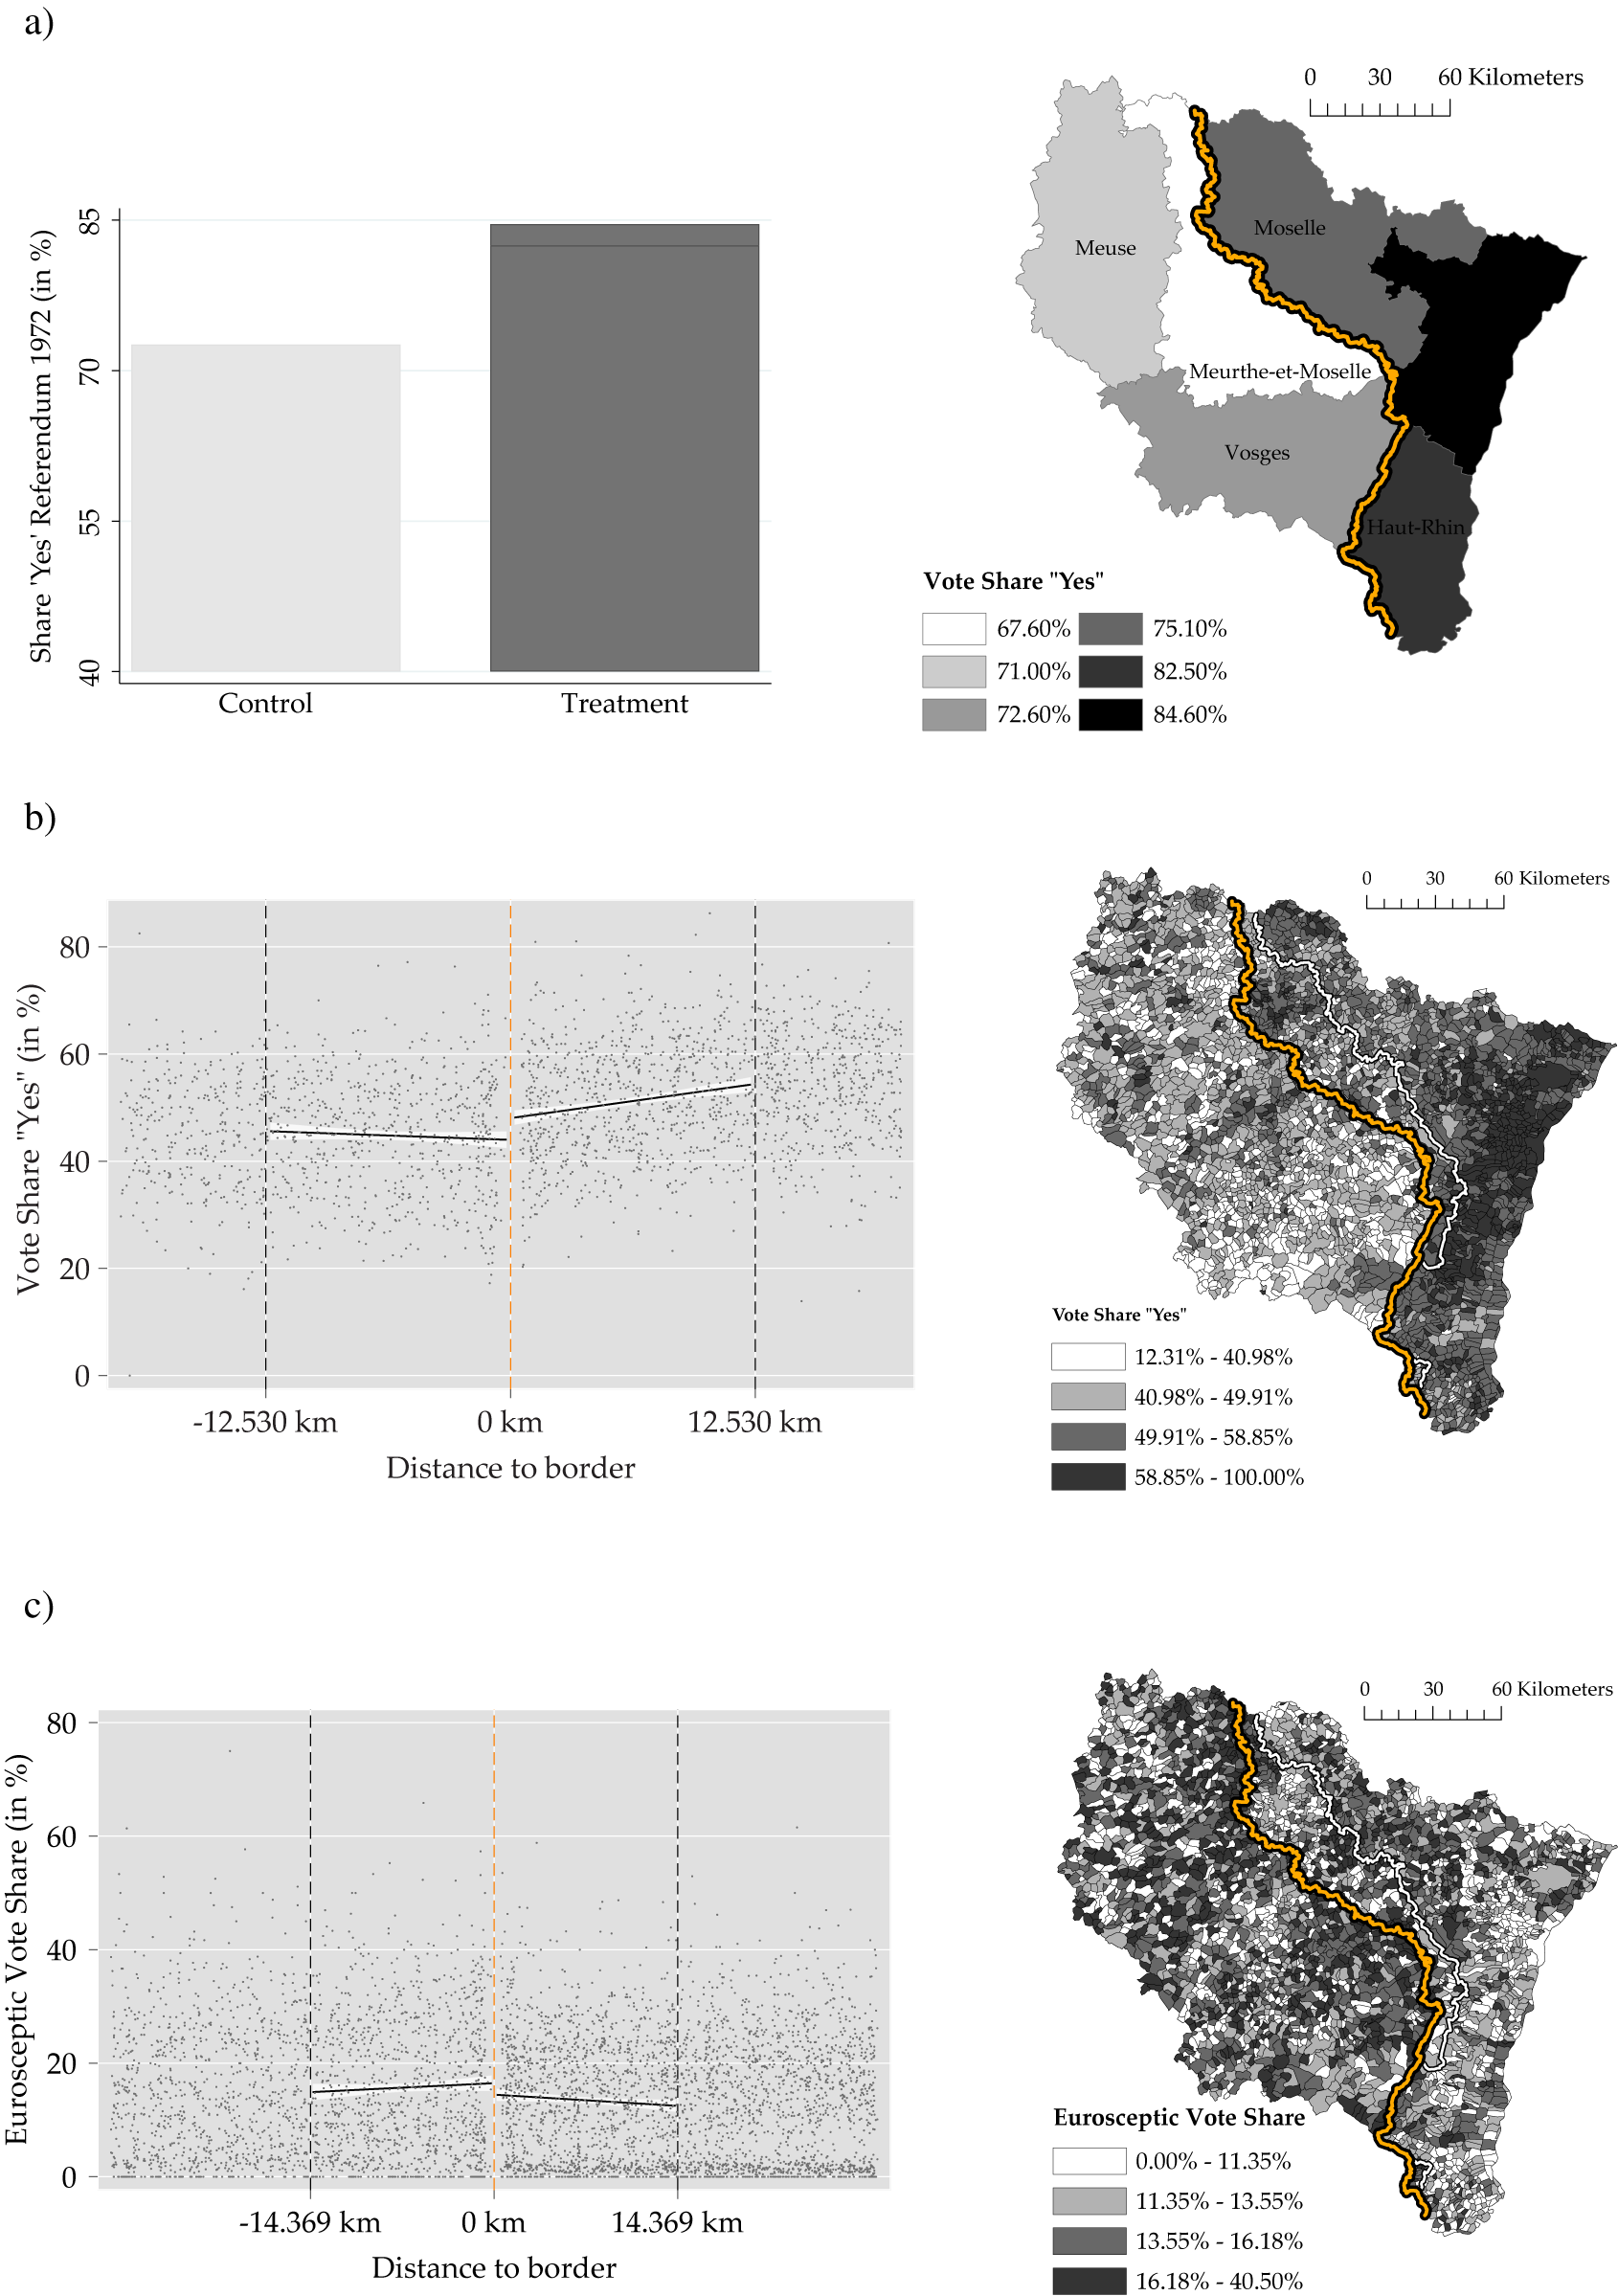
I begin by considering differences in EU support between the treatment and control area in the 1972 referendum about the European Communities enlargement. It is clearly visible in Figure 5a that the average agreement of about 85% in the treated area is considerably higher than the 72% in the control area. The map also shows that EU support is higher in each treated département than in any of the control départements. This comparison allows no causal interpretation, but the results less than two decades after the treatment ended allow us to track the persistence of differences over time and rule out that events after 1972 are the root cause of potential differences in the 1990s.
EU Support and Euroscepticism—Maps and RD Plots. a.) Average Agreement in EU Referendum 1972 in %. b.) Agreement in EU Referenda, Average in 1992 and 2005 in %. c.) Average Vote Share of Eurosceptic Parties in EU Parliamentary Elections 1994–2004 in %.

The first set of causal results then considers the referenda in 1992 and 2005. Figure 5b shows a map with the average municipal-level share of “yes” votes and an RD plot to illustrate the approach and effect. The map shows that, as in 1972, agreement for further EU integration remains considerably higher in the treated area. The RD plot shows a clear jump upwards in agreement at the border, conditional on the running variable.Footnote 14
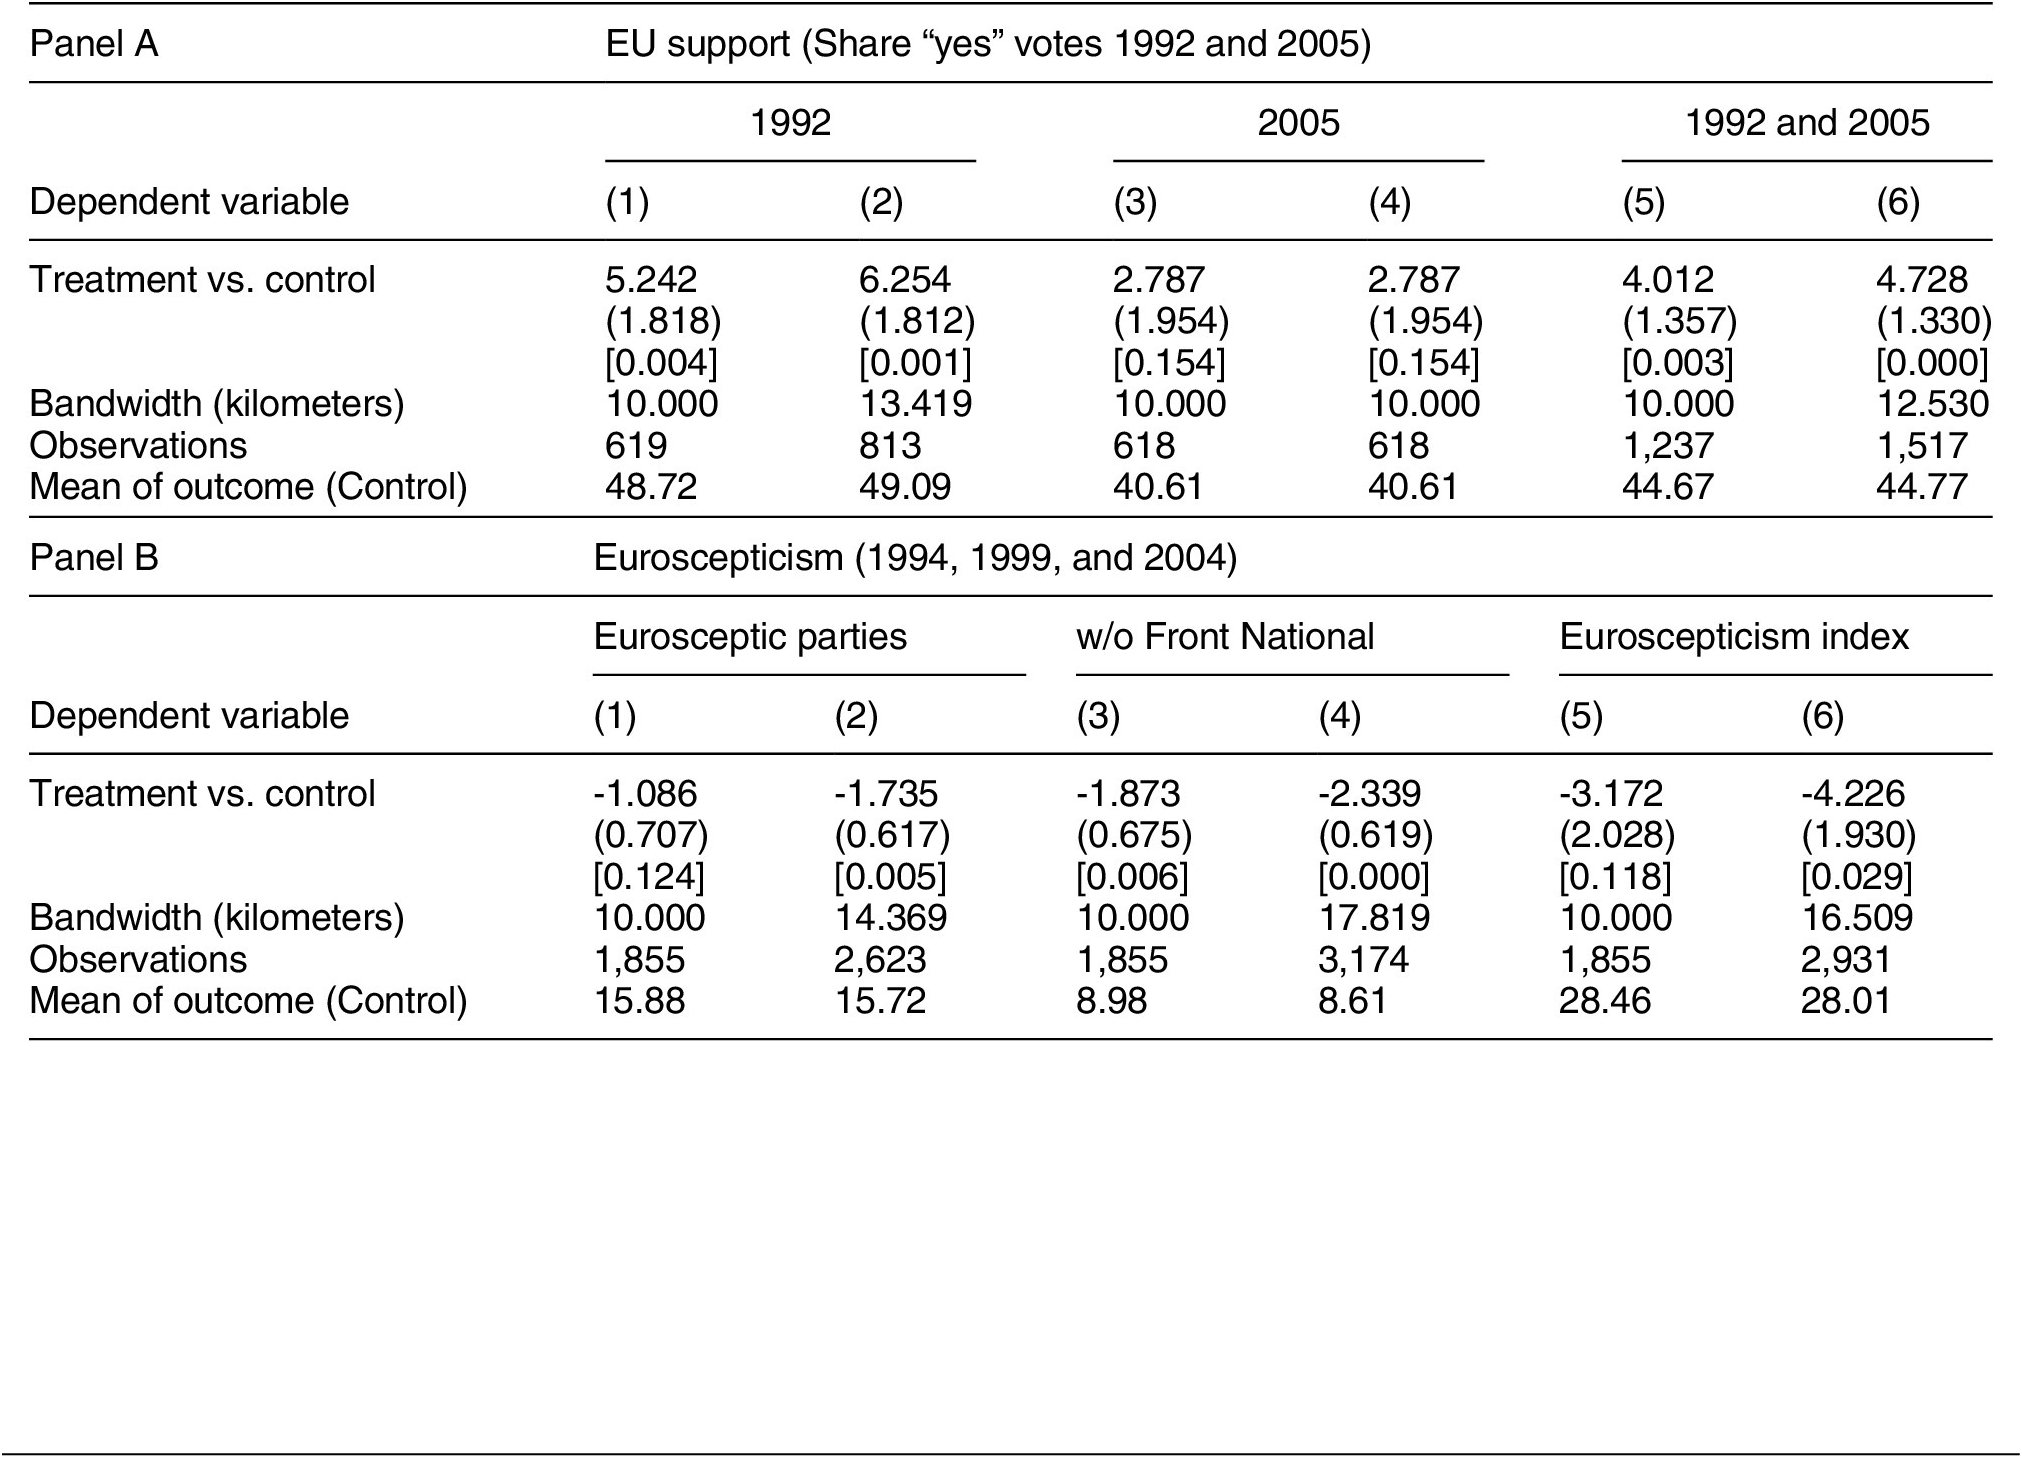
Table 3 shows the results from the RD estimations, always using 10 kilometers and the efficient bandwidth. In 1992, the treatment effect shows 5 and 6 percentage points higher agreement in the treated area. Relative to the mean outcome of about 53%, this is a meaningfully large difference and statistically significant, with p-values smaller than 0.01. The difference in 2005 is smaller at 2.8 percentage points, with p-values slightly above 0.1. The smaller size of the coefficient can partly be attributed to the fact that average agreement was also about 10 percentage points lower than in 1992. When considering the two referenda jointly in a pooled cross section in columns 5 and 6, the treatment effects of 4.0 and 4.7 percentage points are statistically significant at the 1% level. Accordingly, being more negatively exposed to the actions by nation-states in the past led to a persistent and sizable positive effect on European Union support in three referenda over a period of 37 years.
Results for RD — EU Support and Euroscepticism (1992–2005)

Note: Discontinuity at the treatment border using municipalities in Alsace and Lorraine. In panel A, the outcomes are the share of people voting “Yes” in the referendum on the Maastricht Treaty in 1992 and the French European Constitution Referendum in 2005. In panel B, the outcomes in Column 1 are values for the share of people voting for Eurosceptic parties in European parliamentary elections between 1994 and 2004. A Eurosceptic party is defined by having a net negative EU-related score in their manifestos between 1992 and 2003. We list the parties and their EU-related scores in Table D.14. The values for outcome in columns 3 and 4 are adapted to exclude the vote share for the party Front National. In columns 5 and 6, an index capturing Euroscepticism is used, which is a weighted vote share of Eurosceptic parties. Weighting occurs by multiplying the vote share with the euro-negativity score. Included controls are the distances to Germany (border), Metz, Strasbourg, Nancy, Mulhouse, and five segment-fixed effects. Standard errors, clustered on the cantonal level, are displayed in brackets, and p-values are right below them. For each outcome, the left column uses a narrow bandwidth of 10 kilometers, and the right column uses the efficient bandwidth (mean square error criterion; Calonico et al. Reference Calonico, Cattaneo, Farrell and Rocío2017). Full regression results in Tables D.11 and D.12.
EU Support — Euroscepticism
This section uses the three different definitions of political success of Eurosceptic parties outlined in the Data section. In line with the referenda results on higher EU support, the map in Figure 5c indicates that Euroscepticism is lower in the treated area. The RD plot shows a negative jump at the border. Table 3, panel B, then also reveals a significant negative effect on Euroscepticism. The size of the effect differs between the estimations and needs to be interpreted in relation to the mean of the outcome. In column 2, the vote share is 1.7 percentage points lower relative to a mean of about 14%. Omitting the nationalist party Front National leads to a relatively larger effect, corresponding to a lower vote share by 1.8 to 2.3 percentage points, against a mean of about 7. Finally, columns 5 and 6 use the overall weighted Euroscepticism index score, the most comprehensive and my preferred measure of Euroscepticism. Again, Eurosceptic positions are significantly less successful in the treated area. For all measures, the effects are statistically significant, with p-values below 0.05 when using the efficient bandwidth; the very conservative 10-kilometer bandwidth specifications are still at least close to the 0.1 threshold, but more importantly they yield comparable point estimates.
Potential Effect of Historical Linguistic Differences
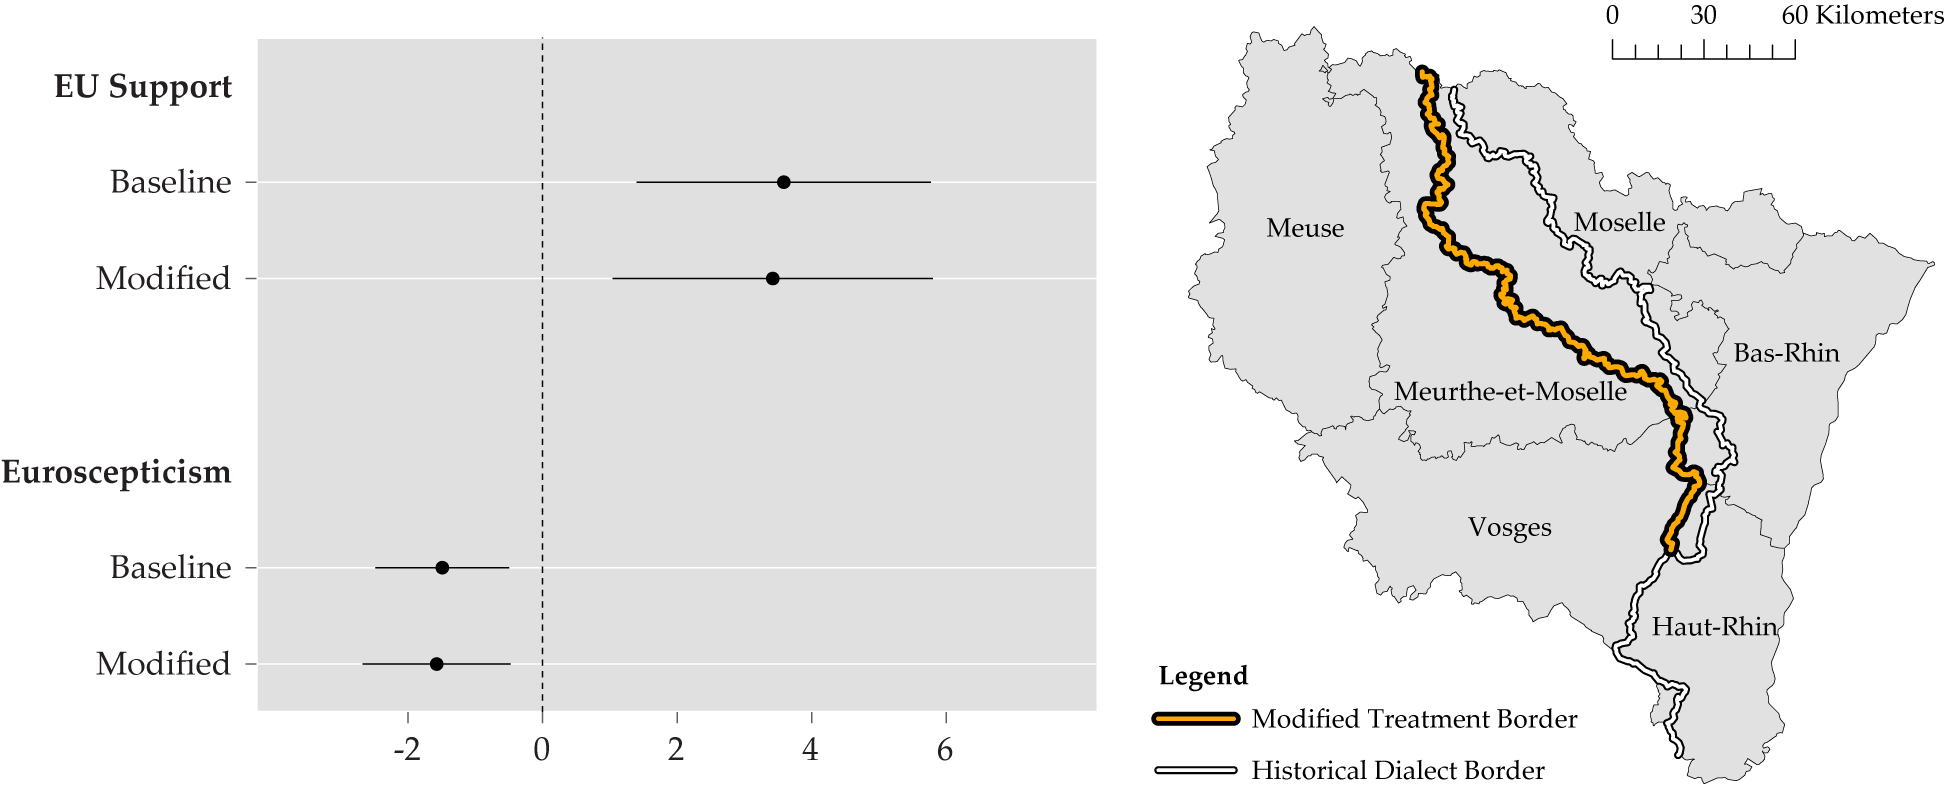
To some extent, in particular in the most southern areas, the treatment border coincides with the historical linguistic border dividing German- and French-dialect speakers. This could bias the results on EU support if, for instance, German-dialect speakers would generally be more favorable towards the EU. To address this potential issue, I exclude these parts of the border and rely only on a comparison between the treated and control areas within the French dialect area. The right-hand side of Figure 6 illustrates this border modification. The coefficient plot on the left-hand side of the figure shows that even when considering only the discontinuities within also linguistically homogeneous regions, the treatment effects for the referenda and Euroscepticism remain stable with respect to size and statistical significance.
Robustness — Modified Border Excluding Overlaps with Linguistic Border
Note: The coefficient plot displays the main and alternative treatment coefficients, with standard errors clustered on the cantonal level. EU support is average of the share of people voting “Yes” in the Maastricht referendum 1992 and in the European Constitution referendum in 2005. Euroscepticism is the weighted Eurosceptic party share in European parliamentary elections between 1994 and 2004. Baseline is the complete border, modified only by excluding the part not overlapping with language border (see map on the right). Optimal bandwidth is selected following the mean-square-error criterion (Calonico et al. Reference Calonico, Cattaneo, Farrell and Rocío2017). Included controls are distances to Germany (border), Metz, Strasbourg, Nancy, and Mulhouse. Corresponding regression results are in Table D.10. Figure D.1 shows the results of a further test excluding all German-speaking municipalities altogether. Figure D.2 presents the results for additional outcomes. Source of linguistic border: Harp (Reference Harp1998).

Preferences and Mechanisms
Mechanisms: Socioeconomics, Policy, or Identity
This setting does not allow for pinning down exactly through which mechanism memories of historical experiences are kept alive and lead to potential differences. The qualitative evidence in the section, the Division of Alsace and Lorraine as a Natural Experiment, and in Section C.5 in the appendix suggests an active role of regional organizations. I try to rule out other explanations here; Appendix C provides more details.
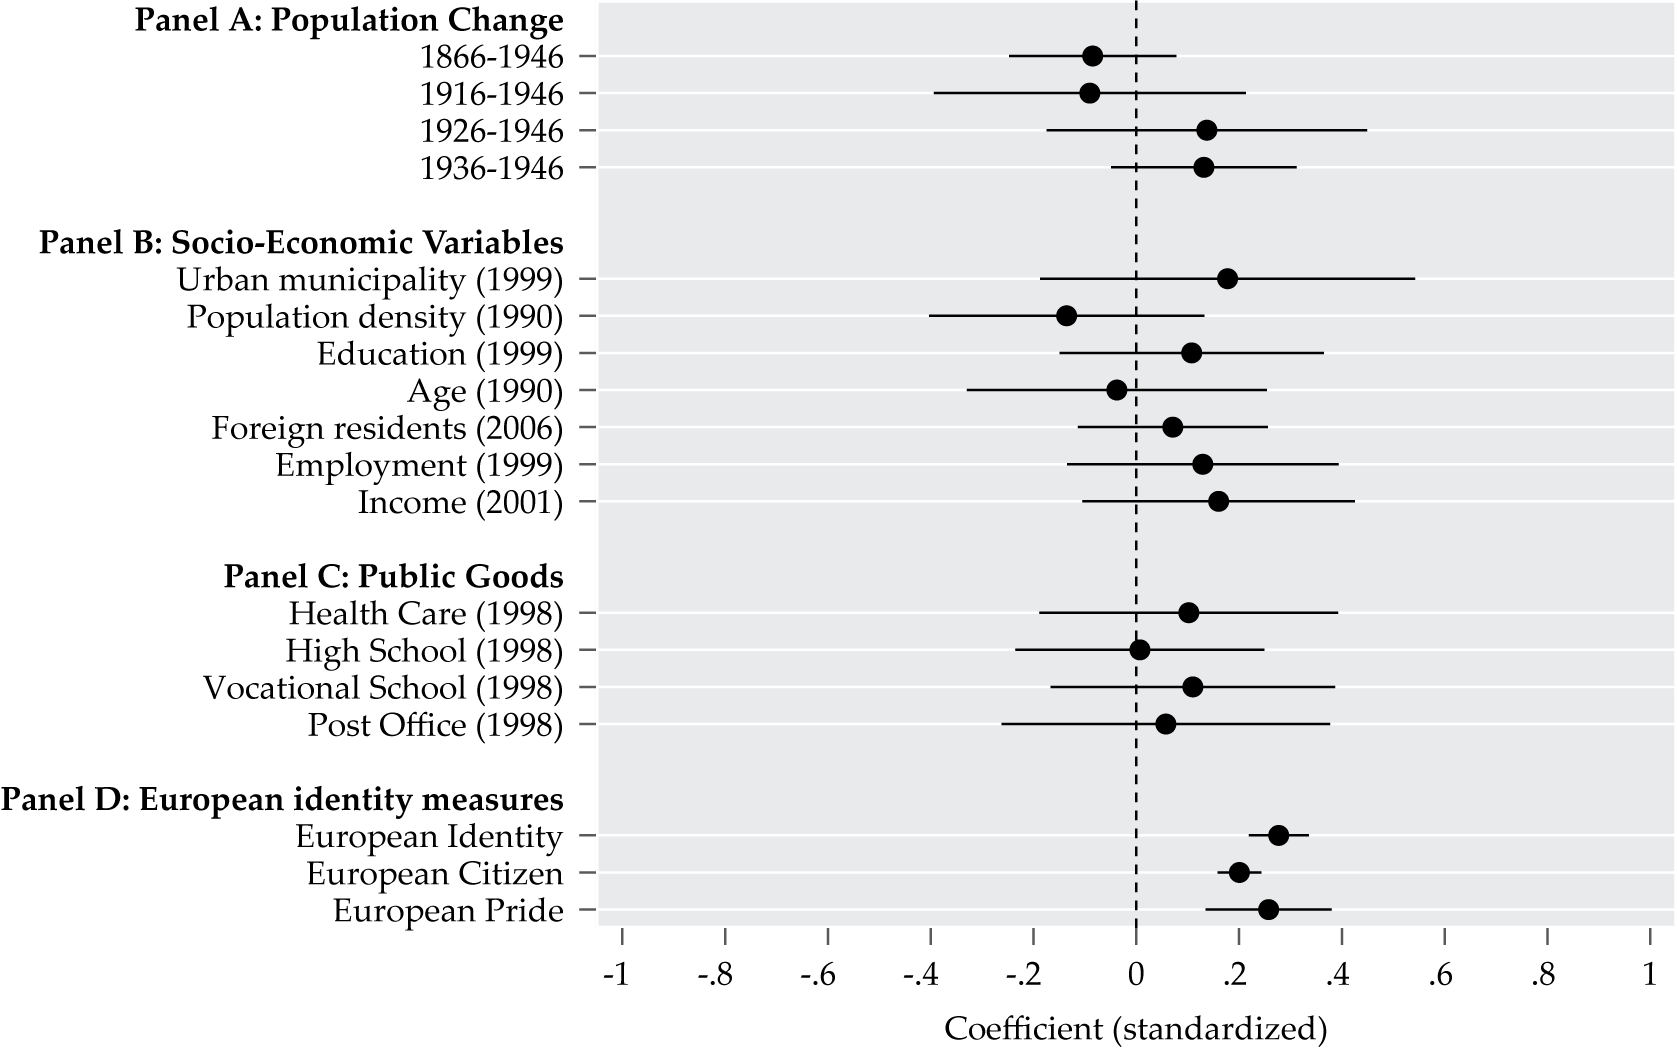
I find no significant changes in population—potentially caused by the treatment—at the border, suggesting that this does not explain the differences in EU support (Figure 7, panel A). Taken together, neither population changes nor other policies associated with the more negative historical exposure to nation-states led to significant differences in socioeconomic aspects, which could directly explain support for supranational integration (panel B). Finally, although the treated and control areas correspond to different départements—within the same administrative region—there is no evidence of significant discontinuities in public good provision, which could influence preferences (panel C).
Mechanisms—Population Changes, Socioeconomic Factors, and Public Goods
Note: Panels A–C show RD values, and panel D shows the OLS coefficients, with 95% confidence intervals. Public good provision is measured per capita. We use the oldest available measures since 1990 (year in parentheses), see Figure C.2 for additional years. All variables were standardized with mean zero and variance one. Included controls in panels A–C are the distances to Germany (border), Metz, Strasbourg, Nancy, Mulhouse, and 5 segment-fixed effects. Detailed results are in Table D.3. The OLS regressions in panel D are at the département level and control for respondent age, employment status, education, and sex. Source of European identity measures is the Observatoire Interregional du Politique (OIP).

Alternatively, I test the idea that a joint European identity positively influences support for European integration, as proposed by Hooghe and Marks (Reference Hooghe and Marks2004; Reference Hooghe and Marks2005) and highlighted in constructivist theories (Hooghe, Lenz, and Marks Reference Hooghe, Lenz and Marks2019). A sense of the common suffering of Europeans from repeated wars and repression by nation-states during prior centuries, and the hope that EU integration can be a remedy, could lead to such a stronger sense of community. I use three survey measures for European identity, combining various waves of the French OIP surveys. I estimate an effect using OLS with individual controls at the département level, essentially comparing the conditional means between the treated and control areas. Panel D shows that indeed there seems to be a significantly stronger EU identity in the treated area. Depending on the proxy, European identity is a quarter to a third of a standard deviation stronger.
Preferences for Exit and Integration
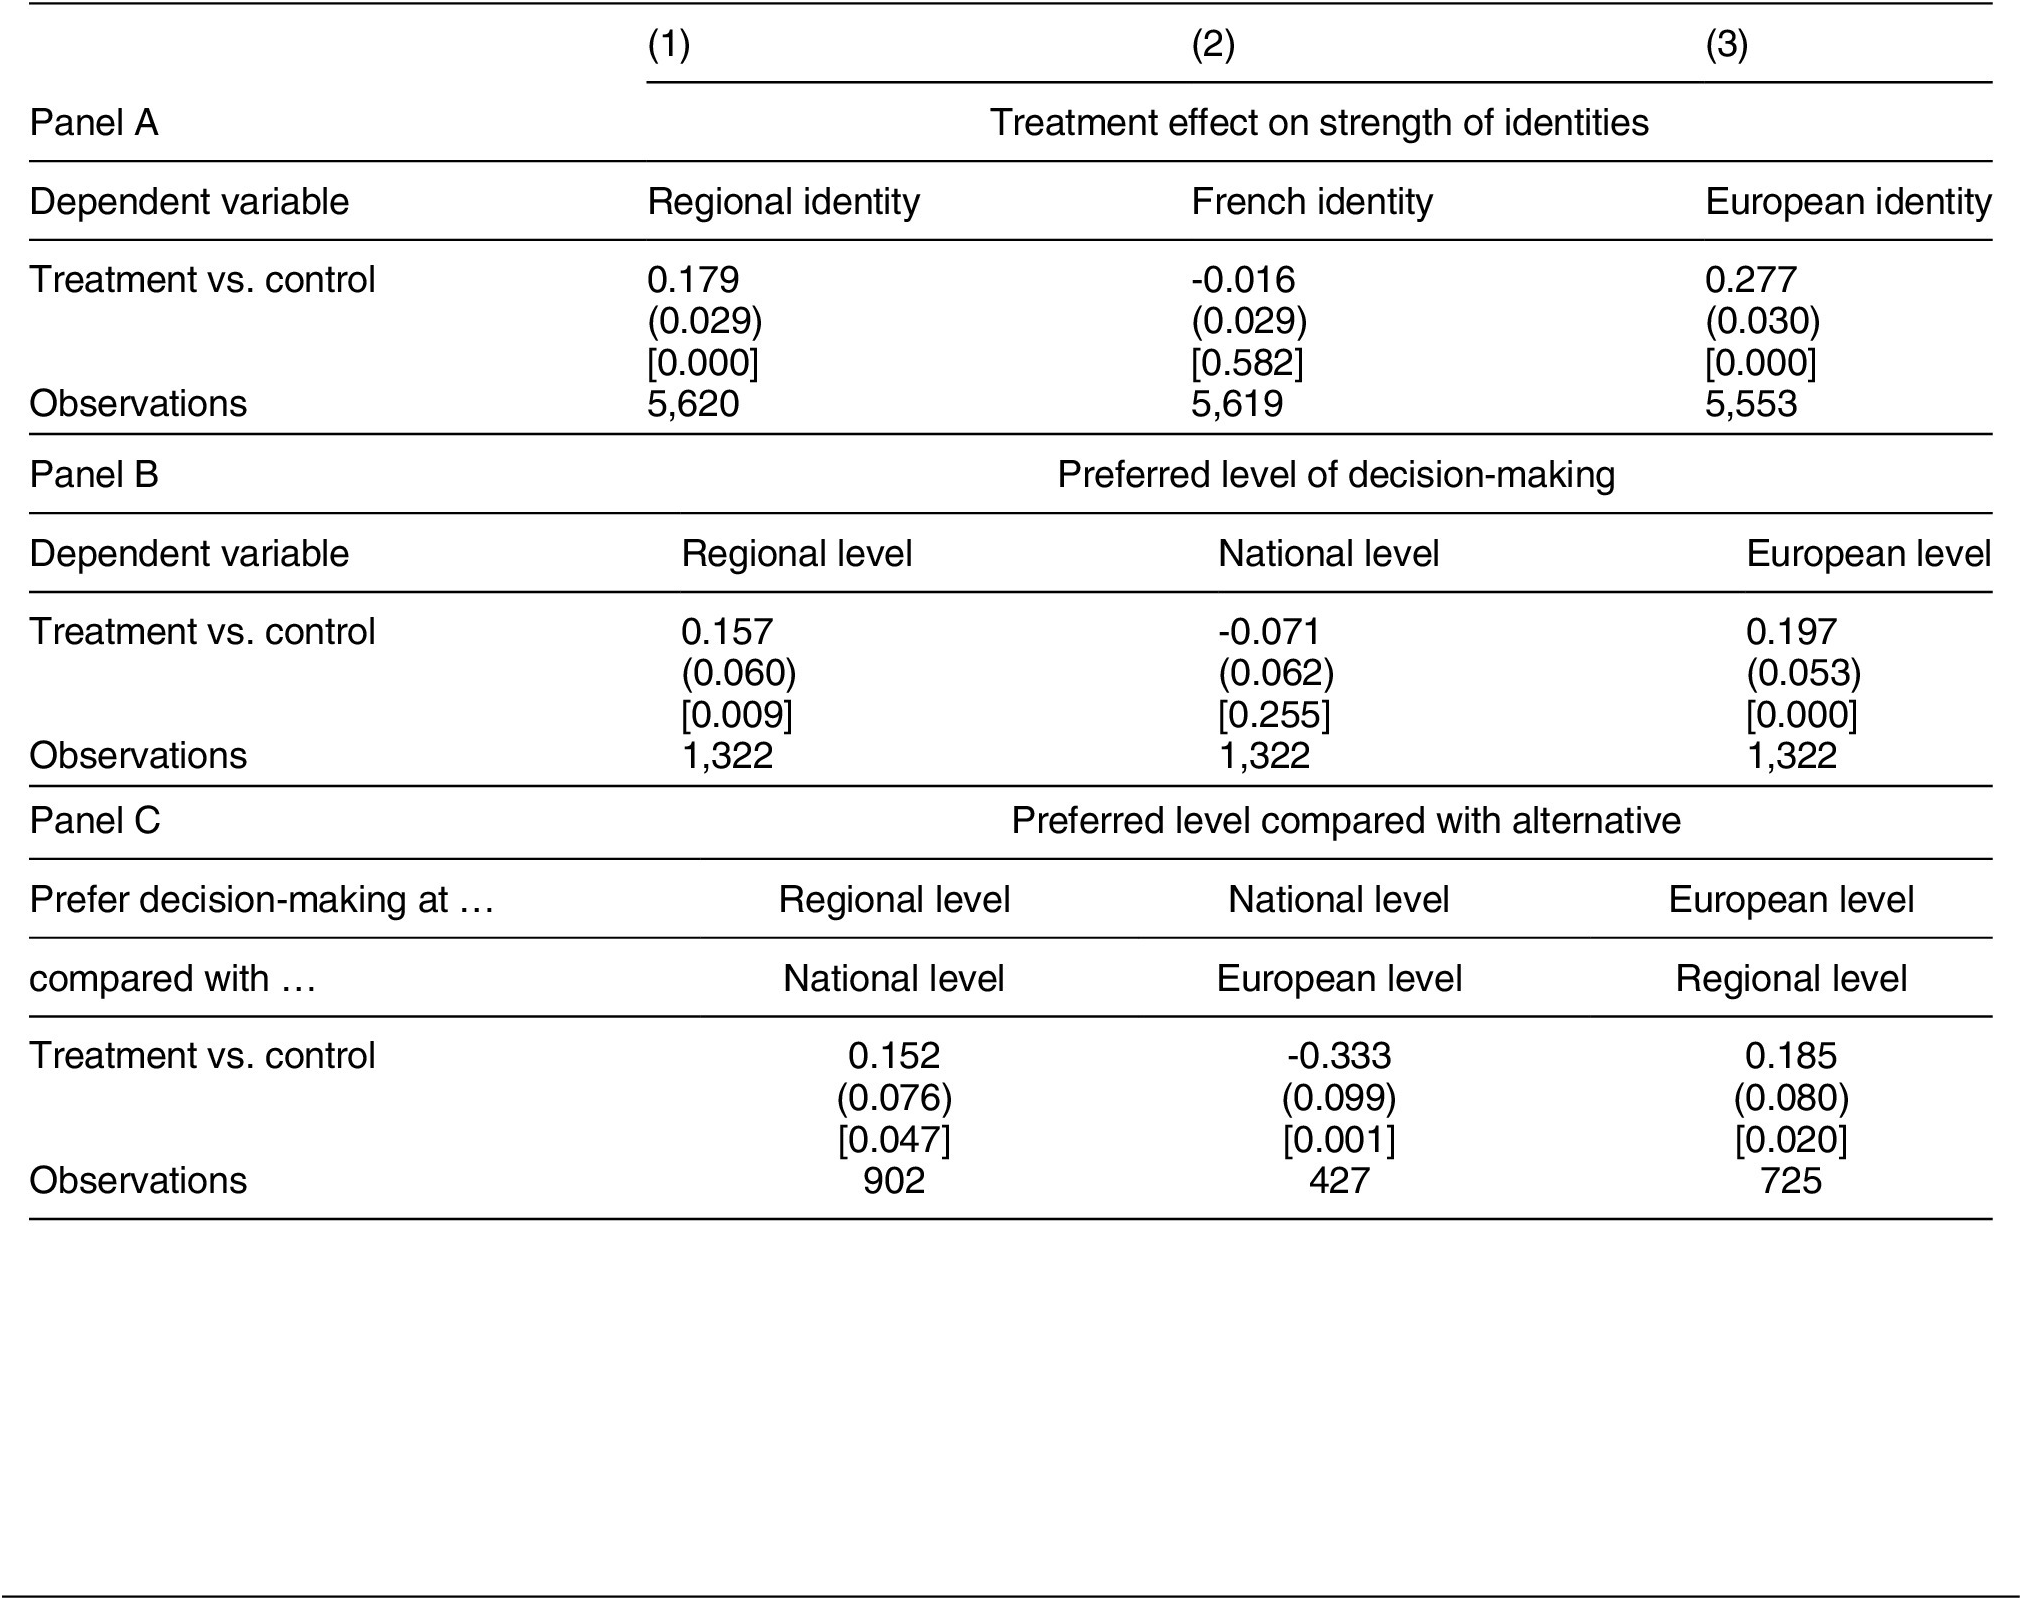
One cornerstone of my theoretical framework is that exit and integration options can both be means to constrain the higher-level government unit responsible for negative historical experiences. This should be reflected in preferences to move decision-making power away from the nation-state level—upwards or downwards. The département-level results in Table 4, based again on the OIP surveys, provide convincing evidence in line with my theory.
Nested Identities: EU, National, and Regional (Alsace and Lorraine) Level

Note: “X” Identity: “Could you tell me whether you feel very attached, rather attached, not very attached, or not attached at all to X?” The higher the value the more attached the respondent is to X. The letter X refers to Europe, the nation (France in this case), and the region, asked in separate questions. These questions were available for the years 1995, 1997, 1999, and 2001. Main question in the panels B and C: “In your opinion, should the development of your region occur according to a plan decided by the region, the state, or the European Union?”—is only available in 1991. In panel B, “X” Level is a dummy variable indicating the choice of “X” (region, state, or EU). In panel C, for each column the sample is reduced to only the respondents chosing either Option 1 or 2 (Option 1 = 1; Option 2 = 0). The European identity measure in panel D is identical to the first measure in Figure 7. Regressions control for age, employment status, education, and sex. Standard errors in brackets and p-values right below. All outcome variables are standardized with mean zero. Source: Individual-level survey data from the OIP.
I begin by examining differences in regional, national French, and European identity. Indeed, I find no effect on national identity but a significantly stronger regional and European identity. Dehdari and Gehring Reference Dehdari and Gehring2018 provide more evidence on regional identity. This is evidence that people in the treated area did not simply become more cosmopolitan or overcome existing lower-level identities per se. Rather, in line with my theory, devolution (exit) and upward (European) integration align with preferences for lower- or higher-level decision-making. The fact that French identity is only insignificantly weaker indicates that the motivation of people after so many decades is not mere grievances against fellow Frenchmen but rather the fear of suffering again from actions by nation-state governments.
However, the decisive metric for preferences about the vertical distribution of power is the preferred level of decision-making in the treated versus control area. In line with the identity differences, panel B shows a stronger preference for decision-making at either the regional or the European level—in line with regional and European identity being stronger relative to national identity.Footnote 15 Panel C considers the possible levels as alternatives to each other. The results are again clear. Respondents in the treated area prefer both the regional and the European level compared with the national level (columns 1 and 2).
Placebo Tests and Sensitivity
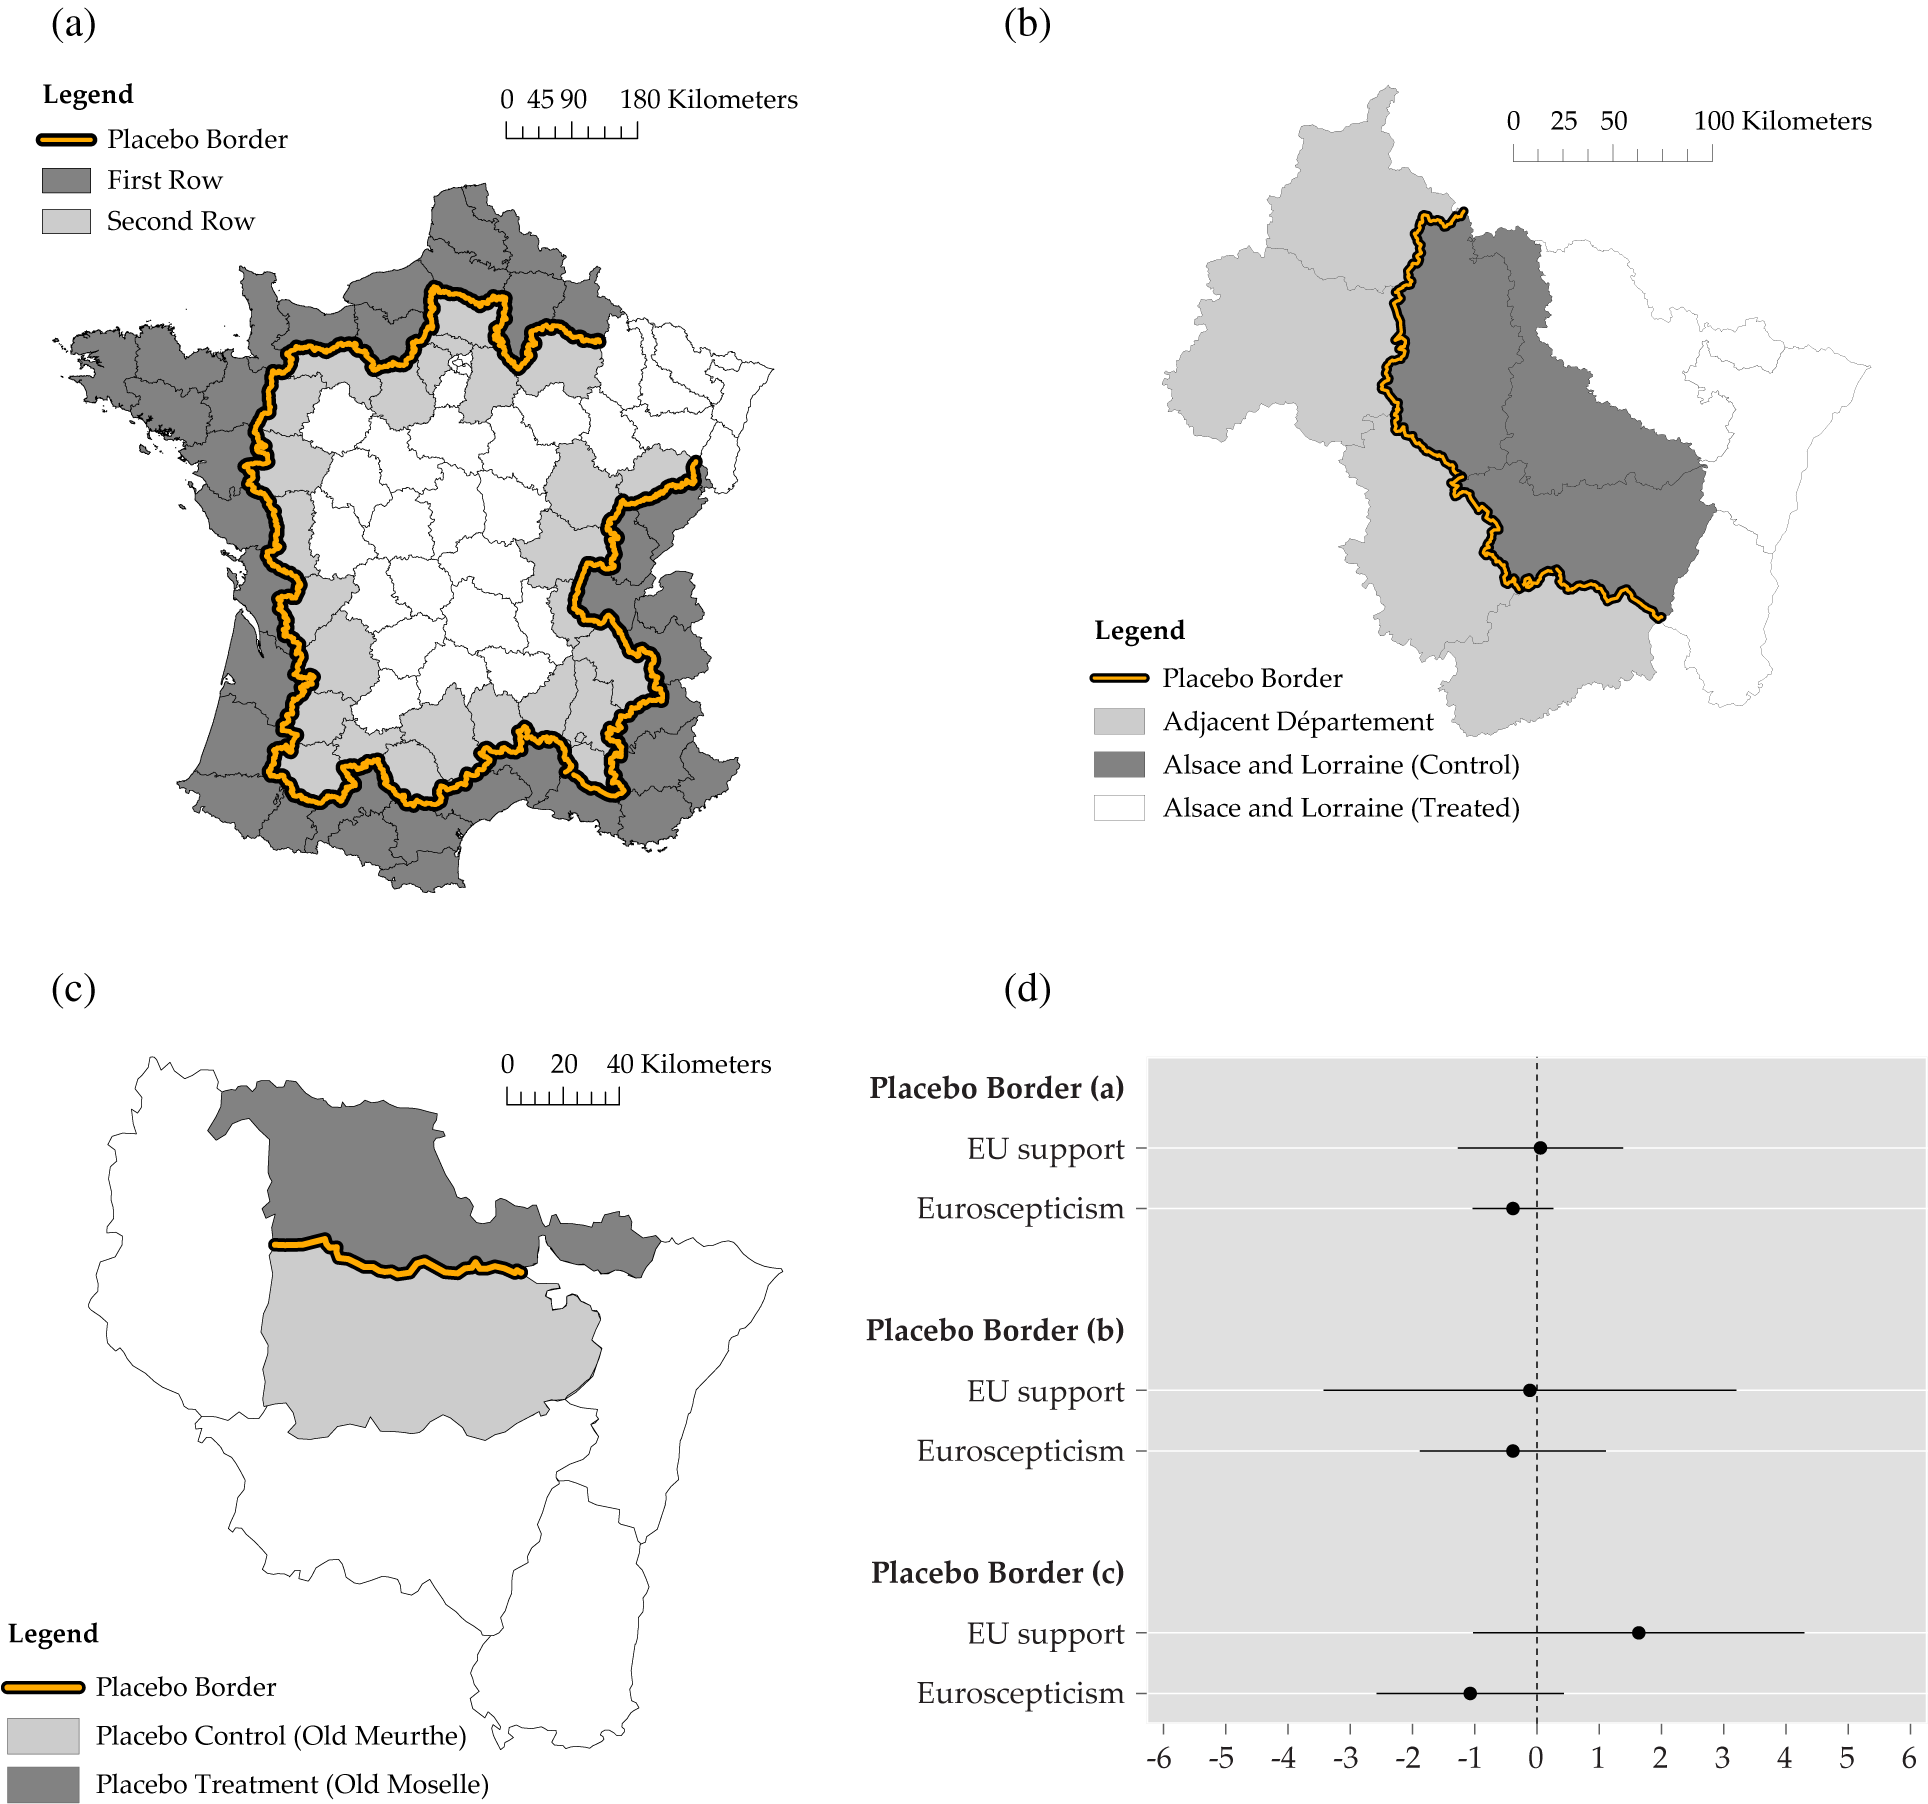
Three placebo tests help to verify the validity of the main results. The first two examine to what degree the prior results could be driven by general differences between border départements and the rest of the country. The first uses a placebo border between all French border départements and the next adjacent départements—excluding the départements in my main analysis. The second test moves the treatment border one département further towards the center, now focusing on the border between Alsace and Lorraine and the region Champagne-Ardenne.Footnote 16 The third test uses the old département border within Lorraine prior to 1870. Differences within the region before the actual treatment period could signal that a potentially problematic heterogeneity already existed before the division. Figure 8, panels (a) to (c) visualize the respective placebo borders in orange.
Placebo Borders. (a) Départements at the French Border. (b) Control Area vs. Rest of France Border. (c) Pre-1870 Meurthe-Moselle Border. (d) Coefficient Plots at Placebo Borders.
Note: Map (a) shows the départements at the French border (black) and their adjacent départements (gray). This excludes the départements that constitute Alsace and Lorraine and the second-row département Haute Marne. Haute Marne has no counterfactual on the first-row side due to this exclusion of the Alsace and Lorraine regions. The border separating first and second row départements is used as a placebo border (bold orange line). Map (b) displays the border between the former départements Meurthe and Moselle before 1871 (bold orange line). Map (c) shows the border between the control départments in the main regression and their adjacent départements inland (bold orange line). The coefficient plot displays the placebo treatment coefficients. EU Support is the average share of people voting “Yes” in the 1992 and 2005 referenda. Euroscepticism is the Eurosceptism score for EU parliamentary elections between 1994 and 2004. The optimal bandwidth is selected with respect to the mean-square-error criterion (Calonico et al. Reference Calonico, Cattaneo, Farrell and Rocío2017). Included controls: distance to Germany (border), distance to Metz, distance to Strasbourg, distance to Nancy, and distance to Mulhouse. Detailed results are in Table D.13.

Figure 8, panel (d) shows the results, focusing on the average of the 1992 and 2005 referenda and the Euroscepticism score as my preferred outcomes. None of the placebo effects turn out to be significant, and all are considerably smaller than the actual effects. Hence, there is no evidence that the effect is driven by preexisting differences or border départements generally being different.
My main results are also robust to a large variety of sensitivity tests, shown and discussed in more detail in the online appendix. For instance, they remain very similar with respect to sign and magnitude without controls (Table D.6), when clustering on a different level (Table D.7), controlling for latitude and longitude (Table D.8), or additionally controlling for pretreatment variables (Table D.9). Figure D.3 shows that all main results are robust to a variety of alternative RD bandwidths. Table D.15 shows robustness of the Euroscepticism results to using an alternative to the manifesto data. Figure D.4 and Figure D.5 provide further département-level evidence that the differences already existed prior to 1994.
Conclusion
This paper outlines a theoretical framework to consider how negative historical experiences with higher-level governments affect preferences about the vertical distribution of power. It is often implicitly assumed that such events lead to preferences for exit strategies—decentralization, autonomy, secession. I explain why and under what conditions integration—centralization, supranationalism, delegation to IOs—can be a feasible alternative for affected groups and regions. This fosters our understanding of federalism (e.g., Rodden Reference Rodden2002; Reference Rodden2006) in general, as well as secessionism (e.g., Cederman et al. Reference Cederman, Hug, Schädel and Wucherpfennig2015; Gehring and Schneider Reference Gehring and Schneider2020) and international integration more specifically.
By highlighting that deep-rooted historical differences can explain considerable differences in EU support, the paper contributes to a growing literature about the importance of history in influencing current preferences and behavior (e.g., Fouka and Voth Reference Fouka and Voth2016; Mazumder Reference Mazumder2018b; Rozenas and Zhukov Reference Rozenas and Zhukov2019). I connect those historical influences theoretically to preferences in a setting where such influences have been largely disregarded. The empirical results document a source of persistently stronger support for EU integration. This highlights the role of the EU as an IO that contributes to maintaining peace between its members and helps prevent member-states from implementing discriminatory policies against minority regions. In times where international cooperation and multilateralism are under attack, this is an important and novel insight for our understanding of support for supranational integration and IOs.
The paper also provides a more comprehensive picture of the origins of current political preferences. It augments an existing EU support literature that largely focuses on the role of personality traits, individual socioeconomic features, and domestic politics. My framework helps to better understand why many minority regions and those experiencing tensions with their nation-states exhibit strong electoral support for regionalist parties but at the same time also support for supranational integration. I thus augment existing correlational evidence for the EU by showing that historical tensions with nation-states causally influence individual preferences and voting behavior today. Qualitative evidence suggests that regional private and public organizations play an important role in keeping historical memories salient.
The theoretical framework provides insights beyond this application by highlighting the importance of historical tensions between different levels in multilevel governance systems for preferences about the vertical distribution of power. By explicitly outlining the conditions under which those events can influence preferences and actions towards supporting integration strategies, the framework can be adapted to other circumstances. The findings also raise several interesting questions. For instance, future research could explore to what extent central government policies or modes of political representation condition the persistent effect of history. To what degree are unitary states different than federal states? What is the relationship between changes in decentralization within countries and support for integration?
Supplementary Materials
To view supplementary material for this article, please visit http://dx.doi.org/10.1017/S0003055420000842.Replication materials can be found on Dataverse at https://doi.org/10.7910/DVN/NNFDNB.





Comments
No Comments have been published for this article.