Introduction
In the history of mortality improvement, evidence indicates a steeper decline at younger age than at older age resulting in an improvement in the average lifespan (Wilmoth & Horiuchi, Reference Wilmoth and Horiuchi1999). One of the manifestations of declining mortality that has not been widely acknowledged in the published literature is the accompanying decrease in lifespan variation (Engelman et al., Reference Engelman, Caswell and Agree2014). A strong negative correlation between life expectancy at birth and lifespan variation has been found in several developed countries (Shkolnikov et al., Reference Shkolnikov, Andreev, Zhang, Oeppen and Vaupel2011). Although lifespan variation decreases as life expectancy increases, there are exceptions to this phenomenon. Significant differences in lifespan variation have been observed between and within countries. This is evident from the fact that a country like the United States is close to England and Wales in mean life expectancy, but displays a comparatively higher lifespan variation (Shkolnikov et al., Reference Shkolnikov, Andreev, Zhang, Oeppen and Vaupel2011).
Vaupel et al. (Reference Vaupel, Zhang and Van Raalte2011) observed that most of the countries that have successfully reduced premature deaths (thereby bringing down the variation in lifespan) are the countries that have higher life expectancy. The decomposition of difference in lifespan variation by age shows that the decline in infant and early adult mortality can explain this difference (Shkolnikov et al., Reference Shkolnikov, Andreev, Zhang, Oeppen and Vaupel2011; Vaupel et al., Reference Vaupel, Zhang and Van Raalte2011). Several studies have confirmed the greater contribution of early age mortality for a comprehensive understanding of the average length of life (Chaurasia, Reference Chaurasia2010; Saikia et al., Reference Saikia, Jasilionis, Ram and Shkolnikov2011) and lifespan variation (Edwards & Tuljapurkar, Reference Edwards and Tuljapurkar2005; Vaupel et al., Reference Vaupel, Zhang and Van Raalte2011; Shkolnikov et al., Reference Shkolnikov, Andreev, Zhang, Oeppen and Vaupel2011). Lifespan variation is also divided into early and later life components based on different causes and implications (Vaupel et al., Reference Vaupel, Zhang and Van Raalte2011).
India has witnessed significant mortality transition within a short span of time. Life expectancy for males increased from 23.7 years in 1881 to 64.6 years in 2006–2010, and from 25.6 to 67.7 years for females over the same period (Dandekar, Reference Dandekar1972, RGI, 2012). Child mortality has also shown a downward trend (Saikia et al., Reference Saikia, Singh and Ram2010), and this has been complemented by a substantial reduction in adult mortality in the age group 15–60 years (Rajaratnam et al., Reference Rajaratnam, Marcus, Levin-Rector, Chalupka, Wang and Dwyer2010). Ponnapalli (Reference Ponnapalli2008) attributed the decline in child and adult mortality to the improvement in life expectancy at birth in India.
In India, the significant fall in mortality in the recent past would exert a pronounced effect, not only on life expectancy at birth, but also on lifespan variation. Very little, however, is known about the trends and patterns of lifespan variation in India, because most of the investigations have focused on inequalities and disparities in infant, child and adult mortality rates and their influence on increased life expectancy. The present study is an attempt to fill this gap by assessing trends in mortality from the perspective of lifespan variation. The focus of the investigation is the analysis of trends in lifespan variation at both early age and adult age, keeping in view that child and adult mortality rates are the drivers of improvement in life expectancy at birth. It is expected that a change in the distribution of early age deaths can explain alterations in lifespan variation. In view of the substantial loss of potentially productive years of life in recent times (Reddy et al., Reference Reddy, Shah, Varghese and Ramadoss2005), a detailed study of early life disparity would have strong relevance and implications for policymaking.
Variation in mortality can be measured using indicators such as S 10 (Edwards & Tuljapurkar, Reference Edwards and Tuljapurkar2005), the interquartile range (Wilmoth & Horiuchi, Reference Wilmoth and Horiuchi1999), the Gini coefficient (Shkolnikov et al., Reference Shkolnikov, Andreev and Begun2003), the Theil index of inequality (Smits & Monden, Reference Smits and Monden2009) and average inter-individual difference and related measures of absolute inequality (Shkolnikov et al., Reference Shkolnikov, Andreev and Begun2003; Moser et al., Reference Moser, Shkolnikov and Leon2005). S 10 is defined as the standard deviation of the age at death, conditional on survival to the index age of 10 (Edwards & Tuljapurkar, Reference Edwards and Tuljapurkar2005). The interquartile range equals the distance between the lower and the upper quartiles of the distribution of ages at death in a life table (Wilmoth & Horiuchi, Reference Wilmoth and Horiuchi1999). The Gini coefficient is the mean of absolute differences in individual ages at death relative to the average length of life (Shkolnikov et al., Reference Shkolnikov, Andreev and Begun2003), and the Theil index of inequality quantifies the inequality in the distribution of age at death (Smits & Monden, Reference Smits and Monden2009). These measures differ from each other in some properties and the degree of their aversion to inequality. In the present study, life disparity was selected as a measure of the variation in death. Life disparity quantifies the average life expectancy losses attributable to death. Further, it covers the entire age spectrum, and has an important public health interpretation (Shkolnikov et al., Reference Shkolnikov, Andreev, Zhang, Oeppen and Vaupel2011). The life disparity measure has the property that it can be additively decomposed at any age such that the components before and after this age sum to the total life disparity.
The present study examines the trends and patterns of variation of deaths at early age in India and its states. The variation in death at early ages was measured using early life disparity, which was further decomposed into child and adult life disparity. This facilitated an assessment of the extent to which child and adult life disparity have served to drive the trends in early life disparity. The investigation will help gain an understanding of the contribution of child and adult mortality to interstate differences in life disparity.
Methods
The Sample Registration System (SRS), under the aegis of the Office of the Registrar General of India (RGI), is the primary and continuous source of data on mortality and life tables in India. Starting in 1970, the SRS provides age-specific death rates and abridged life tables. Data on age-specific death rates, along with the abridged life tables from 1970 to 2010 (ORG, 1984, 1985, 1989; RGI, 1994, 1996–2010, 1998), were used in this study.
The SRS is a dual record system that maintains a continuous recording of vital events from a nationally representative sample of villages and urban blocks. An independent six-monthly survey by a senior supervisor helps to update vital events and demographic particulars of the sample population. Events recorded in the two independent operations are scrutinized and matched for concurrence. Unmatched and partially matched events are verified in the field. The quality and accuracy of death statistics can be adversely affected by uneven completeness of death registration by age, and misreporting of age, which will eventually influence the calculated values for life expectancy and life disparity. Nevertheless, SRS data are considered the most reliable source of data for death statistics (Roy & Lahiri, Reference Roy and Lahiri1988; National Commission on Population, 2001; Mathers et al., Reference Mathers, Fat, Inoue, Rao and Lopez2005). Definitions of terms, administrative guidelines and data collection methods of the SRS have been consistent over time, thus allowing for comparisons between different time periods. The representative character of the SRS data enables estimation of vital statistics for the country and its larger states.
Bhat (Reference Bhat2002) pointed out that during 1971–1980, the death registration completeness in all the major states was around 95% for males as well as females, while reporting was more than 90% complete for males as well as females. Evaluation of the period 1990–1997 suggested no substantial change in the completeness of reporting of either births or deaths in the SRS. The SRS data are considered to be reliable as far as death registration for children and mid-life ages is concerned, but some data quality problems are present for older ages (Saikia et al., Reference Saikia, Jasilionis, Ram and Shkolnikov2011). As such, the impact of the quality of SRS data in the present study is likely to be minimal because early life disparity encompasses the death distribution of both child and adult age groups.
Saikia et al. (Reference Saikia, Singh and Ram2010) reported problems in the conversion of age-specific death rates into age-specific probabilities of dying at an early age (or within the lower age groups) for the 1996–2000 and 2001–2005 SRS life tables. Hence, for this study, life tables for the periods 1996–2000 to 2006–2010 have been reconstructed using Mortpak software. The age-specific death rates in the broad age groups (from 0–1, and 1–4 to 85 years and above) were available for each year. To calculate an age-specific death rate for the time periods 1996–2000, 2001–2005 and 2006–2010 for each age group, an average of the age-specific death rate was taken for each 5-year period, which was then used as the input for constructing abridged life tables.
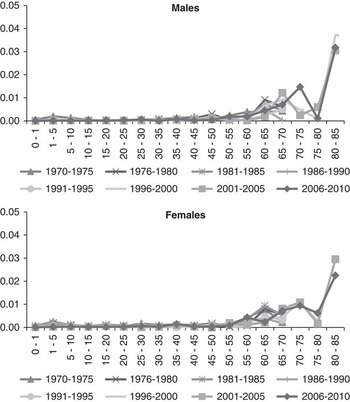
With the help of Mortpak, the abridged n q x values were transformed into single-year 1 q x values using the parametric technique of Heligman and Pollard (Reference Heligman and Pollard1980). Mortpak was effective in producing smooth results for these values. The age groups taken into consideration were 0–1, 1–5, 5–10 and so on, up to 85+ years, and the time periods included 1970–1975 to 2006–2010. In order to check the validity of the model-based estimates, the absolute error (abs (fitted n q x − observed n q x )) obtained from the observed n q x values of the abridged life tables, for specific age groups and time periods, and the fitted n q x values derived from the Heligman and Pollard model were calculated. The results demonstrated that there was a close correspondence between the observed and fitted values of n q x in the child and adult ages below 60. This was reflected by a very low magnitude of the absolute error for ages below 60. Greater absolute errors occurred at older ages, mainly after age 60 (Fig. 1).
Plot of absolute error in the n q x values by age for males and females in India, 1970–2010. Data sources: SRS Abridged Life Tables 1970–1975 to 1991–1995; SRS Statistical Report 1996–2010.

Complete life tables prepared for the period 1970–1975 to 2006–2010 were used for further estimation. Life disparity is defined as the average life years lost due to death or the average remaining life expectancy at the age when death occurs. Zhang and Vaupel (2008) and Shkolnikov et al. (Reference Shkolnikov, Andreev, Zhang, Oeppen and Vaupel2011) used the indicator in their studies. Early life disparity is defined as the average life years lost due to death by the age of 60 years.
The early life disparity in this study was estimated with the formula given below:
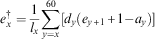 $$e_{x}^{\dag } ={1 \over {l_{x} }}\mathop \sum\limits_{y=x}^{60} [d_{y} (e_{{y{\plus}1}} {\plus}1{\minus}a_{y} )]$$
where l x =number of survivors at age x, d y =expected number of deaths in age interval [y, y+1), e y+1=average life expectancy at age y+1 and a y =average number of years lived in age interval [y, y+1).
The early life disparity was further decomposed into child life disparity (age 0–14 years) and adult life disparity (age 15–60 years). To estimate the age-specific contribution of the difference in life disparity, the decomposition method proposed by Shkolnikov and Andreev (Reference Shkolnikov and Andreev2010) was applied. The algorithm was initially developed by Andreev et al. (Reference Andreev, Shkolnikov and Begun2002) for the decomposition of differences between aggregate demographic measures and applied to analyse changes in life expectancy, healthy life expectancy, parity progression ratio and total fertility rate. Shkolnikov and Andreev (Reference Shkolnikov and Andreev2010) developed an Excel spreadsheet that allows execution of age decompositions for any type of life-table-based quantity in Excel using a VBA program.
Results
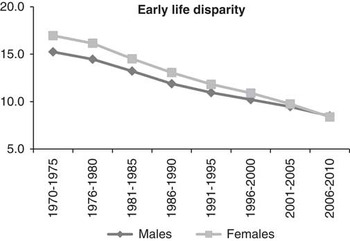
Figure 2 shows a declining trend in early life disparity in India over time. Both males and females exhibited this trend. However, differences were observed in the magnitude of decline. The early life disparity for males reduced from 15.2 years in 1970–1975 to 8.5 years in 2006–2010; for females, the disparity reduced from 16.9 years to 8.4 years for the same period. Rapid decline in early life disparity for females contributed to a reduction in the male–female gap in early life disparity over time. The male–female difference in early life disparity was reduced from 1.7 years in 1970–1975 to 0.1 year in 2006–2010.
Trends in early life disparity (in years) in India by sex, 1970–2010. Data sources: SRS Abridged Life Tables 1970–1975 to 1991–1995; SRS Statistical Report 1996–2010.

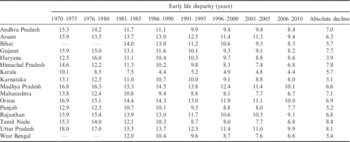
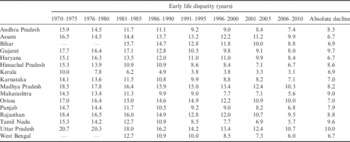
A similar downward trend was observed across all the constituent states of India. It is evident from Tables 1 and 2 that early life disparity was significantly lower in 2006–2010 in every Indian state when compared with values in 1970–1975; the rate of decline was greater between 1970–1975 and 1986–1990 when compared with later and more recent observations. In many states, the decline was slow during 1991–1995 to 2001–2005 and moderate from 2001–2005 to 2006–2010. For males, the highest absolute decrease from 1970–1975 to 2006–2010 was observed in Tamil Nadu (8.4 years), followed by Uttar Pradesh (8.1 years), Himachal Pradesh (7.8 years) and Gujarat (7.7 years). The absolute decline was lowest in Haryana (3.9 years). In the case of females, the reduction in early life disparity was highest in Uttar Pradesh (10.0 years), followed by Gujarat (9.7 years) and Tamil Nadu (9.6 years). The least decrease was noted in Assam (6.7 years). The states with higher early life disparity during the period 1970–1975 and 2006–2010 were Orissa, Madhya Pradesh and Uttar Pradesh. It was also seen that early life disparity in Kerala was lowest among all the states irrespective of time and sex. Kerala also had the highest life expectancy at birth among all the states. This result supports the hypothesis that populations with a higher life expectancy have lower life disparity (Vaupel et al., Reference Vaupel, Zhang and Van Raalte2011). The correlation coefficient between life disparity and life expectancy at birth for all major states in India is 0.9 (Singh & Ladusingh, Reference Singh and Ladusingh2013).
Trends in early life disparity among males in major states of India, 1970–2010

Trends in early life disparity (in years) among females in major states of India, 1970–2010

The interstate variation (or variation among states) in early life disparity has come down in India. The gap between the highest and lowest state-wise values was seen to descend from 7.9 years to 5.7 years for males, and from 10.7 years to 7.6 years for females during 1970–1975 to 2006–2010. These results support the convergence phenomenon observed for the other mortality indicators in India (Chaurasia, Reference Chaurasia2010; Saikia et al., Reference Saikia, Jasilionis, Ram and Shkolnikov2011). However, the pace at which this gap has been reduced has been slow compared with other mortality indicators.
The male–female difference in early life disparity was negative for all states from 1970–1975 to 1986–1990, except for Kerala. From 1991–1995 onwards, this difference shifted towards the positive in many states, with early life disparity for females being significantly lower than that for the male equivalent. This transition may be attributed to two important factors: first, the rate of decline in early life disparity was extremely slow from 1991–1995 to 2001–2005, with males following a much slower pace; second, there was a remarkable reduction in early life disparity for females in all states from 2001–2005 to 2006–2010.
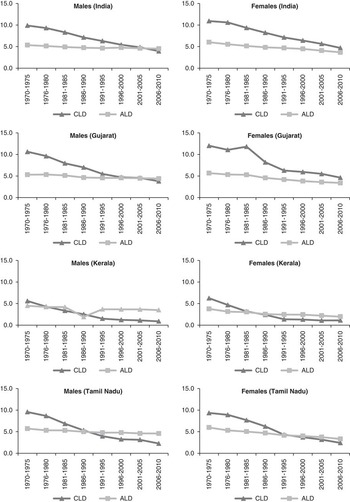
Early life disparity was decomposed into child life disparity (0–14 years) and adult life disparity (15–60 years) in order to ascertain whether the decline was uniform for both age groups. To fulfil this objective, states exhibiting a substantial downward trend in early life disparity from 1970–1975 to 2006–2010 were selected, i.e. Gujarat, Tamil Nadu and Uttar Pradesh. Kerala was also included because it showed the lowest early life disparity across every time period. Figure 3 depicts the trend in child and adult life disparity in India and four major states from 1970–1975 to 2006–2010. Child life disparity had come down in India as well as in individual states irrespective of the mortality condition of the state. The child life disparity for males in India declined from 9.9 years in 1970–1975 to 4.0 years in 2006–2010; adult life disparity reduced from 5.4 years to 4.5 years during the same period. Female child life disparity has declined from 10.9 years to 4.7 years and adult life disparity from 6.0 to 3.7 years. The absolute decline in child and adult life disparity was higher for females than for males.
Trends in child life disparity (CLD) and adult life disparity (ALD) (in years) in India and selected major states by sex, 1970–2010. Data sources: SRS Abridged Life Tables 1970–1975 to 1991–1995; SRS Statistical Report 1996–2010.

The pace of decline in child life disparity was more pronounced in the 1970s and 1980s whereas a slowdown was noticed in the 1990s. Further, the pace of decline during the period 2001–2005 to 2006–2010 was somewhat similar to the pace observed during the 1970s and the 1980s. This may be linked to a significant reduction in child mortality in India between 2005 and 2010 (RGI, 2005, 2010). The lowering of child life disparity was comparable both in the states with high and low life expectancy. Child life disparity declined by more than 6 years in all four states (Uttar Pradesh, Gujarat, Kerala and Tamil Nadu). However, child life disparity in Uttar Pradesh was higher than that in the other three states. This higher disparity can be attributed to higher levels of child mortality in Uttar Pradesh. From the graphs, it is evident that a reduction in early life disparity is the result of a marked decrease in child life disparity. These findings remain identical for India as well as for the major states.
Adult life disparity remained more or less stagnant among males from 1970–1975 to 2006–2010, and decelerated sharply for females in all four states. Reduction in adult life disparity of females occurred much faster than for males during the period 2001–2005 to 2006–2010. The decline in adult life disparity from 1970–1975 to 2006–2010 was approximately 1 year for males and 2 years for females in each state. In Uttar Pradesh, adult life disparity among males came down by 0.5 year and among females by 2.2 years from 1970–1975 to 2006–2010. A possible explanation could be the significant fall in maternal mortality rate in Uttar Pradesh (RGI, 2006). In Kerala, child life disparity in 2006–2010 was reduced to just 0.9 year for males and 1.1 years for females. Adult life disparity was the major component of early life disparity in Kerala, with adult life disparity among males being higher than that for females in this state.
The crossover in child and adult life disparity occurred in India as well as in individual states, including states with a higher life expectancy such as Kerala. In India, the crossover of child and adult life disparity occurred in 2001–2005. For females, the gap between child and adult life disparity was reduced to a great extent and the child life disparity was approximately one year higher than adult life disparity in 2006–2010. This crossover occurred in the 1980s in Kerala and in 2001–2005 for males in Gujarat. Crossover occurred earlier for the male population in Tamil Nadu and Kerala than for the female population of the respective states. This delay in females can be attributed to a consistent downward trend in adult life disparity for females. In 2006–2010, adult life disparity in Tamil Nadu, Gujarat and Kerala was higher than child life disparity. In Uttar Pradesh, child life disparity continued to be higher than adult disparity.
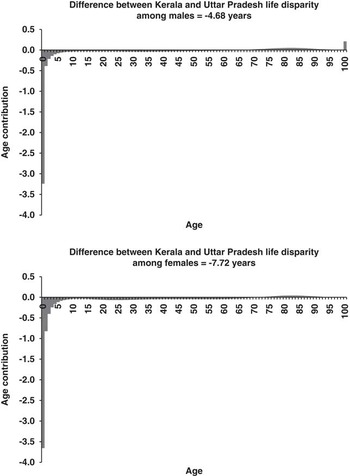
An analysis was also performed to examine the role of premature deaths in the differences between the maximum disparity state and least disparity state during the period 2006–2010. To understand which age has actually contributed to this difference, the figures for difference in life disparity for two states, viz. Kerala and Uttar Pradesh, were further decomposed. These states were chosen because, among all the major states, the highest life disparity during the period 2006–2010 was observed in Uttar Pradesh and the lowest in Kerala. Decomposition analysis showed that the difference in life disparity between 2006 and 2010 was due to the difference in child mortality below age 15 (Fig. 4). The maximum contribution was from mortality values below age 5. The contribution of the ages 0–14 years was much higher than the component produced by ages 15–60 years. The relative contribution of the middle-aged group was higher among females. This impact was mainly because of the considerable interstate differences in maternal mortality levels.
Decomposition of the difference between life disparity of Kerala and Uttar Pradesh among males and females in India from 1970–1975 to 2006–2010. Data sources: SRS Abridged Life Tables 1970–1975; SRS Statistical Report 2006–2010.

Discussion
This study was a systematic effort to assess lifespan disparity in early age using the life table distribution of deaths by age, within the range of ages 0 to 60. This age group is important for two reasons. First, health care expenditure in India is prioritized to reduce deaths in this age group (WHO, 2008). Second, the working age group (15–60 years) is especially important for the country’s economic progress and development.
Results from the present study gave valuable insight into changes in early life disparity in India over the past four decades. The findings suggest that early life disparity has reduced significantly. It is also clear that there is a definite interrelation between improvement in life expectancy at birth in India and decline in early life disparity. Further, the observations point to the fact that the relationship between life expectancy and life disparity is negative in both developed (Vaupel et al., Reference Vaupel, Zhang and Van Raalte2011) and developing countries (Singh & Ladusingh, Reference Singh and Ladusingh2013). The rate of decline in early life disparity has been rapid among females in India, which further reinforces the fact that averting of premature deaths in child and adult age groups has occurred faster for females than for males. It can be attributed to the significant decline in child and adult mortality among females and a faster mortality transition from the 1970s until the recent decade (Rajanatnam et al., Reference Rajaratnam, Marcus, Levin-Rector, Chalupka, Wang and Dwyer2010; Chaurasia, Reference Chaurasia2010). The slowdown in the decline of early life disparity among males could be related to mortality of males in the adult age group, because child mortality rate fell continuously for males, even during recent times. The literature also suggests that the female advantage is not often restricted to the mean length of life. Such an advantage is also observed in dispersion measures of age at death. The variation in the distribution of deaths for females is low and suggests a lower level of uncertainty concerning female lifespan (Edwards & Tuljapurkar, Reference Edwards and Tuljapurkar2005).
Analyses of early life disparity have largely examined differences between countries, and have been less focused on variations within the country (Van Raalte et al., Reference Van Raalte, Martikainen and Myrskyla2014). State-level analyses illustrate regional trends and patterns of decrease in early life disparity. The present study throws light on the differentials in early life disparity within India. Kerala had the lowest early life disparity among the Indian states. Early life disparity in Kerala for the recent period compares well with that of developed countries. The improvement in other mortality indicators, such as the probability of survival to age 70 and life expectancy at birth, follows a steep trajectory indicating a faster rate of change in Kerala (Chaurasia, Reference Chaurasia2010). Significant reduction in early life disparity was also observed in Gujarat and Tamil Nadu. More detailed analysis showed that a rapid reduction in child life disparity prompted a speedier descent in early life disparity in these two states. In another study (Chaurasia, Reference Chaurasia2010), it was observed that Tamil Nadu, Gujarat and Uttar Pradesh experienced the fastest reduction in life table entropy. This implies that the pace with which the deaths were shifted to higher ages was faster in these states. Haryana and Punjab are the states where the decline in early life disparity has been much slower than that in other states, in spite of the low mortality in both states (Chaurasia, Reference Chaurasia2010; Saikia et al., Reference Saikia, Jasilionis, Ram and Shkolnikov2011). A comparison of findings from a study of two wealthy nations – England & Wales and the United States – shows that life expectancy was about the same in both countries, but life disparity in the United States was much greater than in England & Wales. Mortality related to non-communicable health risk factors is cited as the primary reason for the disparity in the United States (Shkolnikov et al., Reference Shkolnikov, Andreev, Zhang, Oeppen and Vaupel2011). In India, the higher burden of health risk factors is often linked to the stagnating mortality rate. Though Haryana and Punjab are among the richest states in India (Indrayan et al., Reference Indrayan, Wysocki, Chawla, Kumar and Singh1999), the results show that increasing income alone is not enough to reduce death inequality.
The study shows that interstate variation in early life disparity has declined in India. However, the pace of decline has been much slower than that for the other mortality indicators in the country. Prevention of premature deaths leads to an increase in not only the mean length of life (Chaurasia, Reference Chaurasia2010), but also in variation measures such as life disparity and standard deviation above age 10 (Edwards & Tuljapurkar, Reference Edwards and Tuljapurkar2005; Shkolnikov et al., Reference Shkolnikov, Andreev, Zhang, Oeppen and Vaupel2011; Vaupel et al., Reference Vaupel, Zhang and Van Raalte2011). This is a well-accepted fact in a developed country setting. However, closer study of the differentials for developed countries suggests that the adult mortality rather than child mortality is responsible for the differentials in lifespan variations between developed countries (Shkolnikov et al., Reference Shkolnikov, Andreev, Zhang, Oeppen and Vaupel2011). In India, child mortality is mainly responsible for the interstate differences in life disparity. Decomposition analysis clearly indicates that the differences in life disparity between states in 2006–2010 are mainly due to death at early age (0–10 years). This can be reiterated by the fact that India lags behind in general and under-five mortality reduction, and consequently will be unable to reach the Millennium Development Goal target for under-five mortality lower than 39 per 100,000 live births by 2015. Regarding under-five mortality, the pace of progress in India is slower than that of neighbouring countries. The difference in the under-five mortality rates between rich and poor states in India is equally alarming (Jha & Laxminarayan, Reference Jha and Laxminarayan2009; NIMS et al., 2012; Ram et al., Reference Ram, Jha, Ram, Kumar, Awasthi and Shet2013). There is urgent need for additional, continuous effort by the government to reduce child mortality. This would help to reduce the interstate differentials in life expectancy and life disparity in India.
On a positive note, the present study also showed that the decline in child life disparity is mainly responsible for the decline of early life disparity in India. However, it is of concern to note the stagnation of adult life disparity in the country, which is a condition that most Western countries achieved in the 1960s despite continued improvements in longevity (Shkolnikov et al., Reference Shkolnikov, Andreev and Begun2003; Smits & Monden, Reference Smits and Monden2009). The decline was steeper among females. The decline in maternal mortality (RGI, 2006) could be the reason behind the marginal decline in adult life disparity among females. Further, state-wise trends also suggest a slow rate of decline in premature deaths among adult males. These results can be substantiated with evidence from studies that have expressed concern over the higher levels of adult male mortality in India. In recent decades, male adult mortality has exceeded the female level (Subramanian et al., Reference Subramanian, Shailen, Irving, Gordon, Lambert and Smith2006; Rajaratnam et al., Reference Rajaratnam, Marcus, Levin-Rector, Chalupka, Wang and Dwyer2010). The state-wise trends and figures for recent decades confirm this result for the major states (Saikia et al., Reference Saikia, Singh and Ram2013). Further decline in early life disparity among males is possible only with a decrease in young working age mortality. Another important aspect is the crossover of child and adult life disparity in states with higher life expectancy. Further, the timing of the crossover by states implies that after attainment of a certain level of life expectancy, the level of child life disparity goes below that of adult life disparity.
Overall, this study advocates the view that increasing longevity and declining life disparity in India is achieved by reducing premature deaths. However, further aversion of child deaths is necessary to reduce the inequalities in deaths across the states and population subgroups in India. The pace of decline in adult life disparity has stagnated in recent decades, which has important economic and social implications. Early life disparity measures the uncertainty in the timing of death in childhood and working age groups, these categories being the most productive age groups, whose members make important contributions to the country’s economy. A reduction in disparity would help increase the value of both private and public investments in education and training, promote a healthy lifestyle, and influence life-planning decisions such as post-retirement strategies.