Introduction
Depression is the most common mental health problem among older adults (Buchanan et al., Reference Buchanan2006), affecting between 1% and 5% of people aged 65 years and older (Fiske et al., Reference Fiske, Wetherell and Gatz2009). The strongest predictors of depressive mood in older populations identified in a literature review were female gender, greater number of chronic illnesses, presence of cognitive and functional impairments, weak social ties (i.e. social contacts, social support, social isolation, social activities), prior history of depression, use of depression medication, presence of stressful life events, widowhood, housing in institutional care, low income, and low educational levels (Djernes, Reference Djernes2006).
Psychological and pharmacological models of depression have provided keen insights as to the etiology of depression, and both approaches have led to effective treatments of late-life depression (for psychotherapy, see Cuijpers et al., Reference Cuijpers, van Straten and Smit2006; for pharmacotherapy, see Petrovic et al., Reference Petrovic, De Paepe and Van Bortel2005). However, depression is a complex disorder, and a substantial number of individuals report little or no benefit from treatment. For example, the response rate to antidepressants in older populations is about 50% (Mittmann et al., Reference Mittmann1997). Additional parameters are needed to understand the determinants of depressive mood more completely. One interesting avenue is to investigate the role of neighborhood characteristics in eliciting and reducing depressive mood. Identification of associations between neighborhood characteristics and depressive mood (and of mechanisms underlying these associations) could shed new light on environmental intervention strategies to promote older adults’ mental health. Intervening at a neighborhood level could potentially reach a greater number of individuals in contrast to psychological and pharmacological treatments, which are delivered on a one-to-one or small group basis.
According to Galster (Reference Galster2001), neighborhood can be defined as “the bundle of spatially based attributes associated with a cluster of residences, sometimes in conjunction with other land uses,” and is characterized by ten attributes: (i) residential and non-residential non-structural elements (type, materials, state of built environment); (ii) infrastructure characteristics (roads, sidewalks, services); (iii) demographic characteristics of the population (elderly concentration, racial composition, religious affiliations, families); (iv) socioeconomic characteristics of the population (income, labor, education); (v) characteristics of public services (schools, public security, administration, parks); (vi) environmental characteristics (noise, pollution, elements of the topography); (vii) proximity characteristics (access to commercial or cultural services); (viii) political characteristics (mobilization of elected officials); (ix) social-interactive characteristics (social networks, relationships among residents); and (x) emotional characteristics (sense of belonging to the neighborhood).
Glass and Balfour (Reference Glass, Balfour, Kawachi and Berkman2003) proposed a model of neighborhood effects on aging. According to these authors, neighborhood characteristics lead to buoying (i.e. supportive) or pressing (i.e. detrimental) environments. These environments interact with personal competencies resulting in adaptive or maladaptive responses that can affect health and functioning. For example, living in a non-walking-friendly neighborhood (pressing environment) may lead to physical passivity and social isolation (maladaptive responses) among people with poorer coping skills or physical disability (personal competencies), which in turn could result in muscle atrophy and sadness (health and functioning).
There is growing evidence that neighborhood environments are related to depressive mood in the general population (Kim, Reference Kim2008; Mair et al., Reference Mair, Roux and Galea2008; Paczkowski and Galea, Reference Paczkowski and Galea2010). Older adults may be even more vulnerable to neighborhood factors than other adults (Glass and Balfour, Reference Glass, Balfour, Kawachi and Berkman2003; Schieman and Meersman, Reference Schieman and Meersman2004; Walters et al., Reference Walters2004; Beard et al., Reference Beard2009; Yen et al., Reference Yen, Michael and Perdue2009) for several reasons. First, a decline in physical and cognitive competencies decreases the capacity of older people to cope with stressors in their environment (Glass and Balfour, Reference Glass, Balfour, Kawachi and Berkman2003). Second, elderly people may feel more vulnerable in neighborhoods bearing specific characteristics such as greater crime rates (e.g. Whitley and Prince, Reference Whitley and Prince2005). Third, a decrease in social support attributed to death of close ones or children moving out of town may force older people to rely on community resources for social contacts (Glass and Balfour, Reference Glass, Balfour, Kawachi and Berkman2003). Fourth, older adults may have been exposed for longer periods of times to deleterious neighborhoods than younger adults (Elreedy et al., Reference Elreedy1999), resulting in greater distress coupled with a lower sense of control than younger counterparts. Finally, because of retirement and decreased mobility, the life of older people may be more restricted to their immediate residential neighborhood than younger adults involved in many spheres (i.e. work, community, recreational; Lawton, Reference Lawton, Birren and Schaie1977).
Empirical findings on the relationships between neighborhood variables and depressive mood among older adults have thus far been equivocal with some studies showing associations and others not. The aim of this paper was therefore to review empirical findings on the relationships between neighborhood characteristics and depressive mood among older adults. We add to the literature by examining three interrelated aspects. First, methodological issues are identified and discussed. Then, the conceptualization and operationalization of neighborhood constructs are examined. Finally, associations between neighborhood variables and depressive mood are reviewed in light of their theoretical coherence and degree to which results are replicated in the literature.
Methods
A search of the literature was conducted in PsycINFO and MEDLINE databases on studies published between 1 January 1967 and 13 July 2011, using combinations of keyword terms listed in Appendix 1. Titles and abstracts of the retrieved articles were then screened to select studies that met the following inclusion criteria: (i) studies conducted on samples of participants aged 65 years and older; (ii) studies providing significance tests for neighborhood variables at a multivariate level; (iii) availability of depressive mood as an outcome measure; and (iv) studies published in French or English. In addition, studies were excluded if they were limited to simply distinguishing participants as living in either urban or rural areas as this variable appeared too broad as an operationalization of the pressor/buoy concept or if they were unpublished masters theses or doctoral dissertations. Regarding neighborhood social capital variables, studies were included if they measured participants’ perception of how neighbors interact with each other (which can be considered as a neighborhood social capital variable). Studies where neighborhood variables were covariates and not main exposures were included in this review as long as data were available for neighborhood variables in the final models; these neighborhood variables are, however, treated as main exposures in this review, and non-neighborhood main exposures as covariates. In case of ambiguity as to whether or not these criteria were met, studies were retained for further review. Additional references were identified through examination of reference lists of the selected articles and from past readings of authors. A summary table of relevant articles was constructed and a narrative description and analysis of the methods and findings of studies was performed.
Results
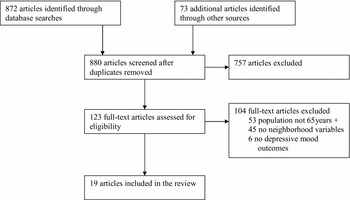
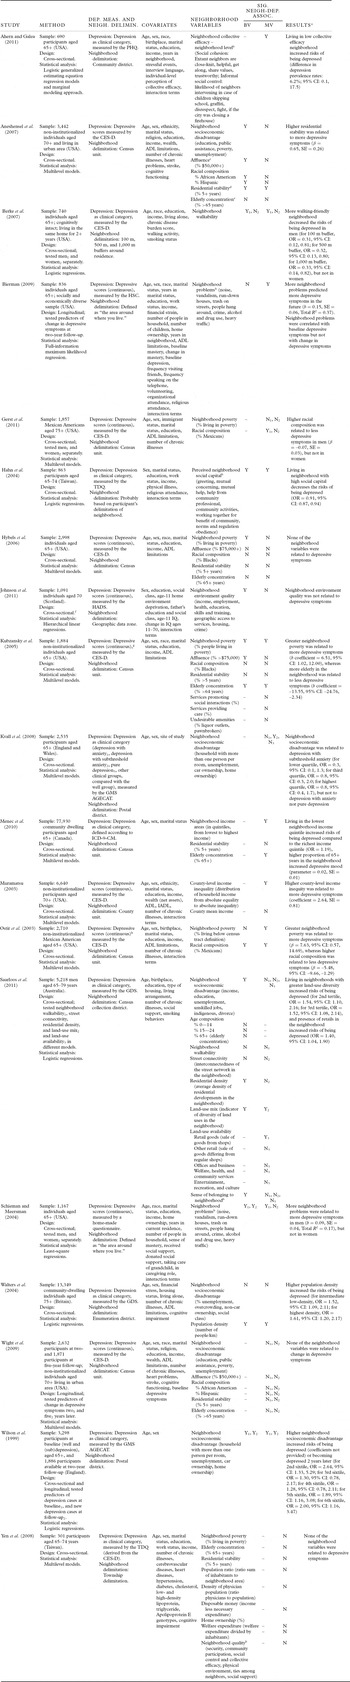
A flow chart of articles is presented in Figure 1. The electronic database searches allowed for retrieval of 297 articles from PsycINFO and 595 articles from MEDLINE. Seventy-three additional articles were identified through examination of reference lists and past readings of authors. Overall, 123 full-text articles were assessed for eligibility. In total, 19 articles satisfied the above-mentioned criteria and were included in the review. Studies that were included in this review are summarized in Table 1. The table presents the methodology used in the studies (description of respondents, study design, and statistical analysis strategy), depressive mood outcome measure and neighborhood delimitation, the potential confounding variables, a brief description of the neighborhood variables, the significant associations between neighborhood variables and depressive mood at bivariate and multivariate levels, and the direction of the multivariate associations.
Flow chart of articles through the identification and selection process.
Note: The criteria to screen full-text articles were (sequentially): the age of the sample, presence of neighborhood variable(s), and presence of a depressive mood outcome. When an article did not meet a first criterion, it was excluded and not screened for other criteria.

Summary of 19 studies investigating associations between neighborhood characteristics and depressive mood among adults aged 65 years or older

a Results of the final model are presented.
b Self-reported measure.
c Proportion of people with high income in the neighborhood.
d Proportion of individuals in the neighborhood who have lived in their household for a certain period of time.
e Proportion of individuals in older age range in the neighborhood.
f Although this study used a measure of intelligence at age 11, depression and neighborhood variables were measured at a cross-sectional level; therefore, the study was considered as having a cross-sectional design.
g Authors report similar but attenuated results for depression as a clinical category.
h Depression as a clinical category was also investigated, but for greater clarity, these results are not reported here.
Note: When studies included participants less than 65 years old, results from participants aged 65+ years were isolated and are reported in this table. For the multivariate analyses, results of the final model are summarized. Subscript numbers under the Significant Neighborhood-Depression Associations heading refer to the subscript sample or time of measurement numbers under the Method or Depression Measures and Neighborhood Delimination headings.
DEP. MEAS. AND NEIGH. DELIMIN. = Depression measures and neighborhood delimination; SIG. NEIGH-DEP. ASSOC. = Significant neighborhood-depression associations; BV = Bivariate associations; MV = Multivariate associations; PHQ = Patient Health Questionnaire; Y = Yes; CI = Confidence interval; CES-D = Center for Epidemiologic Studies-Depression scale; ADL = Activities of daily living; N = No; SE = Standard error; OR = Odds ratio; HSC = Hopkins Symptoms Checklist; TDQ: Taiwanese Depression Questionnaire; HADS = Hospital Anxiety and Depression Scale; IQ = Intelligence quotient; GMS AGECAT = Geriatric Mental State and the Automated Geriatric Examination for Computer-Assisted Taxonomy; ICD-9-CM = Internal Classification of Disease, Clinical Modification; IADL = Instrumental activities of daily living; GDS = Geriatric Depression Scale.
Quality of designs
Samples
The sample sizes of the studies were generally large, with a mean sample size of 6,378 participants (range: 301 to 77,930). Most of the studies (11 out of 19) were conducted in the USA (Muramatsu, Reference Muramatsu2003; Ostir et al., Reference Ostir, Eschbach, Markides and Goodwin2003; Schieman and Meersman, Reference Schieman and Meersman2004; Kubzansky et al., Reference Kubzansky2005; Hybels et al., Reference Hybels2006; Aneshensel et al., Reference Aneshensel2007; Berke et al., Reference Berke, Gottlieb, Moudon and Larson2007; Bierman, Reference Bierman2009; Wight et al., Reference Wight, Cummings, Karlamangla and Aneshensel2009; Ahern and Galea, Reference Ahern and Galea2011; Gerst et al., Reference Gerst2011).
Depressive mood measures
Ten studies investigated depressive mood on a continuum (Muramatsu, Reference Muramatsu2003; Ostir et al., Reference Ostir, Eschbach, Markides and Goodwin2003; Schieman and Meersman, Reference Schieman and Meersman2004; Kubzansky et al., Reference Kubzansky2005; Hybels et al., Reference Hybels2006; Aneshensel et al., Reference Aneshensel2007; Bierman, Reference Bierman2009; Wight et al., Reference Wight, Cummings, Karlamangla and Aneshensel2009; Gerst et al., Reference Gerst2011; Johnson et al., Reference Johnson, Corley, Starr and Deary2011) whereas nine studies examined it as a dichotomous variable (possible clinical depression vs. non-depressed; Wilson et al., Reference Wilson, Chen, Taylor, McCracken and Copeland1999; Hahn et al., Reference Hahn, Yang, Yang, Shih and Lo2004; Walters et al., Reference Walters2004; Berke et al., Reference Berke, Gottlieb, Moudon and Larson2007; Kvaal et al., Reference Kvaal2008; Yen et al., Reference Yen, Rebok, Yang and Lung2008; Menec et al., Reference Menec, Shooshtari, Nowicki and Fournier2010; Ahern and Galea, Reference Ahern and Galea2011; Saarloos et al., Reference Saarloos, Alfonso, Giles-Corti, Middleton and Almeida2011). Depressive mood was assessed by eight questionnaires: the Center for Epidemiologic Studies-Depression scale (CES-D; Radloff, Reference Radloff1977), the Geriatric Depression Scale (GDS; Yesavage et al., Reference Yesavage1983), the Patient Health Questionnaire (PHQ; Spitzer et al., Reference Spitzer, Kroenke and Williams1999), the Hopkins Symptoms Checklist (HSC; Derogatis et al., Reference Derogatis, Lipman, Rickels, Uhlenhuth and Covi1974), the Hospital Anxiety and Depression Scale (HADS; Zigmond and Snaith, Reference Zigmond and Snaith1983), the Geriatric Mental State and the Automated Geriatric Examination for Computer-Assisted Taxonomy (GMS AGECAT; Copeland et al., Reference Copeland, Dewey and Griffiths-Jones1986), a home-made questionnaire, and the Taiwanese Depression Questionnaire (TDQ, a questionnaire derived from the CES-D; Lee et al., Reference Lee, Yang, Lai, Chiu and Chau2000). In addition to these questionnaires, the ICD-9-CM diagnosis criteria were also used in one study (Menec et al., Reference Menec, Shooshtari, Nowicki and Fournier2010). The CES-D was by far the most commonly used questionnaire, being included in eight studies (Muramatsu, Reference Muramatsu2003; Ostir et al., Reference Ostir, Eschbach, Markides and Goodwin2003; Kubzansky et al., Reference Kubzansky2005; Hybels et al., Reference Hybels2006; Aneshensel et al., Reference Aneshensel2007; Berke et al., Reference Berke, Gottlieb, Moudon and Larson2007; Wight et al., Reference Wight, Cummings, Karlamangla and Aneshensel2009; Gerst et al., Reference Gerst2011).
Design
Sixteen studies had a cross-sectional design (Muramatsu, Reference Muramatsu2003; Ostir et al., Reference Ostir, Eschbach, Markides and Goodwin2003; Hahn et al., Reference Hahn, Yang, Yang, Shih and Lo2004; Schieman and Meersman, Reference Schieman and Meersman2004; Walters et al., Reference Walters2004; Kubzansky et al., Reference Kubzansky2005; Hybels et al., Reference Hybels2006; Aneshensel et al., Reference Aneshensel2007; Berke et al., Reference Berke, Gottlieb, Moudon and Larson2007; Kvaal et al., Reference Kvaal2008; Yen et al., Reference Yen, Rebok, Yang and Lung2008; Menec et al., Reference Menec, Shooshtari, Nowicki and Fournier2010; Ahern and Galea, Reference Ahern and Galea2011; Gerst et al., Reference Gerst2011; Johnson et al., Reference Johnson, Corley, Starr and Deary2011; Saarloos et al., Reference Saarloos, Alfonso, Giles-Corti, Middleton and Almeida2011), two had a longitudinal design (Bierman, Reference Bierman2009; Wight et al., Reference Wight, Cummings, Karlamangla and Aneshensel2009), and one had both cross-sectional and longitudinal designs embedded (Wilson et al., Reference Wilson, Chen, Taylor, McCracken and Copeland1999).
Statistical analysis strategies
The statistical analysis strategies used were either regression analyses, which were used in nine studies (Wilson et al., Reference Wilson, Chen, Taylor, McCracken and Copeland1999; Hahn et al., Reference Hahn, Yang, Yang, Shih and Lo2004; Schieman and Meersman, Reference Schieman and Meersman2004; Walters et al., Reference Walters2004; Berke et al., Reference Berke, Gottlieb, Moudon and Larson2007; Bierman, Reference Bierman2009; Ahern and Galea, Reference Ahern and Galea2011; Johnson et al., Reference Johnson, Corley, Starr and Deary2011; Saarloos et al., Reference Saarloos, Alfonso, Giles-Corti, Middleton and Almeida2011), or multilevel models, which were used in ten studies (Ostir et al., Reference Ostir, Eschbach, Markides and Goodwin2003; Walters et al., Reference Walters2004; Kubzansky et al., Reference Kubzansky2005; Hybels et al., Reference Hybels2006; Aneshensel et al., Reference Aneshensel2007; Kvaal et al., Reference Kvaal2008; Yen et al., Reference Yen, Rebok, Yang and Lung2008; Wight et al., Reference Wight, Cummings, Karlamangla and Aneshensel2009; Menec et al., Reference Menec, Shooshtari, Nowicki and Fournier2010; Gerst et al., Reference Gerst2011). Multilevel models are more complex statistical analyses that account for the fact that people living in the same neighborhood may be more similar than those living in different neighborhoods (thereby accounting for violations of the independence of measures assumption). Our review did not reveal any studies investigating mediating effects in the relationships between neighborhood variables and depressive mood using structural equation modeling or other statistical methods.
Conceptualization and operationalization of the neighborhood construct
Spatial delimitations of neighborhood of residence were based on three sources: (i) administrative or statistical boundary (census units or districts, geographic data zone, postal district, county unit, enumeration district, township unit, or community district), used in 15 studies (Wilson et al., Reference Wilson, Chen, Taylor, McCracken and Copeland1999; Muramatsu, Reference Muramatsu2003; Ostir et al., Reference Ostir, Eschbach, Markides and Goodwin2003; Walters et al., Reference Walters2004; Kubzansky et al., Reference Kubzansky2005; Hybels et al., Reference Hybels2006; Aneshensel et al., Reference Aneshensel2007; Kvaal et al., Reference Kvaal2008; Yen et al., Reference Yen, Rebok, Yang and Lung2008; Wight et al., Reference Wight, Cummings, Karlamangla and Aneshensel2009; Menec et al., Reference Menec, Shooshtari, Nowicki and Fournier2010; Ahern and Galea, Reference Ahern and Galea2011; Gerst et al., Reference Gerst2011; Johnson et al., Reference Johnson, Corley, Starr and Deary2011; Saarloos et al., Reference Saarloos, Alfonso, Giles-Corti, Middleton and Almeida2011); (ii) local areas defined by residence-centered buffers (circular boundaries around each participant's address), used in one study (Berke et al., Reference Berke, Gottlieb, Moudon and Larson2007); and (iii) self-reported subjective delimitations of neighborhood, used in three studies (Hahn et al., Reference Hahn, Yang, Yang, Shih and Lo2004; Schieman and Meersman, Reference Schieman and Meersman2004; Bierman, Reference Bierman2009).
Six neighborhood characteristics were most often evaluated in the studies: neighborhood socioeconomic disadvantage, neighborhood poverty, affluence, racial/ethnic composition, residential stability, and elderly concentration. Neighborhood socioeconomic disadvantage is an aggregate of dimensions such as educational level, poverty, unemployment, or home ownership in the neighborhood. Related to this indicator is neighborhood poverty, the proportion of individuals or family living in poverty (most often according to census tract boundaries). In contrast to these two parameters, neighborhood affluence measures the proportion of individuals or families with high income in the neighborhood. Racial/ethnic composition pertains to the proportion of immigrants in the neighborhood (e.g. proportion of Hispanics, Mexicans). Residential stability refers to the proportion of individuals in the neighborhood who have lived in their household for a certain period of time (e.g. at least five years). Finally, elderly concentration represents the proportion of individuals in an older age range in the neighborhood.
The vast majority of neighborhood parameters depicted in Table 1 were drawn from government organizations (e.g. percentage of people living in poverty in the neighborhood). In contrast, five self-reported neighborhood variables were identified in the studies and represent participants’ perception of their neighborhood (either at the individual or neighborhood levels). These variables were neighborhood collective efficacy, neighborhood problems (e.g. noise, vandalism, trash on streets, crime rate), neighborhood social capital, sense of belonging to the neighborhood, and neighborhood quality (e.g. satisfaction with physical environment, community participation, social support).
Associations between neighborhood and depressive mood
Empirical findings
In bivariate associations (unadjusted correlations, analyses of variance, or simple regressions), 58% of the tested neighborhood variables (22 out of 38) showed significant associations with depressive mood. The associations between neighborhood variables and depressive mood were attenuated when adjusting for individual variables: 42% of the neighborhood variables that were statistically significant at a bivariate level (11 out of 26) remained statistically significant at a multivariate level when controlling for individual factors. (Note that this percentage is based on 26 associations instead of the 22 noted above because two studies tested more than one multivariate model.) Overall, around 25% of the neighborhood indicators (20 out of 81) were significant predictors of depressive mood after adjusting for individual-level variables. The 95% confidence intervals (95% CI) for neighborhood variables were sometimes large (Ostir et al., Reference Ostir, Eschbach, Markides and Goodwin2003; Kubzansky et al., Reference Kubzansky2005; Ahern and Galea, Reference Ahern and Galea2011). The proportion of variance explained in depressive mood in the final models involving significant neighborhood predictors was reported in only two studies: for Bierman (Reference Bierman2009), R 2 = 0.37; and for Schieman and Meersman (Reference Schieman and Meersman2004), R 2 = 0.17. However, the magnitude of neighborhood effects (i.e. the unique contribution of neighborhood variables independent of individual characteristics) in the variance explained was not reported in either of these studies.
The individual variables that were controlled for often included sex, education, income, chronic illnesses, and functional limitations. Other individual covariates were, however, less often controlled for: social variables, prior history of depression, use of depression medication, stressful life events, and housing in institutional care.
Congruence of associations between neighborhood variables and depressive mood
Neighborhood variables and depressive mood were generally associated in a conceptually meaningful way in the final models (adjusted for individual characteristics): variables that represented pressors were linked to higher levels of depression whereas variables akin to buoys were associated with lower levels of depression. That is, as shown in Table 1, greater neighborhood socioeconomic disadvantage (Wilson et al., Reference Wilson, Chen, Taylor, McCracken and Copeland1999), greater neighborhood poverty (Ostir et al., Reference Ostir, Eschbach, Markides and Goodwin2003; Kubzansky et al., Reference Kubzansky2005) or living in neighborhood poorest areas (Menec et al., Reference Menec, Shooshtari, Nowicki and Fournier2010), higher population density (Walters et al., Reference Walters2004), higher degree of perceived neighborhood problems (Schieman and Meersman, Reference Schieman and Meersman2004; Bierman, Reference Bierman2009), higher county-level income inequity (Muramatsu, Reference Muramatsu2003), and lower neighborhood collective efficacy (Ahern and Galea, Reference Ahern and Galea2011) were related to higher depressive symptoms or higher likelihood of possible clinical depression whereas higher proportion of Mexicans (in Mexican American samples; Ostir et al., Reference Ostir, Eschbach, Markides and Goodwin2003; Gerst et al., Reference Gerst2011), more walking-friendly neighborhood (Berke et al., Reference Berke, Gottlieb, Moudon and Larson2007), and higher neighborhood social capital (Hahn et al., Reference Hahn, Yang, Yang, Shih and Lo2004) were related to lower depressive symptoms or lower likelihood of possible clinical depression.
However, exceptions to the meaningfulness of relationships between neighborhood variables and depressive mood were residential stability, land-use mix, and availability of retail goods. That is, contrary to expectations, higher residential stability in the neighborhood (Aneshensel et al., Reference Aneshensel2007), and higher land-use mix and greater availability of retail goods (Saarloos et al., Reference Saarloos, Alfonso, Giles-Corti, Middleton and Almeida2011) were associated with higher depressive mood. There were also mixed results regarding concentration of older persons in the neighborhood which was associated with less depressive symptoms in one study (Kubzansky et al., Reference Kubzansky2005), but with increased risks of depressive mood in another (Menec et al., Reference Menec, Shooshtari, Nowicki and Fournier2010).
Replication of findings
If a particular neighborhood variable is clearly related to depressive mood, then we would expect this association to be present in many studies. Our analyses were limited to neighborhood variables that were included in more than one study and for which results of the final models are reported: neighborhood socioeconomic disadvantage, neighborhood poverty, neighborhood affluence, racial composition, residential stability, elderly concentration, neighborhood problems, and neighborhood walkability.
Neighborhood socioeconomic disadvantage was related to depressive mood in three out of 12 samples (Wilson et al., Reference Wilson, Chen, Taylor, McCracken and Copeland1999; Kvaal et al., Reference Kvaal2008 vs. Walters et al., Reference Walters2004; Aneshensel et al., Reference Aneshensel2007; Kvaal et al., Reference Kvaal2008; Wight et al., Reference Wight, Cummings, Karlamangla and Aneshensel2009; Saarloos et al., Reference Saarloos, Alfonso, Giles-Corti, Middleton and Almeida2011). (Note that the number of references does not necessarily match the number of studies, because some studies included more than one sample/final model.) Neighborhood poverty was associated with depressive mood in two out of six samples (Ostir et al., Reference Ostir, Eschbach, Markides and Goodwin2003; Kubzansky et al., Reference Kubzansky2005 vs. Hybels et al., Reference Hybels2006; Yen et al., Reference Yen, Rebok, Yang and Lung2008; Gerst et al., Reference Gerst2011). In none of four studies was neighborhood affluence related to depressive mood (Kubzansky et al., Reference Kubzansky2005; Hybels et al., Reference Hybels2006; Aneshensel et al., Reference Aneshensel2007; Wight et al., Reference Wight, Cummings, Karlamangla and Aneshensel2009). The associations between racial/ethnic composition and depressive mood were significant in two out of seven studies (Ostir et al., Reference Ostir, Eschbach, Markides and Goodwin2003; Gerst et al., Reference Gerst2011 vs. Kubzansky et al., Reference Kubzansky2005; Hybels et al., Reference Hybels2006; Aneshensel et al., Reference Aneshensel2007; Wight et al., Reference Wight, Cummings, Karlamangla and Aneshensel2009; Gerst et al., Reference Gerst2011). It is noteworthy that in the two studies that reported significant associations between racial/ethnic composition and depressive mood, samples were limited to a single ethnic group (Mexican Americans). Residential stability was related to depressive mood in one out of seven samples (Aneshensel et al., Reference Aneshensel2007 vs. Kubzansky et al., Reference Kubzansky2005; Hybels et al., Reference Hybels2006; Yen et al., Reference Yen, Rebok, Yang and Lung2008; Wight et al., Reference Wight, Cummings, Karlamangla and Aneshensel2009; Menec et al., Reference Menec, Shooshtari, Nowicki and Fournier2010). Higher concentration of older persons was associated with depressive mood in two out of six studies (Kubzansky et al., Reference Kubzansky2005; Menec et al., Reference Menec, Shooshtari, Nowicki and Fournier2010 vs. Hybels et al., Reference Hybels2006; Aneshensel et al., Reference Aneshensel2007; Yen et al., Reference Yen, Rebok, Yang and Lung2008; Wight et al., Reference Wight, Cummings, Karlamangla and Aneshensel2009). The relationships between neighborhood problems and depressive mood were significant in two out of three samples (Schieman and Meersman, Reference Schieman and Meersman2004; Bierman, Reference Bierman2009). Finally, neighborhood walkability was related to depression in one out of three samples that investigated this relationship (Berke et al., Reference Berke, Gottlieb, Moudon and Larson2007; Saarloos et al., Reference Saarloos, Alfonso, Giles-Corti, Middleton and Almeida2011).
Moderating effects
Moderating effects involving neighborhood variables on depressive mood were tested in six studies but results for participants aged 65 years old or older are available in only five of these studies (results not shown in Table 1). Johnson et al. (Reference Johnson, Corley, Starr and Deary2011) reported that the effect of neighborhood quality on depressive mood was stronger when respondents’ intelligence quotient (IQ), measured when they were 11 years old, was low. Muramatsu (Reference Muramatsu2003) reported that the effect of county-level income inequity on depressive symptoms was stronger among people with lower levels of physical health. However, he reported no significant interactions between county-level income inequity and other individual characteristics. Schieman and Meersman (Reference Schieman and Meersman2004) tested interaction effects between neighborhood problems on the one hand, and received social support, donated social support, and sense of mastery on the other hand. They reported that the effects of neighborhood problems on depression were stronger among women who received lower levels of social support, but no other significant interactions were reported for either men or women. Other results suggest that the relationships between neighborhood disorder and depressive scores are not moderated by marital status (Bierman, Reference Bierman2009). As well, the associations between neighborhood poverty or racial composition and depressive scores are not moderated by individual characteristics (Ostir et al., Reference Ostir, Eschbach, Markides and Goodwin2003).
Discussion
The aim of this paper was to review the relationships between neighborhood variables and depressive mood among people aged 65 years or older. Nineteen studies met criteria for the review. Depressive mood was studied most often along a continuum, as opposed to a diagnosis category, which is appropriate within a population health paradigm. However, it may be as important to understand the characteristics of depressed individuals in need of clinical interventions, as to understand what is associated with depressive symptoms in the older population. Depressive mood was mainly assessed by the CES-D, a questionnaire designed to evaluate depressive symptoms in the general population, even though the GDS was specifically created for the geriatric population. The CES-D however showed adequate psychometric properties in older populations (Lewinsohn et al., Reference Lewinsohn, Seeley, Roberts and Allen1997).
Most of the studies had a cross-sectional design, which does not allow for inferences about causal relationships. Our review did not reveal any studies testing mediating effects between neighborhood variables and depressive mood using structural equation modeling. Such designs would allow for investigating if there is a direct relationship between neighborhood variables and depressive mood and if the relationship can be explained by other variables thought to be along the causal pathway. For example, older people living near parks may feel less depressed because parks elicit physical activities (walking) and social contacts and not because of the presence of green spaces per se. In two studies, more favorable built environment (Brown et al., Reference Brown2009a) and better neighborhood climate (Brown et al., Reference Brown2009b) were found to be related to lower psychological distress through the presence of greater perceived social support. However, the outcome measure in these studies (i.e. psychological distress) was a composite of depression and anxiety symptoms and was excluded from the review. Because the onset of these two disorders seems to be associated with different factors (Kvaal et al., Reference Kvaal2008; Vink et al., Reference Vink2009), these studies do not allow for valid inferences about effects on depressive mood.
The delineation of neighborhood was mainly achieved through administrative or statistical spatial boundaries: census units, geographic data zone, postal district, county unit, enumeration district, or township unit. These boundaries may create artificial neighborhoods (Aneshensel et al., Reference Aneshensel2007) that do not adequately capture the subjective meaning of neighborhood held by the residents (Coulton et al., Reference Coulton, Korbin, Chan and Su2001). Using more exposure-specific and outcome-specific approaches may maximize between-neighborhood variability and minimize within-neighborhood variability (Gauvin et al., Reference Gauvin2007) and appears to be a promising approach. Aggregating spatial units into territorial units based on other criteria could create homogeneous areas in terms of characteristics related to material and social conditions and aid uncovering associations between neighborhood characteristics and mental health outcomes (Gauvin et al., Reference Gauvin2007). For example, a study showed that zones specifically delineated according to known correlates of walking behaviors were better predictors of the number of episodes of utilitarian walking than correlates measured at the census tract level (Riva et al., Reference Riva, Gauvin, Apparicio and Brodeur2009).
In the studies reviewed, six neighborhood characteristics were assessed most often: neighborhood socioeconomic disadvantage, neighborhood poverty, affluence, racial/ethnic composition, residential stability, and elderly concentration. These characteristics cover two out of ten categories of neighborhood attributes identified by Galster (Reference Galster2001): demographic (racial/ethnic composition, residential stability, elderly concentration) and socio-economic (neighborhood socioeconomic disadvantage, neighborhood poverty, affluence) characteristics of the population. Similarly to neighborhood delineation, the vast majority of neighborhood variables used in studies was derived from census units. It is important to go beyond census unit parameters to investigate specific neighborhood variables (Kubzansky et al., Reference Kubzansky2005). Other neighborhood attributes have received little or no attention in the literature: residential and non-residential non-structural elements, infrastructure, public services, environmental, proximity, political, social-interactive, and emotional characteristics. The attributes identified by Galster (Reference Galster2001) may not all be of equal importance for the study of the determinants of depressive mood. For example, political characteristics of neighborhoods may play a less important role in depressive mood than the other attributes (e.g. social-interactive, proximity) that contribute to daily functioning. Moreover, we identified five self-reported neighborhood variables in the studies (neighborhood collective efficacy, neighborhood problems, perceived neighborhood social capital, sense of belonging, and neighborhood quality). Just as with social interactions (e.g. Evans, Reference Evans2009), self-reported measures of neighborhood may be more strongly related to depressive mood than objective measures. For example, satisfaction with availability of key resources may decrease depressive symptoms whereas objective availability of key resources may not be related to depressive symptoms. Future research could therefore include both self-reported and actual markers of neighborhood features.
In multivariate associations, neighborhood variables were found to make a unique and significant contribution to the understanding of depressive mood independent of some of the strongest individual predictors of depressive mood in older adults. Confidence intervals for neighborhood variables were sometimes large, suggesting that some of these estimates may be less reliable. Where measured, the proportion of variance explained (R 2) by individual covariates and neighborhood variables in depressive mood is small to moderate and no studies reviewed provided information regarding the unique contribution of neighborhood variables (i.e. independent of individual characteristics). This unique contribution may be significant, but small. However, large neighborhood effects on depressive mood are unlikely. Neighborhood variables may complement or supplement other stronger predictors of depressive mood such as female gender, physical illnesses, or functional limitations. That is, when investigating relationships between neighborhood variables and depressive mood, we may be looking at small associations that explain equally small portions of the variance left unaccounted for by stronger predictors. As a result, the implications of the size of neighborhood effects for knowledge advancement and public health interventions remain unclear (Gauvin et al., Reference Gauvin2007).
Neighborhood variables were generally associated with depressive mood in a conceptually meaningful way, but overall, the quantity of studies was limited, and it is not clear if these relationships are different as a function of another variable (moderating effects). Additional studies are required to draw more far-reaching conclusions about neighborhood effects and to clarify complex patterns of associations. Studies in non-industrialized countries would also be of interest to investigate if results can be replicated and extended.
Longitudinal and experimental studies are also needed to uncover both the time course and plausible processes by which neighborhood characteristics may be related to depressive mood. The direction of causal relationship between neighborhood variables and depressive mood is also unclear: do deleterious neighborhoods cause older people to become depressed, does depressive mood coincide with other socioeconomic factors to lead depressed older people to live in deleterious neighborhoods, or does depressive mood in many citizens at once contribute to creating more deleterious neighborhood environments? Although determining the direction of the causal relationship may be difficult to achieve, interesting alternatives to correlational models are available for researchers. Research would benefit from increased use of natural experiments (Petticrew et al., Reference Petticrew2005). One example would be to exploit public investments in green spaces or street improvements and assess impact on depressive mood. Another option is to target individuals who moved and investigate if moving to a neighborhood bearing similar, less desirable, or more desirable characteristics than the initial neighborhood is related to change in depressive mood. It could be hypothesized that moving to a less desirable neighborhood deteriorates mood whereas moving to a more desirable neighborhood improves mood compared to moving to a neighborhood with characteristics similar to the initial one. In keeping with this idea, Leventhal and Brooks-Gunn (Reference Leventhal and Brooks-Gunn2003) found that parents who were relocated by a housing relocation program from high-poverty neighborhoods to lower-poverty neighborhoods reported less distress and depressive symptoms than parents who remained in high-poverty neighborhoods.
Returning to the conceptualization of Glass and Balfour (Reference Glass, Balfour, Kawachi and Berkman2003), the current review supports the notion that selected neighborhood variables, especially those related to poverty and material deprivation, are associated with worse mental health. However, thus far, there is limited empirical evidence to fully ascertain this notion and information is even more scarce on the processes that might explain any relationships between neighborhood variables and depressive mood among older adults. Future research examining the extent to which neighborhood variables create buoying or pressing environments that interact with personal competencies, leading to adaptive or maladaptive responses as well as health and functioning, is warranted. Until the relationships between neighborhood variables and depressive mood are more fully understood, it seems premature to conclude that neighborhood interventions are useful (or not useful) in alleviating older adults’ depressive mood.
Conflict of interest
None.
Description of authors' roles
All authors formulated the research questions and designed the study. D. Julien performed the literature review and wrote the first draft of the paper. All authors commented on drafts and contributed to writing the paper.
Acknowledgments
This work was supported by a post-doctoral fellowship from the Institut de recherche en santé publique de l'Université de Montréal (IRSPUM) to DJ, the Canadian Institutes of Health Research (grants MOP-173669 and MOP-62842), and the Fonds de la recherche en santé du Québec (grant number 16207 to LR and 20328 to YK). LG holds a CIHR/CRPO (Canadian Institutes of Health Research/Centre de recherche en prevention de l'obésité) Applied Public Health Chair on Neighborhoods, Lifestyle, and Healthy Body Weight.
Appendix 1. Combinations of keyword terms used in database searches
(1) Depression, depression (emotion), major depression, major depressive disorder, depressive disorder, depressive symptoms, or depressive mood; with (2) aging, aged, elder(s), elderly, older adults, or senior(s); with (3) neighborhood(s), neighborhood characteristic(s), neighborhood environment, environment design, built environment, urban environments, residence characteristics, urbanization, social cohesion, neighborliness, neighborhood social capital, neighborhood social environment, collective efficacy, neighborhood disorder(s), neighborhood problem(s), elderly concentration, age structure, proportion of older persons, proportion of older people, neighborhood poverty, neighborhood income, neighborhood socioeconomic disadvantage, neighborhood socioeconomic status, Carstairs deprivation score, Gini coefficient, county-level income inequality, Townsend index, Townsend score, Townsend deprivation index, neighborhood environmental quality, residential stability, population density, neighborhood quality, neighborhood affluence, neighborhood socioeconomic advantage, racial composition, ethnic composition, racial heterogeneity, ethnic heterogeneity, neighborhood walkability, or neighboring behavior.