





The spectrum of malnutrition, which includes both underweight and overweight or obesity derived from abnormal ranges of BMI, is a valuable nutritional indicator of a country. Globally, 2·5 billion adults (aged 18 years and above) were overweight, including 890 million obese, while 390 million adults were underweight(1). Abnormal BMI presents a serious health problem, particularly for reproductive-aged women’s own health and the health of their newborns. It leads to fetal losses and increases the risk of infertility and subfertility(Reference Boxem, Blaauwendraad and Mulders2,Reference Jungheim, Travieso and Hopeman3) . Abnormal BMI of women contributes to anovulation, irregular menses(Reference Lake, Power and Cole4), adverse oocyte quality(Reference Boutari, Pappas and Mintziori5), endometrial alterations, hormonal imbalances(Reference Boutari, Pappas and Mintziori5,Reference Imterat, Agarwal and Esteves6) and polycystic ovary syndrome, and all these can result in female infertility(Reference Zheng, Yang and Guo7). Therefore, the psychosocial consequences of such infertility can intensify the weight gain, forming a loophole(Reference Zheng, Yang and Guo7). Besides, abnormal BMI is an important determinant of preterm birth, low birth weight, under-5 deaths and poor mental and physical development of newborn child(Reference Black, Victora and Walker8). On the other hand, overweight or obesity are major risk factors for non-communicable diseases such as diabetes, musculoskeletal disorders, some cancers (including breast, ovarian and liver) and CVD among women(1).
Bangladesh, a South Asian country of 174 million people, is facing a major challenge due to the increasing prevalence of overweight and obesity. Due to a relatively high prevalence of underweight, although it decreased considerably in recent years, the country is in a situation of dual nutritional burden(Reference Khan, Haider and Jamil9–Reference Shafique, Akhter and Stallkamp11). Although remarkable progresses in poverty alleviation, rapid urbanisation, food fortification and industrialisation of local food production, are observed recent decades, that all may have positive impact of reducing malnutrition among women(Reference Susilowati and Karyadi12).
Women’s BMI is shaped not only by their genetics and hormonal interplay(Reference Group13) but also by a range of behavioural and social factors(Reference Black, Victora and Walker8,Reference Biswas, Magalhaes and Townsend14–Reference Rennie, Johnson and Jebb17) . With improvements in women’s socio-economic conditions, the country witnessed reductions in underweight and a gradual increase in overweight prevalence(Reference Biswas, Uddin and Mamun18–Reference Tanwi, Chakrabarty and Hasanuzzaman24). Beyond these factors, women’s companionship, such as living with husbands, number of children, experience of child loss and contraceptive use, were also found to be associated with women’s nutritional changes(Reference Santhya25–Reference Hashan, Rabbi and Haider29). Women’s lifestyles, such as sedentary behaviour, location of residence and employment, are also known to be associated with their BMI(Reference Narciso, Silva and Rodrigues15–Reference Rennie, Johnson and Jebb17). Many of these social and individual factors varied over time, potentially impacting their BMI as well.
Although several studies in Bangladesh have examined determinants of underweight or overweight among women, most have focused on single survey rounds, specific subpopulations or limited sets of predictors. Consequently, there is limited evidence on how associations between sociodemographic, reproductive and lifestyle factors and women’s nutritional status have changed over time, particularly in the context of Bangladesh’s rapid socio-economic and demographic transition. Furthermore, previous studies have not comprehensively examined these factors in relation to both BMI distribution and BMI-defined nutritional categories across multiple decades. To address these gaps, this study investigates trends and changes in significant factors associated with women’s nutritional status – assessed using BMI distribution and BMI‑based categories of underweight and overweight/obesity – over the last two decades in Bangladesh.
Methods
Data sources
The study used seven waves of Bangladesh Demographic Health Survey (BDHS) data from 1996 to 2022, provided by the Demographic Health Survey programme of the USA. BDHS data are collected by Mitra Associates and the National Institute of Population Research and Training under the Ministry of Health and Family Welfare of Bangladesh. BDHS provides individual, household and societal information about demographic, social, health and nutritional status.
The BDHS followed a two-stage stratified sampling from the primary sampling units and a systematic selection of the households. In the first stage, the primary sampling units from both urban and rural areas were selected from the Population and Housing Censuses with a proportional probability sampling technique. In the second phase, a fixed number of households were selected from each of the primary sampling units using the systematic sample procedure. The BDHS adopted thirty households per cluster for all the surveys, except in 2022, when they adopted forty-five households per cluster(30–Reference Mitra, Al-Sabir and Cross37). In this study, we used the women’s record files, which contain individual, familial, social and biomarker information of ever-married women of reproductive age.
Sample size and study population
The BDHS collected women’s biomarker information, namely their height and weight, from selected households. Some women refused to provide this information, and we excluded them from the analysis. We also excluded those women who had reported being pregnant at the time of the survey, as the usual BMI classifications work differently for pregnant women (Society for Maternal-Fetal Medicine, 2019). Therefore, this study included all those women who were (i) women of reproductive age, (ii) not pregnant at the time of the survey and (iii) provided biomarker information. From 1996 to 2022, a total of 90 630 women were selected for this study following these inclusion criteria. Details of the sample size for the BDHS waves are presented in Figure 1.
Sample selection from 1996 to 2022.

Outcome variable
In the BDHS data, body weight and height were recorded during the interview. The weight was measured using a digital scale (model SECA-874, seca GmbH & Co.), and the height was measured with a measuring board (model ShorrBoard®). BMI of women was calculated using their body weight and height and classified them into underweight (BMI < 18·5 kg/m2), normal weight (18·5 kg/m2 ≥ BMI ≤ 24·99 kg/m2) and overweight/obese (BMI ≥ 25·0 kg/m2) based on the global classification by the WHO.(38)
Study factors
Sociodemographic, economic and fertility-related variables were used to identify sample characteristics as well as the risk factors. All those variables were extracted from a systematic search of previous studies in PubMed and Google Scholar.
In this study, we included women’s age (continuous), education level (no formal education, incomplete primary, primary, incomplete secondary, secondary and higher), formal employment status (no, yes), place of residence (urban, rural), and access to television (no, yes). We developed a variable using the wealth index scores and named it socio-economic status. It has three categories: poor, middle and rich. For the reproductive factors, we included women’s marital status (formerly married, currently married), type of contraceptive being used (no, traditional and modern), children ever born (no child, 1–2 children, 3+ children) and experiencing child death (no, yes).
Statistical analysis
We described the sociodemographic characteristics of participants by using frequency distribution for each survey year, as well as for the pooled dataset. We explored the distributional pattern of BMI for women and changes over the years. The prevalences of underweight and overweight were estimated for each of the survey waves, both at the national level and for urban and rural settings. We identified factors associated with underweight and overweight for each survey wave as well as for the pooled dataset. In the pooled model, we used the multilevel mixed-effect logistic regression, and the survey year was considered the random intercept. However, in the year-specific data, we identified the significant factors by using the multinomial regression in reference to normal weight. We excluded the 1996 and 2000 survey data due to unavailability of wealth quintile information. Survey weights were applied in all estimates, and the STATA 19.0 version was used for data management and analysis.
Ethical statements
Ethical approval was obtained from the Ministry of Health and Family Welfare, Dhaka, Bangladesh. The international credit finance (ICF) supported financial and technical assistance for the survey via USAID, Bangladesh. The data collection process was also approved by the ORC Macro Institutional Review Board. The BDHS is part of the worldwide Demographic and Health Surveys programme, which is designed to collect data on fertility, family planning and maternal and child health. Informed written consent was obtained from all the participants before the study.
Results
Sample characteristics
In the overall sample, pooled from the 1996 to 2022 wave, there were 90 510 reproductive-aged women (Table 1). Almost half of these women were less than 30 years old, and 93·9 % were married during the survey. More than a quarter (28·5 %) received no formal education, and only 13·17 % completed secondary or higher education. About 75 % of women lived in rural areas, 35 % were from households of poor wealth quintile and 31 % had formal employment. Almost half (47·1 %) of the women had 1–2 children, 45·6 % had three or more children and 7·4 % had none. Nearly, half of the women were using modern contraceptives, and nearly 56 % had access to television.
Characteristics of women in the pooled study sample (BDHS 1996–2022)

Table 1. Long description
The table presents characteristics of women in a study sample from 1996 to 2022. It includes data on age groups, education levels, place of residence, formal employment status, access to television, socioeconomic status, marital status, type of contraceptive being used, number of children ever born, and child mortality. The table has 18 columns representing different years and 14 rows representing different characteristics. Row 1: Overall, 90510. Row 2: 2022, 9398. Row 3: 2017/18, 6667. Row 4: 2014, 16655. Row 5: 2011, 16278. Row 6: 2007, 10165. Row 7: 2004, 10598. Row 8: 2000, 4783. Row 9: 1996, 4153.
BDHS, Bangladesh Demographic Health Survey.
* 8839 missing values.
Trends in BMI, underweight and overweight/obesity
We present the trends in average BMI with descriptive statistics (Figure 2). Over the periods, the average BMI increased about 5 kg/m2 from 18·83 kg/m2 in 1996 to 23·81 kg/m2 in 2022, while the pooled average was 21·74 kg/m2. However, the distribution of BMI over the surveys remains bell-shaped, but as time passed, the distributions became flat with reduced skewness and kurtosis. The average BMI was also higher in urban areas (23·32 kg/m2) than in rural areas (21·21 kg/m2) over time (Supplementary Table 1). Distributional changes in BMI over the periods by women’s educational status, place of residence and socio-economic status were also provided in the supplementary Figures 1–4.
Trends of the BMI distribution (from 1996–2022) among the reproductive-aged women in Bangladesh.

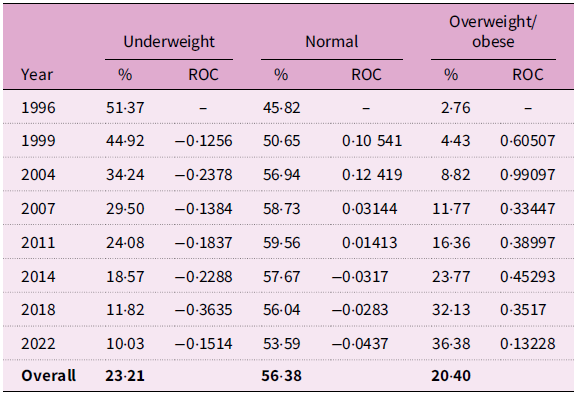
We estimated the overall prevalence and changes in underweight, normal weight and overweight/obesity (Table 2). Overall, the prevalence of underweight women significantly decreased by 41·34 %: from 51·37 % in 1996 to 10·03 % in 2022, following the sharpest decline observed between 2014 and 2018 (rate of change (ROC): −0·3635). Consequently, there was a substantial increase in the prevalence of overweight/obese women, rising by 33·62 %, from a low of 2·76 % in 1996 to 36·38 % in 2022. The highest ROC was observed between 2004 and 2007 (ROC: 0·99097). The prevalence of normal-weight women initially increased from 45·82 % in 1996 to a peak of 59·56 % in 2011, followed by a subsequent decline to 53·59 % in 2022. The ROC was positive until 2011 and then turned negative, indicating a slight decrease in normal-weight prevalence in later years.
Prevalence and rate of change (ROC) of underweight, normal weight and overweight/obese from 1996 to 2022 of ever-married women in Bangladesh

Table 2. Long description
The table presents data on the prevalence and rate of change (ROC) of underweight, normal weight, and overweight/obese ever-married women in Bangladesh from 1996 to 2022. It has 8 rows and 7 columns. The columns are labeled Year, Underweight (%), Underweight (ROC), Normal (%), Normal (ROC), Overweight/obese (%), and Overweight/obese (ROC). The rows are labeled with specific years: 1996, 1999, 2004, 2007, 2011, 2014, 2018, 2022, and Overall. Each row provides the percentage and ROC for underweight, normal weight, and overweight/obese categories for the respective year. Notable trends include a significant decrease in the prevalence of underweight women, a substantial increase in the prevalence of overweight/obese women, and a peak in the prevalence of normal-weight women around 2011 followed by a decline.
% indicates prevalence.
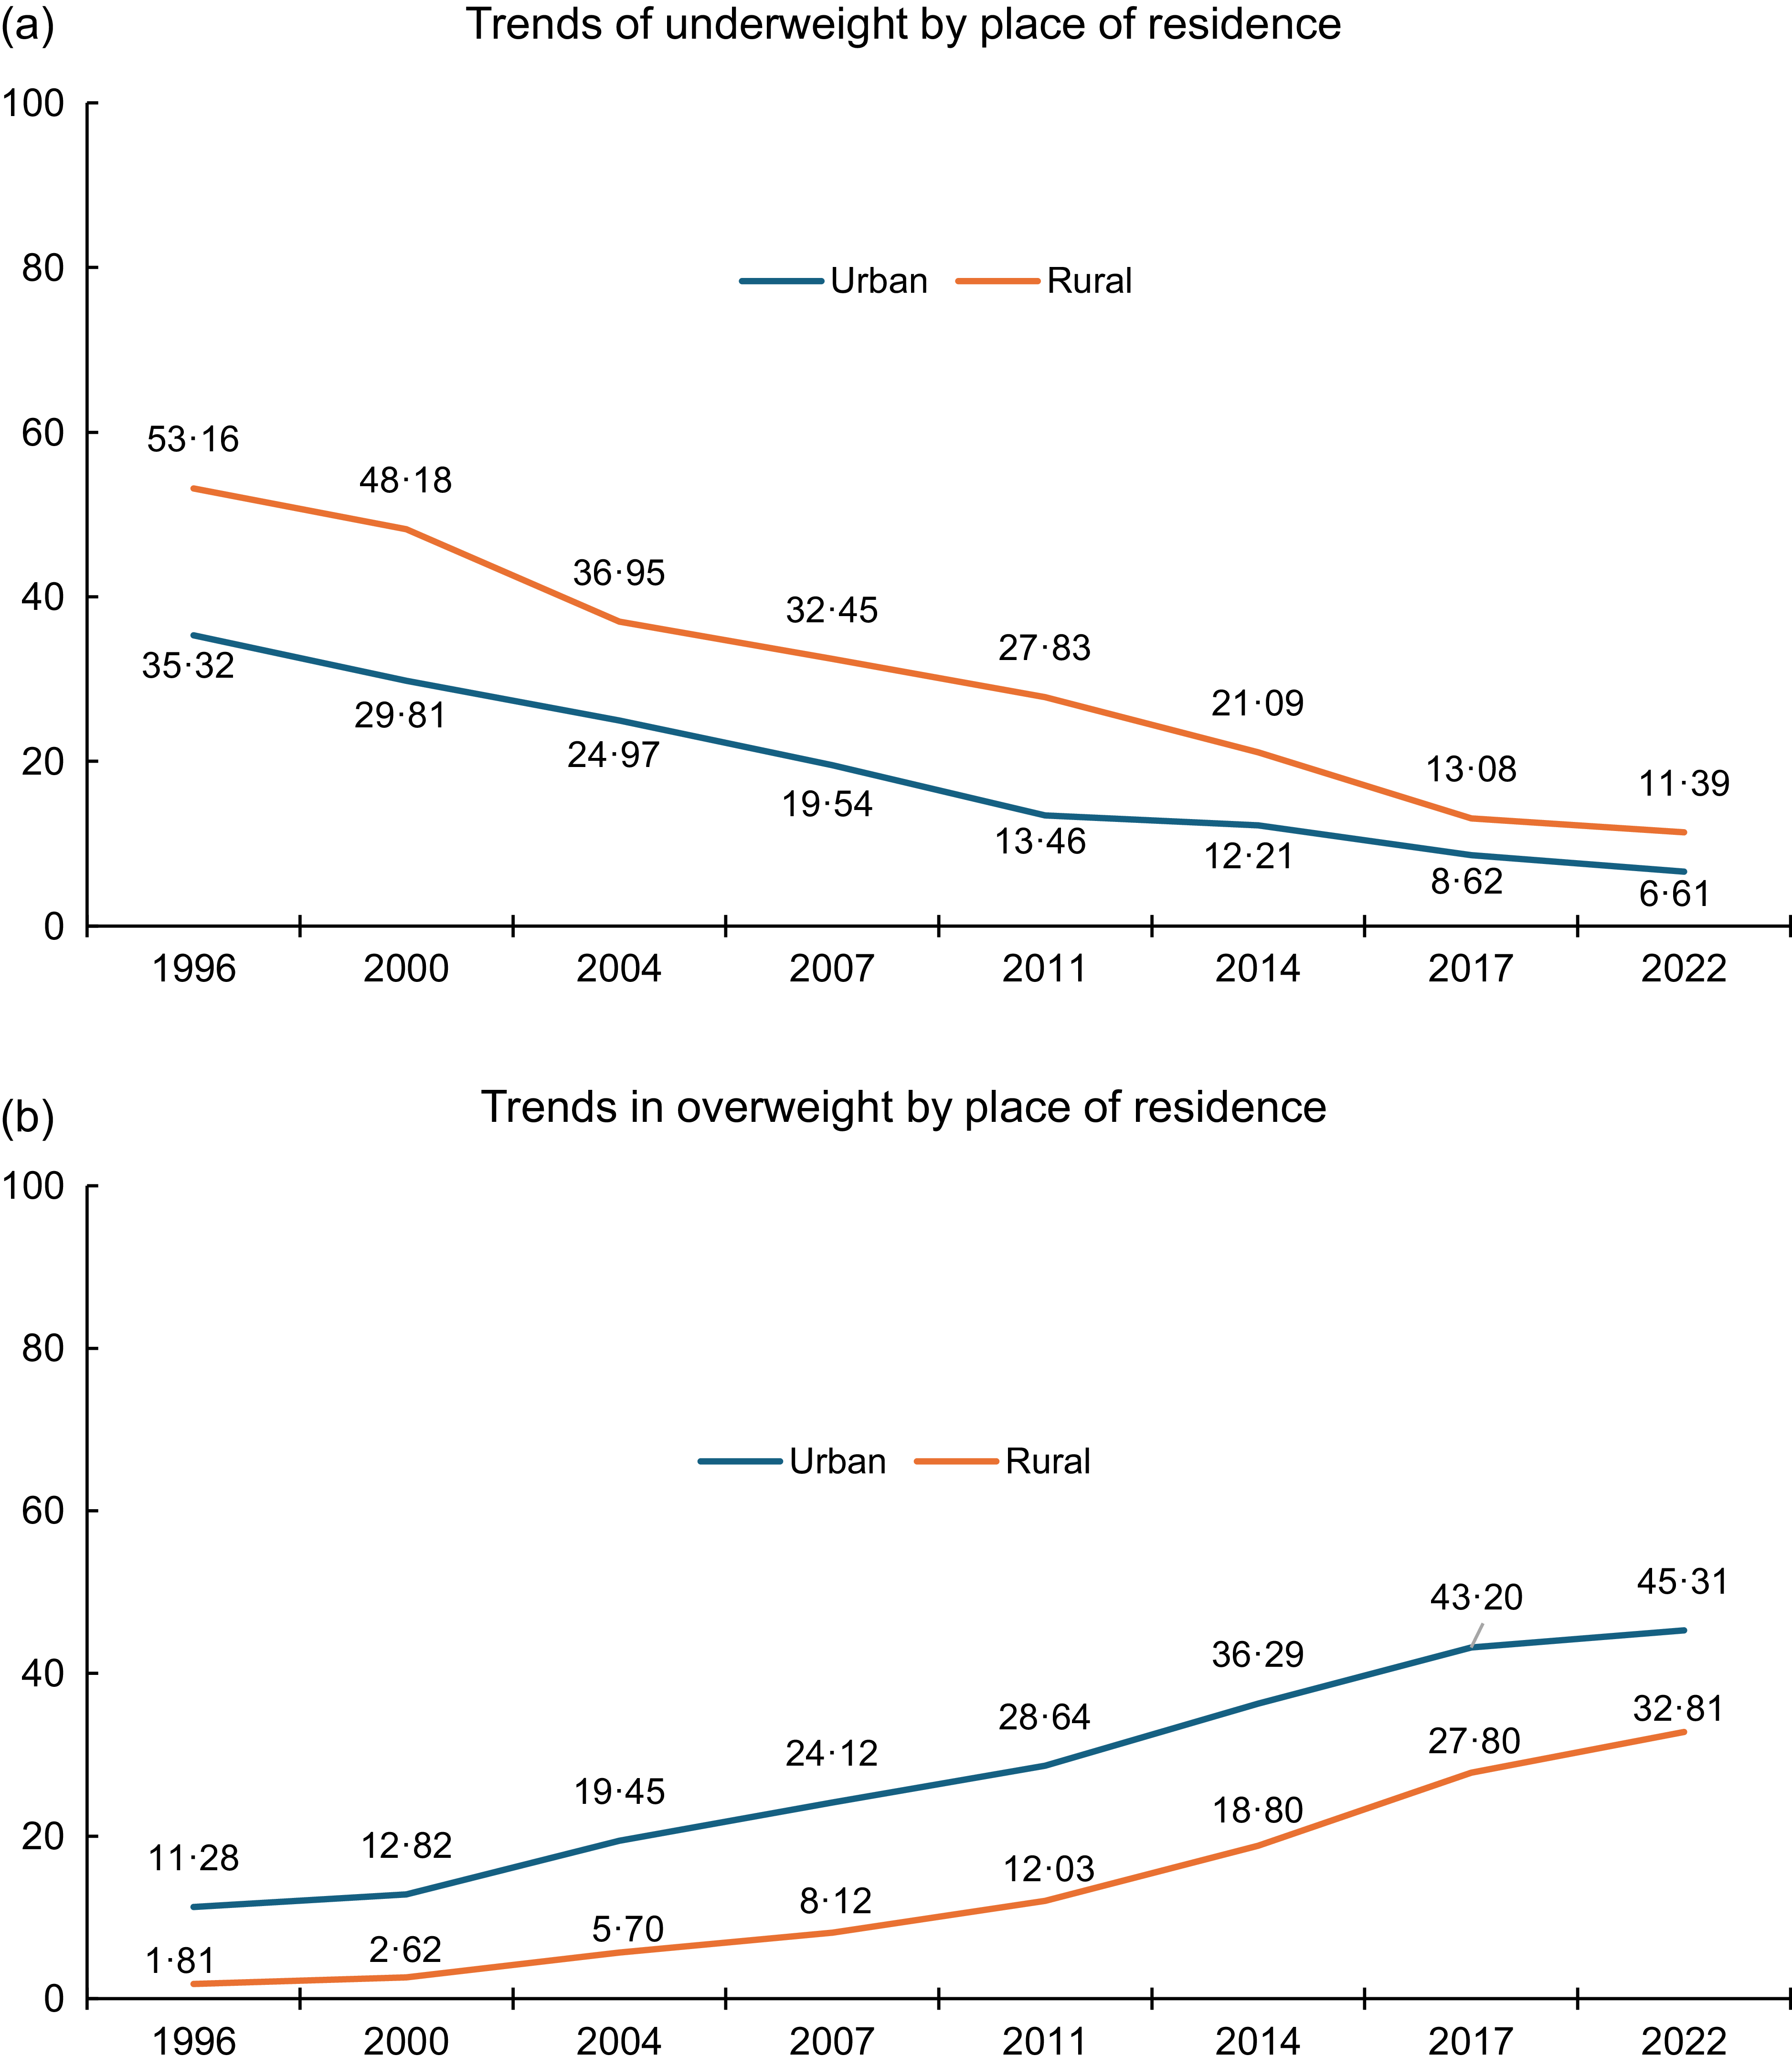
The prevalence of underweight and overweight varies in urban and rural areas (Figure 3). While both urban and rural areas show a decline in underweight prevalence, the rural population consistently exhibits a higher prevalence of underweight (53·16 % in 1996 to 11·39 % in 2022) compared with their urban counterparts (35·32 % in 1996 to 6·61 % in 2022). A pronounced urban–rural differential is evident, with urban reproductive-aged women consistently demonstrating a substantially higher prevalence of overweight/obesity (11·28 % in 1996 to 45·31 % in 2022) than rural women (1·81 % in 1996 to 32·81 % in 2022) across all survey years.
Overall and urban–rural difference in prevalence of (a) underweight and (b) overweight/obese among reproductive-aged women in Bangladesh, BDHS 1996 to 2022. BDHS, Bangladesh Demographic Health Survey.

Factors associated with underweight and overweight
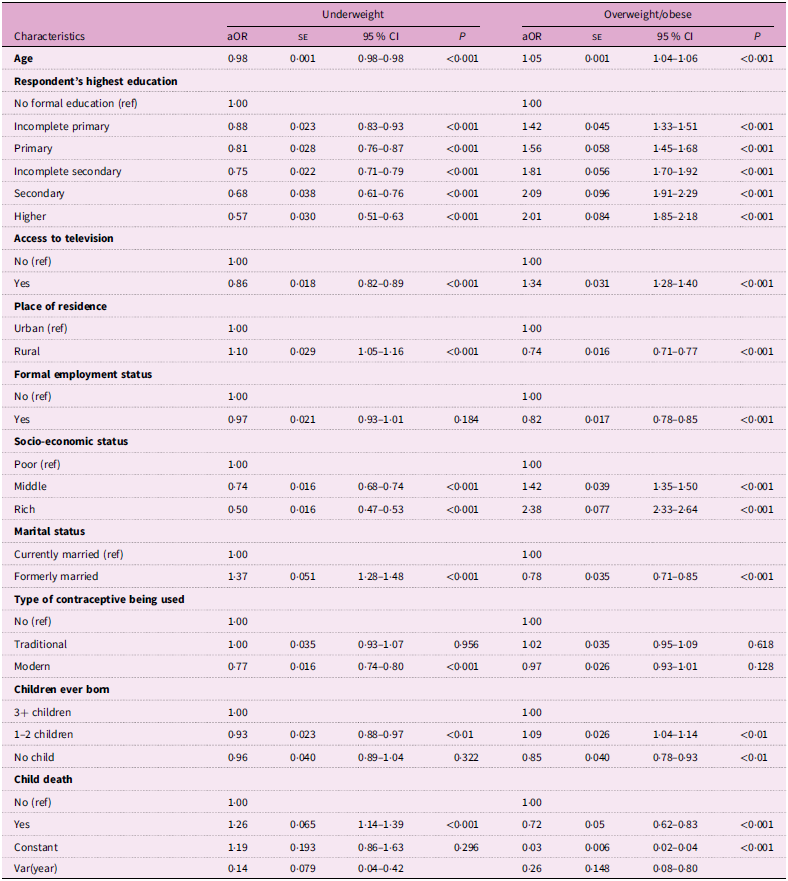
Table 3 presents factors associated with underweight and overweight in the pooled sample. For a 1-year increase in women’s age, the odds of becoming underweight decreased by 2 % (adjusted odd ratio (aOR): 0·98; 95 % CI: 0·976–0·981). As women’s educational level increased, the odds of being underweight reduced. Women who were living in rural areas had 10 % higher odds of being underweight than those living in urban areas. There was a gradient in aOR for socio-economic status, with women of better socio-economic levels less likely to be underweight. Women who had access to television had lower odds of being underweight than those who did not have access. The odds of being underweight were 37 % higher among the formerly married women than currently married women. Women who were using modern contraceptives had 23 % lower odds of being underweight than those who were not using any. Those who had 1–2 children had 7 % lower odds of being underweight than those who had three or more children.
Factors associated with underweight and overweight among reproductive-aged women (reference: normal weight) in Bangladesh (Pooled data: BDHS 2004 to 2022)

Table 3. Long description
The table presents factors associated with underweight and overweight among reproductive-aged women in Bangladesh, using pooled data from BDHS 2004 to 2022. It has 12 rows and 10 columns. The columns are labeled Characteristics, Underweight aOR, Underweight SE, Underweight 95% CI, Underweight P, Overweight/obese aOR, Overweight/obese SE, Overweight/obese 95% CI, and Overweight/obese P. The rows include characteristics such as Age, Respondent’s highest education, Access to television, Place of residence, Formal employment status, Socio-economic status, Marital status, Type of contraceptive being used, Children ever born, and Child mortality. Each row provides adjusted odds ratios (aOR), standard errors (SE), 95% confidence intervals (CI), and P-values for both underweight and overweight/obese categories. Notable trends include the decrease in odds of being underweight with increasing age and education level, and the higher odds of being underweight in rural areas compared to urban areas. Women with better socio-economic status have lower odds of being underweight. Access to television, use of modern contraceptives, and having fewer children are associated with lower odds of being underweight. Formerly married women have higher odds of being underweight compared to currently married women.
BDHS, Bangladesh Demographic Health Survey; aOR, adjusted odd ratio; (ref), reference category.
P indicates statistical significance.
For each year increase in women’s age, the odds of becoming overweight/obese increased by 5 % (aOR: 1·05; 95 % CI: 1·04–1·06). As women’s educational level increased, the odds of being overweight/obese increased; for example, women who received higher education were 101 % more likely to be overweight than those who received no formal education. Women from middle-class households had 42 % higher odds of being overweight than those from poor households, while women from rich households had 138 % higher odds of being overweight. Compared with women who had three or more children, those with 1–2 children had 9 % higher odds of being overweight, while women with no children had 15 % lower odds of being overweight/obese. Women who were living in rural areas had 26 % lower odds of being overweight than those who were living in urban areas. Respondents who experienced the death of any of their children had 28 % lower odds of being overweight than those who did not. Besides, the odds of being overweight was lower (22 %) among formerly married than currently married women.
Changes in determinants over the years
The sociodemographic variables that were found significant were largely consistent in both year-wise and pooled data, with minor variations observed, particularly in the 2022 dataset (Table 4). Over the study periods, several factors were consistently associated with underweight and overweight among women. Women’s age was consistently and positively associated with overweight, and the risk varied 3 % (adjusted risk ratio (aRR) 1·05 to 1·08) over the periods. Although women who received more than a secondary education consistently had higher risks of being overweight compared to the non-educated women, the relative risk declined considerably after 2004. The relative risk has remained around 2 since then, with slight sporadic variations. Women who had access to television were more likely to be overweight compared with those without access in both 1996 (aRR: 3·42, p < 0·001) and in 2022 (aRR: 1·26, p < 0·001). Although the association remained positive over time, its magnitude decreased substantially, indicating that access to television was less strongly associated with overweight/obesity in more recent years.
Adjusted risk ratio (aRR) and se in the associations between sociodemographic factors and underweight and overweight/obese reproductive-aged women (base: normal weight) in Bangladesh (BDHS 1996 to 2022)

Table 4. Long description
The table presents adjusted risk ratios (aRR) and standard errors (se) for the associations between sociodemographic factors and underweight and overweight/obese reproductive-aged women in Bangladesh from 1996 to 2022. The table has 12 rows and 18 columns, with columns representing different years (1996, 2004, 2011, 2014, 2017/18, 2022) and rows representing various sociodemographic factors such as age, education level, access to television, place of residence, formal employment status, socio-economic status, marital status, early marriage, type of contraceptive being used, children ever born, and child mortality. Each cell contains the aRR and se values for underweight and overweight categories. Notable trends include the consistent positive association between women’s age and overweight, with varying risk ratios across the years. Education level shows a decline in relative risk of being overweight after 2004. Access to television was strongly associated with overweight in 1996 but less so in recent years.
BDHS, Bangladesh Demographic Health Survey.
*<0·05, **<0·01, ***<0·001.
Rural women consistently had lower risks of being overweight compared to urban women, with aRR ranging from 0·38 in 2000 to 0·79 in 2022. While the risk of overweight for women of high socio-economic status has been consistently high over the years, it slightly decreased in the recent few survey years. Women from the high socio-economic status had about half the risk of being underweight compared to women from the low socio-economic status, and this trend remains consistent across the survey rounds. Women using modern contraceptives consistently had a lower risk of being underweight across survey years, with aRR values ranging from 0·70 in 2004 to 0·97 in 2017/18 and 0·95 in 2022. In contrast, other factors – such as primary or secondary education, number of children ever born, child death and marital status – showed associations that varied in significance across survey years for both underweight and overweight/obesity.
Discussion
Our analysis of 90 510 reproductive-aged Bangladeshi women reveals an epidemiological transition in nutritional status from 1996 to 2022. The prevalence of underweight among women plummeted by a remarkable 41·34 %, with the steepest decline observed between 2014 and 2018. Conversely, overweight/obesity surged by a substantial 33·62 %, with the highest increase between 2004 and 2007. These trends resulted in an average change in BMI of 5 kg/m2 over the period. Significant urban–rural disparities persist: the prevalence of underweight among women of reproductive age remained consistently higher in rural areas, while urban women exhibited a considerably higher prevalence of overweight/obesity. Age, education, socio-economic status and watching television showed consistent risks over time. Increased age and higher education were associated with increased odds of overweight/obesity. Because television ownership is associated with household income in Bangladesh, the observed relationship between television access and overweight may partly reflect socio-economic position rather than television viewing behaviour itself. However, the use of modern contraceptives and child death displayed inconsistent associations with both underweight and overweight. These observations, together, highlight a critical public health challenge requiring urgent, targeted interventions to address both the remaining burden of undernutrition in rural areas and the rapidly escalating epidemic of overweight/obesity, particularly in urban settings.
The changing epidemiological pattern observed in this study reflects a broader transition occurring in Bangladesh, characterised by a substantial decline in underweight alongside a growing burden of overweight and obesity among women. Evidence shows that the rise in overweight and obesity is occurring more rapidly in low-and middle-income countries (LMICs) than in high‑income countries(Reference Popkin and Gordon-Larsen39). A recent Lancet study examining worldwide trends in underweight and obesity from 1990 to 2022 reported one of the largest declines in age-standardised underweight prevalence occurred in South and Southeast Asian countries, including a 40·5 % reduction among Bangladeshi women, alongside a substantial and accelerating increase in overweight and obesity(40). Studies using BDHS data similarly document a persistent decline in underweight and a sharp rise in overweight/obesity among Bangladeshi women, most likely driven by improvements in education, household wealth, demographic ageing and rural-to-urban migration(Reference Biswas, Uddin and Mamun18,Reference Chowdhury, Adnan and Hassan19,Reference Thapa, Ahmed and Bizuayehu41) . In our study, the proportion of normal-weight women remained relatively stable at 50–60 % between 1999 and 2022, with a gradual reduction in underweight and a steady increase in overweight, reflecting this ongoing epidemiological shift. Our results suggest that ageing, higher educational attainment, urban residence, sedentary behaviours and modest socio-economic improvements may have contributors to these changing patterns. Although our dataset does not include detailed dietary information, previous research suggests that the modernisation and globalisation of food markets, including increased availability of processed foods and changing dietary habits, may also play an important role in shaping women’s nutritional status in Bangladesh(Reference Fox, Feng and Asal42).
There are some intriguing patterns in the factors associated with underweight and overweight. The factors that were positively associated with overweight were negatively associated with underweight. For example, women’s higher education, better socio-economic statuses, urban residence, access to television and having a relatively small number of children had higher odds of being overweight and subsequently lower odds of being underweight. These findings are consistent with the previous studies in Bangladesh(Reference Chowdhury, Adnan and Hassan19,Reference Hashan, Das Gupta and Day22,Reference Hossain, Bharati and Aik26,Reference Ferdausi, Al-Zubayer and Keramat43–Reference Khan and Kraemer46) as well as some other LMICs(Reference Thapa, Ahmed and Bizuayehu41,Reference Subramanian and Smith47–Reference Yeshaw, Kebede and Liyew50) . Earlier studies indicated that women’s improved social statuses are reflected in their lifestyles, food habits and increased sedentary behaviours. Urban and educated reproductive-aged women in Bangladesh are more likely than their counterparts to lead sedentary lifestyles and unhealthy food habits. Socially advanced women involved in office-based employment are deprived of physical activities.
Employed women had a lower likelihood of being overweight. This could be explained by the fact that non-working women, especially homemakers, may spend more time indoors and engage in sedentary activities. Working women, on the other hand, may perform both household chores and job-related tasks, which help maintain a normal BMI. In Bangladesh, an increasing number of women are entering the formal workforce(Reference Rahman and Islam51,52) . This inequity can also be reflected in their BMI and other nutritional statuses(Reference Nickson, Timming and Re53).
Women using modern contraceptives were less likely than those using no contraceptives to be underweight. This observation could be explained by the fact that contraceptive use reduces repeated pregnancies and related undernutrition and allows women to have nutritional recovery and maintain a healthy BMI through hormonal changes and associated fat storage and metabolism, particularly when using hormonal contraceptives(Reference Teshome, Berra and Huryi54). Another systematic review suggested that modern contraceptives that regulates female hormone for reproduction can reduce women’s BMI(Reference Cliffer, Yelverton and Dong55).
Women of high socio-economic status had a higher likelihood of being overweight, although there was a slight decrease in the risk over time. Moderate socio-economic status also saw a reduction in the risk. These results may suggest that although wealthier women remain more prone to being overweight, the difference between socio-economic groups has narrowed, potentially reflecting greater health awareness, adoption of healthier lifestyles and increased physical activity among higher socio-economic groups. At the same time, the protective effect of wealthier and middle-class women against undernutrition persisted throughout the study period.
Rural women consistently had a lower risk of being overweight compared to urban women. This difference became less pronounced in more recent surveys than in the earlier ones, suggesting that rural areas might be catching up to urban areas in terms of overweight prevalence. The higher risk of being underweight observed in earlier surveys in rural women gradually reduced in the recent waves, indicating significant improvements in nutritional status in rural settings regarding undernutrition.
The risk of being overweight among women who had access to television remained significant over the years; however, the magnitude of risk decreased over the decades. Literature suggests that television watching leads to increased energy intake and decreased physical activity(Reference Garg, Smith and Attuquayefio56,Reference Matthews, Keadle and Saint-Maurice57) . Besides, television has exposed and continues to expose women to unhealthy food advertising(Reference Boyland, Nolan and Kelly58). The risk reduction could imply changes in viewing habits, content or the overall impact of media on lifestyle choices over time. Additionally, as television has gradually become a common household item, even women from lower socio-economic statuses, who were less likely to be overweight, have had access to this device.
Policy implications
The epidemiological shift of underweight and overweight underscores the urgent need for a dual-pronged policy approach. Bangladesh has a National Food and Nutrition Security Policy (NFNSP 2020) and its associated Plan of Action (2021–2030) to address widespread food and nutrition issues, including micronutrient deficiencies and increasing rates of overweight and obesity. The policy aims to ensure food availability and affordability, promote healthy diets, enhance social safety nets and strengthen governance for food and nutrition security to meet the Sustainable Devemopment Goal targets by 2030. We recommend focusing on the persistent urban–rural disparities (more underweight women in rural areas and more overweight/obese women in urban areas) and implementing geographically tailored interventions. Policies must intensify efforts to combat undernutrition in rural areas, focusing on factors associated with underweight risk, such as education, socio-economic status and ensuring access to essential resources. Simultaneously, there is a critical need for robust public health strategies to curb the rapidly escalating burden of overweight/obesity, particularly in urban settings. These should target factors linked to increased overweight/obesity risk, including lifelong nutrition education and lifestyle changes driven by urbanisation. While some risk factors (e.g. age, education, socio-economic status) show consistent patterns, the inconsistent associations of modern contraceptive use and child deaths with both under-and overweight highlight the need for nuanced, adaptable interventions that consider the evolving demographic and social landscape.
Strengths and imitations
Our study analysed nationally representative data on women’s BMI and a range of other variables for a duration of 26 years. We used rigorous statistical methods, which produced more precise results. However, several factors related to physical exercise and other related information, such as sedentary behaviours and dietary habits, were not available in the datasets and therefore could not be included in the study. Although DHS maintains consistency across the survey waves, there were slight variations in the wording of the survey questionnaires, which may have affected our findings. Moreover, the findings cannot be generalised for all women, as the study is limited to ever-married women of reproductive age. Finally, this study did not examine causes for BMI and its variations over the survey rounds.
Conclusions
There is an epidemiological shift in the BMI of women of reproductive age in Bangladesh. Although the prevalence of underweight among reproductive-aged women has declined substantially over the study period, it remains a persistent concern in rural areas. In contrast, obesity has increased markedly nationwide, with the sharp rise especially in urban areas. Our findings underscore the critical need for targeted public health interventions that address the dual challenge of persistent undernutrition in rural areas and the rapidly escalating epidemic of overweight/obesity, particularly in urban settings.
Supplementary material
For supplementary material accompanying this paper visit https://doi.org/10.1017/S1368980026103632
Acknowledgements
The authors acknowledged the MEASURE DHS archive for granting the permission of data download, modify and implementation in the journal article. The authors also recognise the support of the School of Psychology and Public Health at La Trobe University and Department of Psychology and Counselling at Universiti Malaysia Terengganu, where the study was designed jointly.
Financial support
This research received no specific grant from any funding agency, commercial or not-for-profit sectors.
Competing interests
There are no conflicts of interest.
Author contributions
Conceptualisation: MAB and MMI conceptualised the study. MAB conducted the data analysis, while MMI supervised the process. MAB and SA contributed to draft the initial manuscript. MMI and SA provided critical review, edited the manuscript and finalised it. All the authors of the manuscript are reviewed and consented for the publication.
Ethical standards
This study was conducted according to the guidelines laid down in the Declaration of Helsinki, and all procedures involving research study participants were approved by the ORC Macro Institutional Review Board. Written informed consent was obtained from all subjects/patients before the enrolment.
This study data sourced from a MEASURE DHS, freely available at https://dhsprogram.com/.
The dataset can be downloaded after registering with the MEASURE DHS at https://dhsprogram.com/data/available-datasets.cfm.




 Open access

