





Introduction
Sustainable agricultural land use and cropping systems are critical to support human well-being, soil health, and biodiversity, which form the foundation for social and political initiatives related to the European Union’s (EU) Green Deal for food systems and a transition toward agroecology (Lehmann et al., Reference Lehmann, Bossio, Kögel-Knabner and Rillig2020; Peeters et al., Reference Peeters, Lefebvre, Balogh, Barberi, Batello, Bellon, Gaifami, Gkisakis, Lana, Migliorini, Ostermann and Wezel2020; Yang, Siddique and Liu, Reference Yang, Siddique and Liu2020; Boix-Fayos and de Vente, Reference Boix-Fayos and de Vente2023). Yet, in many regions, a strategy of simplification characterized by monoculture production and short crop rotations proliferates. Although various soil conservation practices, including perennial plantings and diverse crop rotations, could sustain agricultural production into the future, socio-economic factors, including land ownership, could undermine their adoption (Kabubo-Mariara, Reference Kabubo-Mariara2007).
Land tenure and environmental sustainability
Land managed under rental agreements is high in many regions of the world. In the EU, rented agricultural land has increased by 10% over the past two decades (Fig. 1). Germany and France have exceeded 50% rental shares for agricultural land, which, according to Leonhardt, Braito and Penker (Reference Leonhardt, Braito and Penker2021), is driven by farm expansions and highly competitive land sale markets. This reflects a shift away from traditional family farming, implying that the owner and manager of the farmland are often no longer the same. Understanding the effects of this structural development for land management decisions and their potential environmental implications is important to ensure long-term sustainable agricultural land management.
Percent change in rented agricultural land (ha/farm) in Europe between 2004 and 2020 (FADN, 2023).

Figure 1. Long description
A bar chart with the Y axis labeled Percent change in rented agricultural land (ha forward slash farm) ranging from minus 50 to 50 and the X axis labeled European countries. The bars are color-coded in a rainbow gradient from dark purple on the left to dark red on the right.
* The E U dash 28 average shows a slight positive increase of approximately 10 percent.
* Bulgaria shows the highest positive increase, exceeding 75 percent.
* Romania also shows a significant increase of approximately 65 percent.
* Croatia and Italy show moderate increases between 25 and 50 percent.
* Slovakia shows the most significant decrease, dropping nearly 45 percent.
* Czechia, Hungary, Malta, and Portugal also show negative changes ranging from approximately minus 5 to minus 20 percent.
* Most other countries, including Denmark, Austria, Belgium, Estonia, Finland, France, Germany, Greece, Latvia, Lithuania, Luxembourg, Netherlands, Poland, Slovenia, Spain, and Sweden, show positive increases between 5 and 25 percent.
* Ireland and the United Kingdom show negligible changes near the zero baseline.
Land tenure has been considered a potential variable in the adoption of environmental practices, but previous studies have been ambiguous in their findings, with a minor tendency toward it being identified as a barrier (Lastra-Bravo et al., Reference Lastra-Bravo, Hubbard, Garrod and Tolón-Becerra2015). Although scholars indicate that rented land may be associated with soil degradation, a study in Austria found no difference between leased and owned cropland in their use of 16 soil conservation practices (Leonhardt, Braito and Penker, Reference Leonhardt, Braito and Penker2021). A global-scale literature review highlighted important dynamics between increased larger-scale contract farming and a shift in agency over land management decisions in the agricultural sector over the past two decades, which can limit land degradation neutrality (Debonne et al., Reference Debonne, van Vliet, Metternicht and Verburg2021). Another systematic assessment of long-term trends and dimensions that link climate change and land tenure in agricultural systems found limited studies in Europe relating land tenure with land use and crop type (Murken and Gornott, Reference Murken and Gornott2022). Thus, environmental implications of trends toward more leased compared to owner-operated agricultural land in the European context remain largely uncertain.
Denmark, like many European countries, experienced a long regime of agricultural land management characterized by intensification (1875–1945) and industrialization (1945–1985) that led to a present regime of environmental awareness (Jepsen et al., Reference Jepsen, Kuemmerle, Müller, Erb, Verburg, Haberl, Vesterager, Andrič, Antrop, Austrheim, Björn, Bondeau, Bürgi, Bryson, Caspar, Cassar, Conrad, Chromý and Daugirdas2015). Participation in agri-environment policy schemes has been increasingly encouraged in Europe since the 1990s whereby farmers are paid to implement practices that benefit the environment. Providing compensation for forgone profit and loss of production is meant to enhance biodiversity, conservation, or carbon sequestration. Examples include setting aside land or establishing permanent grass fields, rewetting peatland, incorporating flower mixes, and various other practices. Due to the voluntary nature of most agri-environmental schemes, these efforts have largely been insufficient to create the necessary scale of change to produce food within planetary boundaries (Campbell et al., Reference Campbell, Beare, Bennett, Hall-Spencer, Ingram, Jaramillo, Ortiz, Ramankutty, Sayer and Shindell2017). The EU Nature Restoration Law introduces both legally binding measures and voluntary actions by agricultural landowners and managers to further support biodiversity and carbon storage (Hering et al., Reference Hering, Schürings, Wenskus, Blackstock, Borja, Birk, Bullock, Carvalho, Dagher-Kharrat, Lakner, Lovrić, McGuinness, Nabuurs, Sánchez-Arcilla, Settele and Pe’er2023). Given increasing changes in who owns agricultural land, understanding current environmental policy enrollment trends on leased land is important to support sustainable agricultural land use.
The Danish agri-food system is an interesting case to study the effects of land ownership, due to the intensive crop and livestock production in combination with ambitious green transition policy objectives (e.g., a newly agreed GHG tax on livestock producers, allocations of public payments for green technologies, land restoration, and production of plant proteins; Danish Economic Ministry, 2024). Historically, ownership has been an important source of wealth and status, and more recently also coupled with opportunities for obtaining Industrial Emissions Directive (IED) permits (Grivins, Thorsøe and Maye, Reference Grivins, Thorsøe and Maye2021). Further, ownership of farmland is also used as collateral when obtaining mortgages or investment capital (Thorsøe and Noe, Reference Thorsøe and Noe2023). Therefore, access to land and ownership of farmland have been important for Danish farmers and has resulted in farmland prices that can exceed the productive value of the land (Kærgård and Dalgaard, Reference Kærgård and Dalgaard2014). Due to a period of declining land prices in the 15 years following the 2007 financial crisis where retiring farmers were unable or unwilling to sell their land together with a liberalization of the land access rules, Denmark like other countries in Europe has witnessed an increase of 19% in leased agricultural land between 2004 and 2020 (Daugbjerg et al., Reference Daugbjerg, Andersen, Hansen, Jacobsen, Christiansen, Elklit and Nedergaard2020; Thorsøe and Noe, Reference Thorsøe and Noe2023; Fig. 1). With a unique record of farm activity data, Denmark stands out as a country that offers a good opportunity to study the effects of a higher proportion of leased land.
Perennial crops, land tenure, and the green transition
In the literature, there is some evidence that long-term practices and perennials are more prominent on owner-operated land, such as tree plantings that can provide a host of ecosystem services (Asbjornsen et al., Reference Asbjornsen, Hernandez-Santana, Liebman, Bayala, Chen, Helmers, Ong and Schulte2014; Leonhardt, Braito and Penker, Reference Leonhardt, Braito and Penker2021). In Denmark, surveys have shown that land tenure agreements were seen by some farmers as a barrier to long-term decision-making, especially for tree planting and participation in long-term agri-environmental schemes (Iversen, Dalgaard and Graversgaard, Reference Iversen, Dalgaard and Graversgaard2024).
In addition to differences in the types of agricultural production, land tenure may also relate to physical field characteristics. For example, the Farmland Rental Paradox finds that small parcels tend to create large production blocks through land leasing that can result in long-term unsustainable land management (Sklenicka et al., Reference Sklenicka, Janovska, Salek, Vlasak and Molnarova2014). Further exploration into the influence of land ownership dynamics and land uses across broad categories (e.g., rotated crops, forestry, environmental policies) by field scale in Denmark could contribute to the development of more targeted agricultural land use strategies, illuminating effective pathways toward a green transition.
Annual crop rotations, land tenure, and the green transition
In Denmark and many other countries in Europe, croplands are widespread and primarily in annually rotated cropping systems (Phalke et al., Reference Phalke, Özdoğan, Thenkabail, Erickson, Gorelick, Yadav and Congalton2020; Table 1). More diverse cropping systems through rotation or intercropping can provide a host of ecosystem services by controlling pests, reducing disease pressure, and sustaining soil health and productivity (Yang, Siddique and Liu, Reference Yang, Siddique and Liu2020; Baldwin-Kordick et al., Reference Baldwin-Kordick, De, Lopez, Liebman, Lauter, Marino and McDaniel2022) Including legumes in crop rotations can provide additional environmental benefits by provisioning plant-based proteins, reducing carbon footprint and nitrogen leaching (Yang, Siddique and Liu, Reference Yang, Siddique and Liu2020). This makes legumes important to incorporate from an environmental policy perspective despite barriers due to lacking markets and food system infrastructure for grain legume–cereal intercrop products (Jensen et al., Reference Jensen, Chongtham, Dhamala, Rodriguez, Carton and Carlsson2020; Ferreira, Pinto and Vasconcelos, Reference Ferreira, Pinto and Vasconcelos2021). A better understanding of the influence of land tenure on crop rotation characteristics could provide important insights into effective environmental policies in the context of the green transition.
Danish agricultural land area for nine aggregated use categories in 2021 (Danish Agricultural Agency, 2023)—see more regarding aggregation methods in Section “Data preparation”

Table 1. Long description
The table consists of two columns: Agricultural land use categories and Area in hectares (percent). The data is organized as follows:
* Agroforestry: 363 (0.02 percent)
* Energy forestry: 7,994 (0.33 percent)
* Forestry: 47,275 (1.97 percent)
* Environmental: 143,171 (5.95 percent)
* Fruits: 3,499 (0.15 percent)
* Other: 109,865 (4.57 percent)
* Grass, permanent: 159,239 (6.62 percent)
* Grass, rotation: 234,734 (9.76 percent)
* Rotated crops: 1,698,302 (70.63 percent)
Study aims
This study aims to assess field-scale differences between owner-operated and leased agriculture lands and their implications for the green transition using Denmark as a case study (Fig. 2). This study is focused on three research questions:
-
1. How does agricultural land use differ across broad land-use categories (e.g., agroforestry, energy forestry, environmental classification, forestry, fruits, other, permanent grass, rotated crops, rotated grass) between owned and leased land?
-
2. Do crop rotations vary based on the number of distinct crop categories (e.g., cereal grains, maize, potatoes, legumes, intercropping) over 7 years (2015–2021; i.e., rotation length) between owned and leased land?
-
3. What are the green transition implications for differences in field-scale agricultural land use by owned and lease status?
Hypotheses for owned and lease agricultural field conditions and strategies and measurable potential effects related to land use and crop rotations.

Figure 2. Long description
The flowchart is organized into two horizontal rows representing land types and four vertical columns.
1. Land Type (Far Left):
- Top row: A blue square labeled Owned agricultural land.
- Bottom row: A red square labeled Leased agricultural land.
2. Conditions (Field characteristics):
- Owned land points to a green oval: Smaller and irregular shape.
- Leased land points to a green oval: Larger and regular shape.
3. Strategies (Economics and Planning):
- Owned land leads to two purple ovals: Soil health orientation (Economics) and Long-term plans (Planning).
- Leased land leads to two purple ovals: Profit orientation (Economics) and Near-term plans (Planning).
4. Effects (Land use and Crop rotations):
- Owned land results in two yellow ovals: More long-term cover (Land use) and More legumes and intercrops (Crop rotations).
- Leased land results in two yellow ovals: More in crop rotations (Land use) and More cereals (Crop rotations).
As sustainable management of agricultural land by increasing biodiversity, perennial plantings, and diversified crop rotations is critical to climate change mitigation and to support the green transition in Europe, understanding how land tenure impacts agricultural land use is an important research gap addressed by this study and could inform theoretical and political underpinnings for a transition toward sustainable agricultural land use and resilient agroecological food systems.
Methods
This study uses Danish register agricultural data on field scale for 2015–2021 (Danish Agricultural Agency, 2023) and farm scale for 2021 combined with data on land ownerships for 2021 (OIS—the public information server; Geodata agency). The data contains a detailed registry of farm activity data at field scale to understand how agricultural fields are used based on whether they are farmed by the owner or leased in 2021 (Fig. 3). This national scale study includes 2.5 million hectares of agricultural fields across Denmark and was supported by crop rotation data from the years 2015 to 2021. The trace back in time was calculated based on the center point of the field in 2021. To this point, crop type in previous years was extracted. Although field boundaries can change over time, as we are going back 7 years, this is a relatively minor source of error given the number of fields assessed. The field data was mapped in ArcGIS pro (ESRI, 2023). Approximately 59% of agricultural land in Denmark (1.56 million ha) was classified as owner operated. While 32% of agricultural land was leased (847,000 ha), an additional 9% could not be classified (252,000 ha) but is likely also leased land. These assessments omit the 9% of agricultural land that could not be definitively classified in the data.
Map of agricultural fields in Denmark included in this study color-coded by owned-operated and leased status.

Figure 3. Long description
A geographical map of Denmark displays agricultural land tenure for 2021. The map is densely populated with small color-coded pixels representing individual fields.
At the top right, a legend box titled Agricultural land tenure map in Denmark (2021) defines three categories:
* Dark blue represents Owner operated at 59 percent.
* Yellow represents Leased (confirmed) at 32 percent.
* Pink represents Leased (unconfirmed) at 9 percent.
Spatial distribution:
* The dark blue owner-operated fields are the most prevalent and are distributed relatively evenly across the Jutland peninsula and the larger islands of Funen and Zealand.
* Yellow leased fields appear in smaller clusters interspersed among the blue areas, with notable concentrations in central and northern Jutland.
* Pink unconfirmed leased fields are the least frequent, appearing as sparse dots throughout the agricultural zones.
Geographical markers include major cities labeled across the map: Aalborg in the North, Viborg and Aarhus in Central Jutland, Esbjerg and Vejle in the West and South, Odense on Funen, and Copenhagen and Hillerød on Zealand.
In the bottom left, a scale bar indicates distances from 0 to 150 Kilometers. A North arrow is located in the top right corner. The base map credits include Esri, H E R E, Garmin, and U S G S.
Data preparation
Prior to the statistical analysis, field and farm variables and ownership data were combined into one master table, with agricultural fields as a unique identifier (Table 2). The field variables were extracted from the Danish Agricultural Agency for 2015–2021. All Danish farmers must each year report their main crop on each of their fields when they apply for Basic Income Support for Sustainability (BISS; previously Direct Income Support). These field-register data are then hosted by the Danish Agricultural Agency, where all reported data are linked to spatially explicit field polygons together with information on farm register number and are freely available for download (Danish Agricultural Agency, 2023). Furthermore, the geographical agricultural field boundaries were included to calculate field characteristics and topology. There are approx. 350 recognized crop types in Denmark. These were aggregated into nine agricultural production categories (Table 1), which were assessed in the Agricultural land use statistical model (Table 2). Three forest categories included: ‘Agroforestry’ (trees integrated with another crop or animal farming system) for food production, ‘Energy forestry’ (trees used in the energy sector), and ‘Forestry’ (all other types of tree production). The ‘Environmental’ category includes a range of land uses under an environmental policy classification such as fallowing (flower plantings, pollinator habitats, pollination, or 20 year fallowing) mini wetlands, and other types of low input management (buffer zones and flower strips, permanent grasses for environmental protection-grass). Common for all land use in the ´Environmental´ category is that the area should continuously be kept in a good agricultural state including annual activities such as grazing or mowing. Hence, it is possible to take the area into production after the agreement has ended (periods being 1–5 years or 20 years as is the case for long fallowing). If the area becomes a protected nature area with red-list species, the rules change as does the classification as agricultural land. The category ‘Fruits’ consists of both trees (e.g., apple, plum) and other perennial and biannual plant types (e.g., berries, grapes). However, strawberries (commonly grown as an annual), asparagus (a perennial vegetable), and production of seeds were included within the category ‘Other.’ ‘Grass, permanent’ included agricultural pastures with grasses that are not on cropland, and ‘Grass, rotation’ included areas with grasses grown on cropland. ‘Rotated crops’ included barley, intercrops (primarily cereals with legumes), legumes, maize, mixed cereals, oats, oil crops, potato, root crops, rye, triticale, vegetables, and wheat (Table 2).
Summary statistics for describing the variables used as inputs to the two statistical models in this study: Agricultural land use (ALU) 2021, and Rotated land use (RLU) 2015–2021

Table 2. Long description
The table contains five columns and eleven rows of data.
* Land tenure binary (Categorical, Field level): For A L U, Owner operated is 349,236 (66.85 percent) and Leased is 173,176 (33.15 percent). For R L U, Owner operated is 197,240 (63.73 percent) and Leased is 112,253 (36.27 percent). Used as A L U independent and R L U fixed effect.
* Region (Categorical, Field level): Major regions include Central Denmark (A L U 40.76 percent, R L U 43.62 percent) and South Denmark (A L U 32.75 percent, R L U 23.33 percent). Used as A L U random effect and R L U fixed effect.
* Agricultural land use categories (Categorical, Field level): Largest categories are Rotation (46.97 percent) and Permanent Grass (19.27 percent). Used as A L U fixed effect.
* Rotation crop categories (Categorical, Field level): Top crops include Barley (23.64 percent) and Wheat (16.54 percent). Used as R L U fixed effect.
* Area (Continuous, Field level): Mean 4.606, Median 2.390, Range 0.010 to 714.320. Used as A L U fixed effect.
* Perimeter/Area (Continuous, Field level): Mean 538.61, Median 333.79. Used as A L U fixed effect.
* Rotation length (Continuous, Field level): Mean 2.497, Range 1 to 7. Used as R L U fixed effect.
* Rotated crop category inclusion (Continuous, Field level): Mean 2.482, Range 1 to 7. Used as R L U fixed effect.
* Farm management type (Categorical, Farm level): Conventional (97.88 percent) and Organic (2.12 percent). Used as R L U fixed effect.
* Farmer occupation (Categorical, Farm level): Full time (65.62 percent), Part-time (28.43 percent), and Hobby (5.95 percent). Used as R L U fixed effect.
* Farm type (Categorical, Farm level): Crop (45.65 percent), Mix (40.71 percent), and Livestock (13.64 percent). Used as R L U fixed effect.
Note: See Table 1 for the number of hectares in each category.
For the Rotated Land Use statistical model, only the ‘Rotated crops’, ‘Environmental’, and ‘Grass, rotation’ from the Agricultural Land Use statistical model were included. A new category called ‘Other crops’ was also added to address land in transition during the 7 year rotation period assessed. As all agricultural land with rotated crops in the 7-year rotation were included, land that transitioned in or out of perennial land use during this period were included as ‘Other crops,’ as perennial land categories were not included as specific categories in this analysis. For each unique crop category within the Rotated Land Use subset, a 7-year rotation (2015–2021) was counted to assess rotation length. The number of times each crop category was included in the same 7-year rotation was counted to determine which crop categories were prioritized within rotations. The farm data were obtained from the Central Livestock Register (Danish Veterinary and Food Administration) for 2021. Farm and field scale data were joined using the common farm register number from the field and farm data. Finally, data on land ownership were compiled on field scale by linking the field register data and data from the register of ownership (OIS—the public information server) and the Danish cadaster map (Geodata agency) for 2021. Farm-level variables were included in the rotation model (Table 2). The four interactions at the farm scale included in this analysis were: Danish region, farm management type, farmer occupation, and farm type (Table 2). However, there were missing farm-level data, which were omitted from the Rotated land use statistical model, including 1,440 fields that could not be classified for any farm variable (0.47% of all fields) and 41,061 fields that could not be classified for farm type and farmer occupation (13.27% of all fields).
Statistical modeling
Two Generalized Linear Models were developed to assess the relationship between owner-operated and lease status, and the field scale factors across agricultural land use categories and the field and farm scale factors within a 7-year crop rotation (2015–2021; Fig. 4). The models were developed in R using the glmmTMB package (Brooks et al., Reference Brooks, Kristensen, van Benthem, Magnusson, Berg, Nielsen, Skaug, Mächler and Bolker2017). To address the first research question, an Agricultural Land Use binomial model with owner operated (0) and leased (1) as the explanatory variable was developed. This model incorporates field level factors and assesses whether agricultural land use categories, field area, and field perimeter per area can predict the land ownership binary (Fig. 4). Regional differences were accounted for as a random effect within this statistical model (Table 2).
Schematic of the two statistical models: Agricultural land use and Rotated land use in relation to the research questions addressed and the variables included.

Figure 4. Long description
The diagram is divided into two horizontal sections under the title Statistical Models Assessed.
Top section: Agricultural Land Use A L U.
* Research Question 1: How does agricultural land use differ across broad land-use categories between owned and leased land?
* Variables from left to right:
1. Independent variable (yellow rounded rectangle): Owned 0 or Leased 1 field binary.
2. Fixed dependent variables (teal ovals): Agricultural land use categories, Field area, and field perimeter/area.
3. Random dependent variable (purple oval): Region.
Bottom section: Rotated Land Use R L U.
* Research Question 2: Do crop rotations vary based on the number of distinct crop categories over seven years 2015-2021 between owned and leased land?
* Variables from left to right:
1. Independent variable (yellow rounded rectangle): Years of crop category inclusion in 7-year rotation.
2. Fixed dependent variables (teal ovals): Rotation crop categories, Owned 0 or Leased 1 field binary, Rotation length, and Farm variables including Farm management, Farm occupation, and Farm type.
3. Random dependent variable (purple oval): Region.
Right-side sidebar:
* Legend: Yellow rectangle for Independent variable, teal circle for Fixed dependent variables, and purple circle for Random dependent variables.
* A L U binomial model equation: Land tenure binary is proportional to Agricultural land use categories plus field area plus field perimeter/area plus Random effect: Region.
* R L U truncated negative binomial model equation: Inclusion in rotation over seven years is proportional to Rotation crop categories plus Land tenure binary plus Rotation length plus Farm Management type plus Farmer occupation plus Farm type plus Random effect: Region.
To address the second research question regarding rotated crops, a truncated negative binomial model was developed with the years of inclusion in a 7-year rotation as the explanatory variable (Fig. 4). This Rotated land use statistical model assessed the effect of tenure on what crop categories are included in crop rotations over a 7-year rotation. A truncated model was used because all the crop categories with 0 years of inclusion were omitted, so the full distribution of values for each crop category inclusion was between 1 and 7. This model includes additional annually rotated crop categories over 7 years, owner-operated or lease status, and farm-scale variables (management, occupation, type) and regional differences were accounted for (Table 2). To understand more holistically the influence of field-scale factors, field size and field perimeter were also included in the model in addition to the agricultural land use categories. The inclusion of regions as a fixed effect was tested, but they were not significantly different, so this variable was instead included as a random effect. Danish farm-level variables were included as fixed effects in the rotation model to help isolate the impact of land tenure (Fig. 4).
Results
Land tenure impacts on agricultural land use
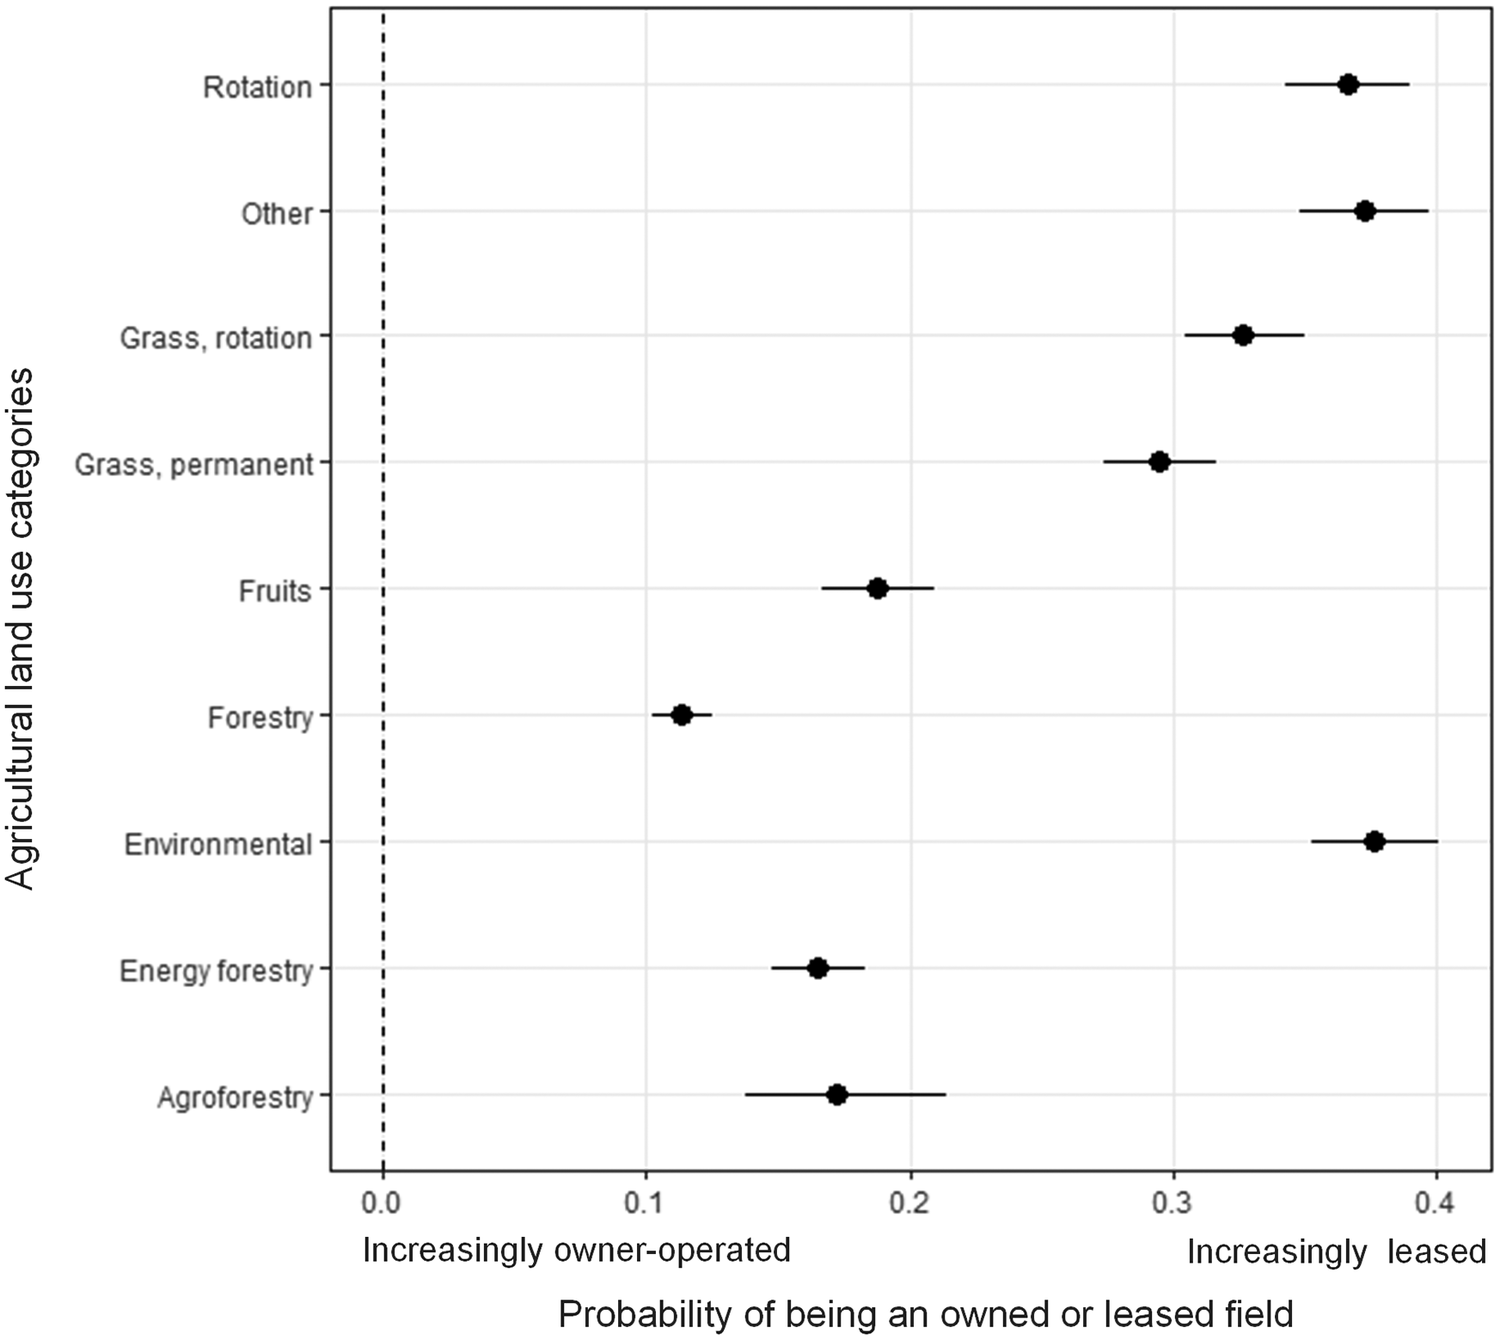
In this section, results from the Agricultural Land Use statistical model are explored. In this model, all categories were significantly different from each other (p < .0001) based on owned and leased status except for (1) agroforestry, energy forestry, and fruit production and (2) rotation and other (Fig. 5). The agricultural land with the highest probability of being leased was land under the environmental policy category (0.376), other land uses (0.372), and land in crop rotations (0.366), followed by rotated and then permanent grass (Fig. 5). All types of tree production had the highest probability of being on owner-operated land compared to the other agricultural land use categories. Within the tree production, forestry had the lowest likelihood of being on leased land (0.113), followed by energy forestry (0.165), agroforestry (0.172), and fruit production (0.188). However, forestry was the only category statistically significantly different from the other tree-production land uses (Fig. 5).
A forest plot identifying which agricultural land use categories are more likely to be owned compared to leased on a scale of 0 (all fields owner-operated) to 1 (all fields leased), data from 2021. The bars represent a 95% confidence interval around each probability estimate.

Figure 5. Long description
A forest plot with the Y-axis labeled Agricultural land use categories and the X-axis labeled Probability of being an owned or leased field. The X-axis ranges from 0.0 Increasingly owner-operated to 0.4 Increasingly leased. A vertical dashed line is at 0.0. Data points are shown as black dots with horizontal error bars representing 95 percent confidence intervals. From top to bottom, the categories and their approximate probabilities are
* Rotation: 0.37
* Other: 0.37
* Grass, rotation: 0.33
* Grass, permanent: 0.29
* Fruits: 0.19
* Forestry: 0.11
* Environmental: 0.38
* Energy forestry: 0.17
* Agroforestry: 0.17 with the widest confidence interval ranging from 0.14 to 0.21.
Approximately 70% of owner-operated and leased agricultural land areas are managed in annual crop rotations, with a marginally higher percentage on leased land (Fig. 6). The next largest agricultural land use category after crop rotations are grass rotations (6.7% owned, 3.0% leased), followed by permanent grass (4.5% owned, 2.1% leased), and land managed under agri-environmental schemes (3.4% owned, 2.5% leased; Fig. 6). A relatively small land area (2.1% owned, 0.3% leased) is used for tree production through agroforestry, energy forestry, forestry, or fruit production (Fig. 6). Differences in the distribution of perennial land uses between owned and leased fields become more apparent when these categories are shown separately, as their relatively small areas are difficult to discern when displayed alongside annual land uses (Fig. 7). In terms of land area where the largest agricultural land use category is permanent grass (4.5% owned, 2.1% leased; Fig. 7). More owned land areas and higher percentages of this area are used for all categories related to forestry (agroforestry, energy forestry, forestry) and for permanent grass and land for environmental purposes.
Percentage of land area (ha) in each category of owned and leased land by broad agricultural land use categories, data from 2021.

Figure 6. Long description
A stacked bar chart with the Y axis labeled Percent of Area h a ranging from 0.00 to 1.00. The X axis compares two categories: Owned and Leased.
For Owned land, the segments from bottom to top are:
* Rotation: approximately 0.70
* Other: 0.04
* Grass, rotation: 0.10
* Grass, permanent: 0.07
* Forestry: 0.03
* Environmental: 0.05
* Energy forestry: less than 0.01
For Leased land, the segments from bottom to top are:
* Rotation: approximately 0.72
* Other: 0.05
* Grass, rotation: 0.08
* Grass, permanent: 0.07
* Environmental: 0.07
* Forestry: less than 0.01
The legend on the right identifies nine Ag land categories: Agroforestry (pink), Energy forestry (purple), Environmental (green), Forestry (maroon), Fruits (yellow), Grass, permanent (teal), Grass, rotation (light blue), Other (grey), and Rotation (dark blue).
Area of perennial agricultural land use by land tenure and category and their share of total area of owned and leased land, respectively (Fig. 6), data from 2021.

Figure 7. Long description
The Y-axis represents Area in hectares (h a) ranging from 0 to 90000. The X-axis categorizes land by tenure: Owned and Leased. A legend on the right identifies seven perennial land categories: Agroforestry (pink), Energy forestry (purple), Environmental (dark green), Forestry (maroon), Fruits (yellow), Grass, permanent (teal), and Other (light gray).
In the Owned category:
* Agroforestry: 0 percent.
* Energy forestry: 0.3 percent.
* Environmental: 3.4 percent.
* Forestry: 1.7 percent.
* Fruits: 0.1 percent.
* Grass, permanent: 4.5 percent (highest peak, exceeding 90000 h a).
* Other: 2.8 percent.
In the Leased category:
* Agroforestry: 0 percent.
* Energy forestry: 0.1 percent.
* Environmental: 2.5 percent (highest peak in this group, approximately 60000 h a).
* Forestry: 0.2 percent.
* Fruits: 0 percent.
* Grass, permanent: 2.1 percent.
* Other: 1.7 percent.
Overall, the total area for all categories is significantly higher for owned land than for leased land.
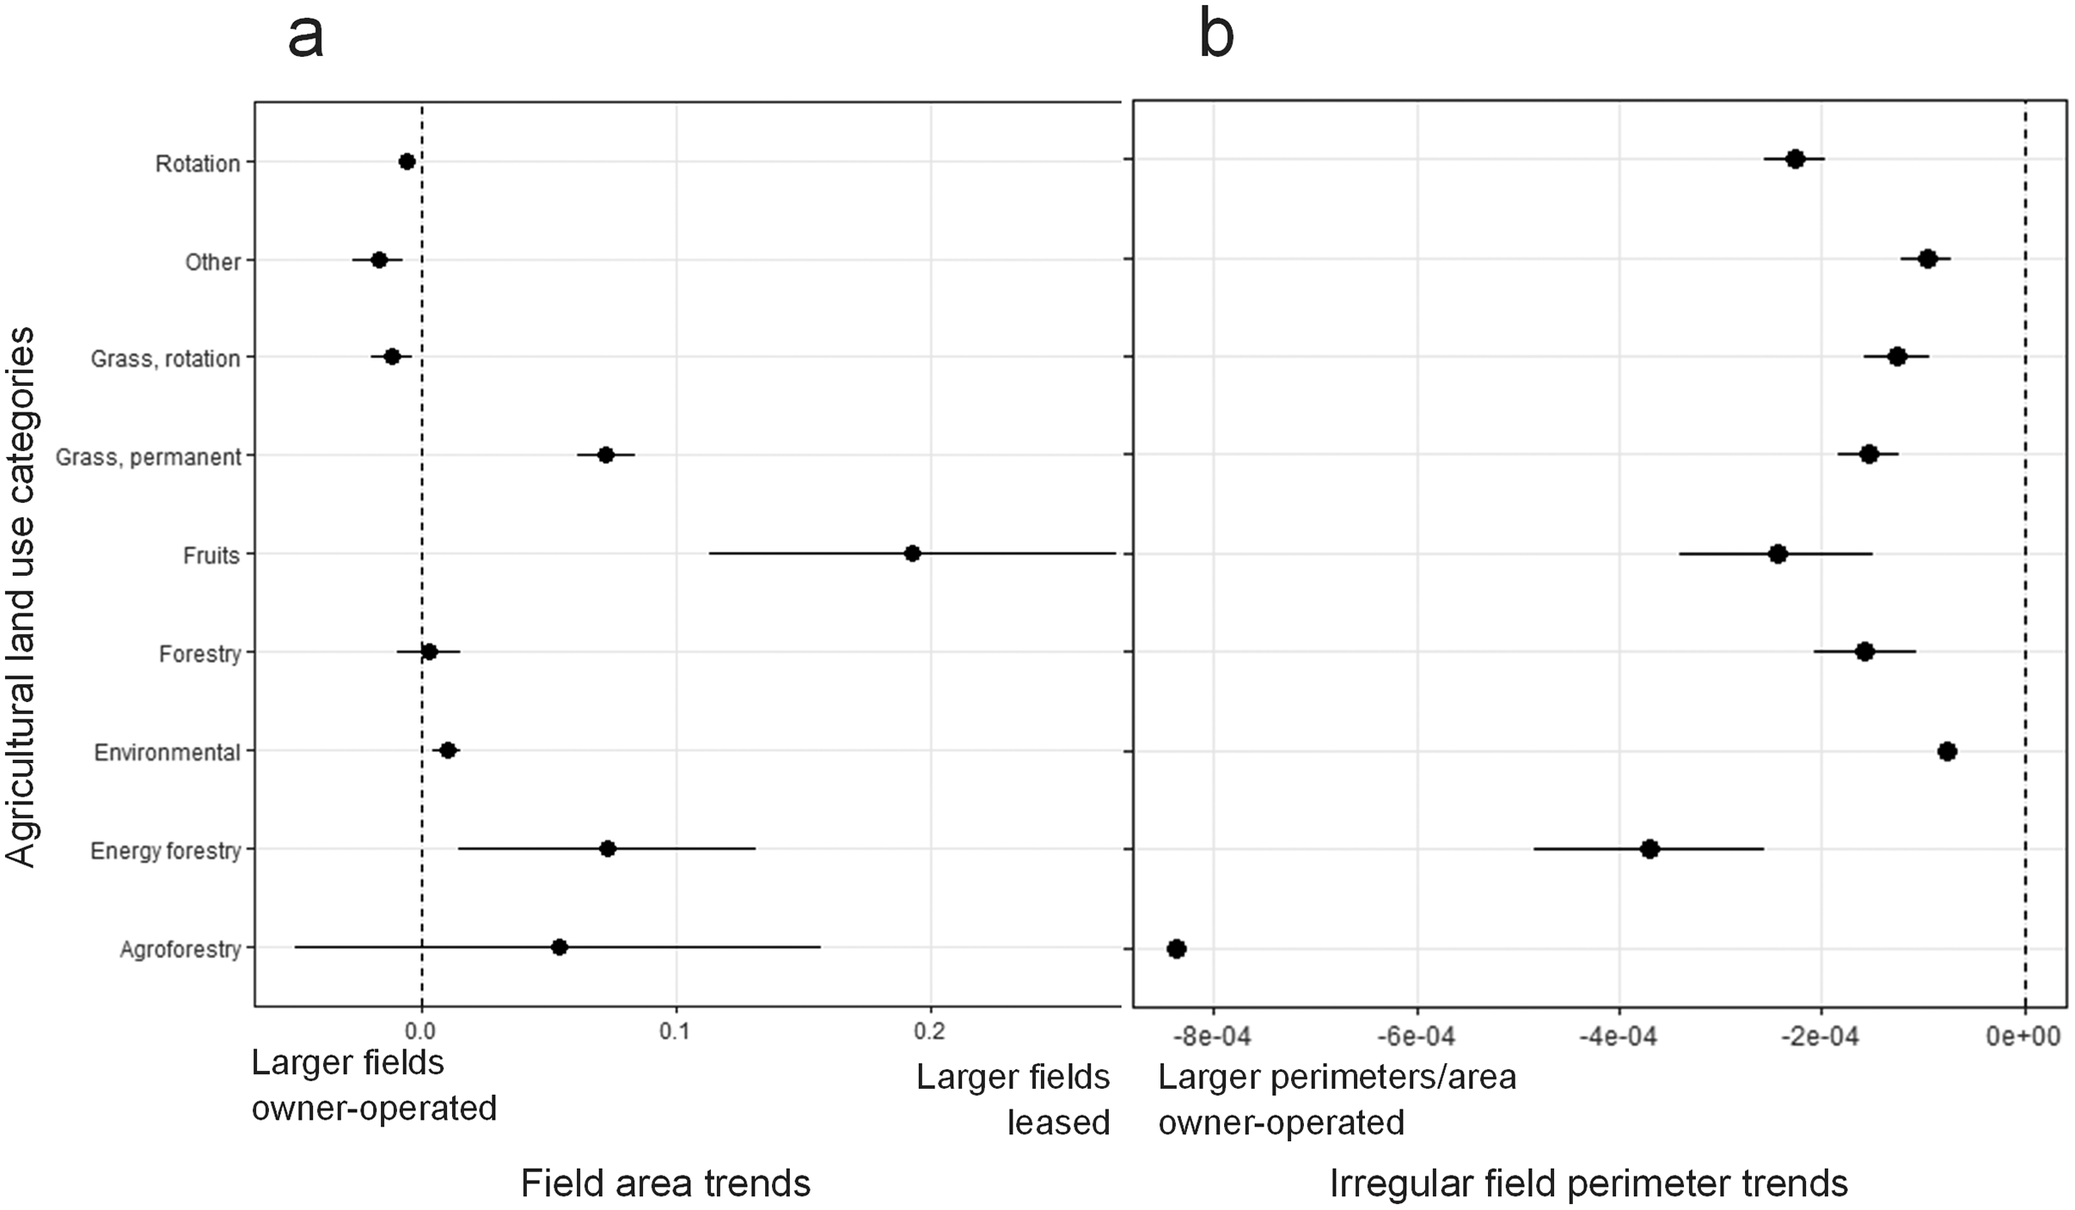
The broad agricultural land use linear model also found that field area and perimeter by field area were different based on owned and leased status (>0.001). Although there was a statistical difference, and owner-operated land had larger perimeter per field areas across all broad land use categories, the absolute differences for owner-operated fields with crop rotations, other land uses, and rotated grass were slightly larger than leased fields (Fig. 8a). Conversely, leased fields were larger than owner-operated fields for tree production (fruits, energy forestry, agroforestry), permanent grass, and land under environmental policies. Increasingly irregular fields (i.e., Fields with larger perimeter by area) are more likely to be owner-operated for all categories (Fig. 8b).
Forest plots of (a) Field area (in ha), (b) Field perimeter by field area (in m/ha) increase trends by agricultural land use category with the dashed line representing the point where there is equal probability that larger field areas and field perimeters per area are owned or leased. Negative numbers indicate larger area/perimeter are owned and positive numbers indicate larger area/perimeter are leased. For (b) scientific notation is used as the trend highlights very small differences. The bars represent a 95% confidence interval around each probability estimate. All data are from 2021.

Figure 8. Long description
A two-panel forest plot. The y-axis for both panels lists nine agricultural land use categories from top to bottom: Rotation, Other, Grass, rotation, Grass, permanent, Fruits, Forestry, Environmental, Energy forestry, and Agroforestry.
Panel a, titled Field area trends, has an x-axis ranging from minus 0.1 to 0.3. A vertical dashed line at 0.0 represents equal probability. Data points to the left indicate larger fields are owner-operated; points to the right indicate larger fields are leased.
- Rotation, Other, and Grass, rotation are slightly left of the line.
- Forestry and Environmental are centered on or very near the line.
- Grass, permanent, Fruits, Energy forestry, and Agroforestry are to the right, with Fruits showing the largest positive trend and widest confidence interval.
Panel b, titled Irregular field perimeter trends, uses scientific notation on the x-axis from minus 8e minus 04 to 0e plus 00. All data points and their 95 percent confidence intervals fall to the left of the zero dashed line, indicating larger perimeters per area are consistently owner-operated across all categories.
- Agroforestry is the furthest left outlier at approximately minus 8.2e minus 04.
- Environmental is the closest to the zero line on the far right of the data spread.
Land tenure impacts on crop rotation length
In this section, results from the Rotated Land Use statistical model are explored. This more specialized model was developed because the majority of agricultural land in Denmark is managed under a rotation (70%, Table 1), and the green transition impacts of these lands need to be understood by crop type and across time (in this case, we assess a 7-year period). In Denmark, typical crop rotations vary by farming system. In dairy systems, rotations often emphasize roughage like maize, grass beet, and grass combinations, and thus not a lot of fields are available for rotation. Farms focused on crop production typically rotate wheat, seed crops, and oil crops. Other crops require specialized systems (e.g., potatoes, some vegetables), and the few farmers who grow these often contract with a company or invest in specialized equipment. Pig farmers often grow barley, which is also used for contracts with beer producers.
For many of the rotated crop categories, there were no statistically significant differences based on land tenure over the 7-year crop rotation assessed (2015–2021; Fig. 9). Grass rotations, legumes, intercrops, potatoes, root crops, vegetables, triticale, and wheat all had no detectible difference between their inclusion based on land tenure. Rye, maize, and oil crops were included more in rotations on leased land. Barley, environmental, mixed cereals, oats, and others were more likely to be included in rotations on owner-operated land.
Differences in the time each rotation crop category are included in a 7-year rotation (2015–2021) based on owner-operated (black) and lease status (blue). The bars represent a 95% confidence interval around each probability estimate. *** indicates the crop categories with statistically significant differences between owned and leased inclusion (<0.001).

Figure 9. Long description
A horizontal dot plot with the Y-axis listing Rotated crop categories and the X-axis showing Probable years of inclusion in a seven-year-rotation from 0 to 3. A legend at the top identifies black dots as Owned and blue dots as Leased.
From top to bottom, the categories and their approximate values are:
* Wheat: Both near 2.2.
* Vegetables: Owned at 1.7, Leased at 1.8.
* Triticale: Leased at 1.0, Owned at 1.1.
* Asterisk Asterisk Asterisk Rye: Owned at 1.7, Leased at 1.8.
* Root crops: Both near 0.8.
* Potato: Both near 1.0.
* Asterisk Asterisk Asterisk Other: Leased at 1.2, Owned at 1.3.
* Asterisk Asterisk Asterisk Oil crops: Owned at 0.4, Leased at 0.45.
* Asterisk Asterisk Asterisk Oat: Leased at 0.7, Owned at 0.75.
* Mix cereals: Leased at 0.7, Owned at 0.85.
* Asterisk Asterisk Asterisk Maize: Owned at 2.4, Leased at 2.45.
* Legumes: Both near 0.3.
* Intercrops: Both near 0.45.
* Grass, rotation: Both near 2.4.
* Asterisk Asterisk Asterisk Environmental: Leased at 2.9, Owned at 3.1.
* Asterisk Asterisk Asterisk Barley: Leased at 2.2, Owned at 2.3.
Horizontal error bars represent 95 percent confidence intervals. The triple asterisks denote statistically significant differences.
Land tenure impacts on crop rotation diversity
The farm-scale variables in the rotation model included farm management, farmer occupation, and farm type (Table 2). None of the farm-scale variables significantly interacted with the owned or leased status at the field scale. Across the 7-year rotation, there is no detectible difference for rotated crop choice based on owned or leased status at the field scale by inclusion in a 7-year rotation (Fig. 10).
Crop category inclusion over a 7-year crop rotation (2015–2021) period, with very small differences in inclusion between owned and leased agricultural fields.

Figure 10. Long description
The Y axis is labeled Percent of area and ranges from 0.00 to 1.00 in increments of 0.25. The X axis is labeled Owner-operated versus Leased land and contains two bars: Owned on the left and Leased on the right. A legend to the right titled Rotation categories lists sixteen items in a vertical color gradient from dark purple at the top to dark red at the bottom.
Both bars show nearly identical distributions of crop area. From the bottom of the bars moving upward, the categories and their approximate cumulative positions are:
* Wheat (dark red): 0.00 to 0.15
* Vegetables (red): 0.15 to 0.17
* Triticale (orange-red): 0.17 to 0.19
* Rye (orange): 0.19 to 0.25
* Root crops (light orange): 0.25 to 0.30
* Potato (yellow-orange): 0.30 to 0.35
* Other (yellow): 0.35 to 0.42
* Oil crops (light yellow): 0.42 to 0.54
* Oat (lime green): 0.54 to 0.60
* Mix cereals (green): 0.60 to 0.62
* Maize (teal): 0.62 to 0.69
* Legumes (cyan): 0.69 to 0.73
* Intercrops (light blue): 0.73 to 0.75
* Grass, rotation (blue): 0.75 to 0.82
* Environmental (dark blue): 0.82 to 0.85
* Barley (dark purple): 0.85 to 1.00
Discussion
This field-scale study assessed tenure dynamics’ influence on both broad agricultural land use categories and rotated crops in Denmark. Differences in how agricultural land is used were detected with more owner-operated land in perennial tree cover (e.g., forestry, fruit production; Section “Land tenure impacts agricultural land use especially perennial land covers”). However, for rotated crops, there were only slight variations in the number and types of crop categories selected in owner-operated compared with leased fields (Section “Land tenure does not largely impact crop rotation length or diversity”). These dynamics could have important implications for the green transition (Section “Green transition implications and future research”), and further research is necessary to better understand the influences of land tenure at the farm and landscape levels (Section “Study limitations”).
Land tenure impacts agricultural land use especially perennial land covers
We found that in Denmark, owner-operated fields were more likely to include tree production (agroforestry, energy forestry, forestry). Planting trees is perceived as a long-term investment, which may only benefit the next generation (Iversen, Dalgaard and Graversgaard, Reference Iversen, Dalgaard and Graversgaard2024). Generational succession changes are therefore a driver connected to both land tenure and economic incentives (Staddon et al. Reference Staddon, Urquhart, Mills, Goodenough, Powell, Vigani and Rowe2021; Jacobsen et al., Reference Jacobsen, Kristensen, Thorsøe, Graversgaard, Dalgaard and Stone2026). This was previously identified in an older study by Fraser (Reference Fraser2004) in Canada, which illustrated that intervening variables, such as economic annual payments from the onset of the planting scheme, may counter the effect of land tenure. In a framework for forestry, the author highlighted that rental agreements involve at least two stakeholders in land management decisions; this is an additional obstacle and thus, forestry is often avoided (Dandy, Reference Dandy2012). Lease contracts vary widely, and lease length could also be an important factor supporting tree cultivation. Adenuga, Jack and McCarry (Reference Adenuga, Jack and McCarry2021) found the duration of land leasing contracts (increasing from 1 to more than 3 years) was correlated with 80% more tree cultivation probability, indicating that longer-term lease agreements could support a shift from managing short to longer-term environmental and economic benefits (Adenuga, Jack and McCarry, Reference Adenuga, Jack and McCarry2021). Fraser (Reference Fraser2004) identified a similar pattern to that experienced with perennial crops, whereby farmers that do not own land have a tendency to focus on crops with only short-term returns. Owner-operated farms had a higher rate of long-term measures, focused on crops that aid soil conservation. The study also showed that even a long-term lease would not provide the same incentive as land ownership. We add to this by showing that the structural configuration of fields, as reflected in field perimeter length, indicates challenges for the long-term structural adaptation of fields operated under tenure arrangements.
The United Nations adopted Land Degradation Neutrality as a Sustainable Development Goal (15.3), which is feasible to meet through the widespread adoption of sustainable land management and restoration techniques (Debonne et al., Reference Debonne, van Vliet, Metternicht and Verburg2021). Yet, land governance, including agricultural land use policies and land tenure, is a significant constraint to their adoption globally (Soule, Tegene and Wiebe, Reference Soule, Tegene and Wiebe2000; Debonne et al., Reference Debonne, van Vliet, Metternicht and Verburg2021). The benefits of woodland to people, society, and biodiversity are substantial and vital (Stratford et al. Reference Stratford, Miller, House, Old, Acreman, Dueñas-Lopez, Nisbet, Newman, BurgessGamble, Chappell, Clarke, Leeson, Monbiot, Paterson, Robinson, Rogers and Tickner2017; Hardaker et al. Reference Hardaker, Pagella and Rayment2021), but the woodland type, structure, extent, and placement support different levels of support for sustainability goals as shown in Iversen, Dalgaard, and Graversgaard (Reference Iversen, Dalgaard and Graversgaard2024). A limitation to evaluating the environmental effects holistically is the lack of information about the variety of trees planted in the forestry category in this study.
Land tenure does not largely impact crop rotation length or diversity
In Denmark, we found similar trends and little absolute difference between owned and leased agricultural land managed in annual crop rotations. Although crop choice and rotation length differences can produce significant environmental impact changes in Europe (Ferreira, Pinto and Vasconcelos, Reference Ferreira, Pinto and Vasconcelos2021; Brannan et al., Reference Brannan, Bickler, Hansson, Karley, Weih and Manevska-Tasevska2023), no differences were detected for the inclusion of legumes and intercrops based on land tenure in Denmark. Our study did not consider differences in management practices such as, conservation tillage and integrated pest management, which are also important for soil health and agricultural sustainability in the context of a green transition (Sandén et al., Reference Sandén, Spiegel, Stüger, Schlatter, Haslmayr, Zavattaro, Grignani, Bechini, D′Hose, Molendijk, Pecio, Jarosz, Guzmán, Vanderlinden, Giráldez, Mallast and ten Berge2018). Another European study found similar results; in Austria, there was no difference between the application of 16 soil conservation practices and land tenure due in part to the prevalence of secure and long-term land rental agreements (Leonhardt, Braito and Penker, Reference Leonhardt, Braito and Penker2021). However, some soil improving techniques such as liming or application of organic amendments that produce long-term effects may be more frequently used on owned land; however, data on their use and on soil health (or quality) is not publicly available.
There may be several explanations for why we largely see no impact of land tenure on crop rotation length or diversity in Denmark. First, farmland is costly (EUR 14.000–45.000/ha), and thus farmland will most often be kept in intensive arable rotation and as manure spreading area. Further, actively maintaining fields is also a condition for direct payments. Second, given the high livestock density of farms in Denmark, farmers need all fields for feed production. Third, although approximately 44% of Danish farmland is leased, this structure may also reflect a successional challenge as retiring farmers have been unable or unwilling to sell their land due to speculation or unfavorable prices and now lease out their land (Thorsøe and Noe, Reference Thorsøe and Noe2023). Therefore, today many full-time professional farms operate a mix of owned and leased land as they need the land for the livestock or to make a living, but they cannot afford to purchase.
Although our study detected minor differences between owner-operated and leased annual crop rotations at the field scale, these findings are not necessarily transferable to other socio-political contexts. In other contexts, leasing or sharecropping produce important crop management and choice impacts, supporting Boserup’s hypothesis that population density, land conservation, and property rights are correlated (Kabubo-Mariara, Reference Kabubo-Mariara2007; Akram et al., Reference Akram, Akram, Wang and Mehmood2019). It is also important to consider agricultural land use choices in Denmark and other countries in a global context as countries are increasingly outsourcing land both within a country and across the globe to meet energy policies and targets (Antonelli et al. Reference Antonelli, Siciliano, Turvani and Rulli2015). At the global scale, tenure systems can produce significant social and environmental implications, including increased social vulnerability and decreased adaptation to climate change (Murken and Gornott, Reference Murken and Gornott2022). A systematic review of 106 studies investigating the link between land tenure and farmer response to climate change found that perceptions of land tenure security have been affected by climate change, and characteristics of land tenure impact climate change adaptation and contribute to social vulnerability (Murken and Gornott, Reference Murken and Gornott2022). A study in Kenya found that perceptions of profitability were the most critical factor influencing conservation practice adoption (Kabubo-Mariara, Reference Kabubo-Mariara2007). However, farm-scale socio-economic factors may play an important role in the adoption of sustainable land management practices (Long and Qu, Reference Long and Qu2018). In another study, a large plot-level dataset was combined with farmer interviews in Austria; land ownership status did not influence farmers’ crop choice; however, ending rentals and insecure rental reduced soil conservation behavior, while personal relationships between renters and owners increased it (Leonhardt, Braito and Penker, Reference Leonhardt, Braito and Penker2021). Although our model included some farm-scale factors, the influence of gender, which was critical to understanding the environmental implications of land tenure in the United States, was not included (Petrzelka and Marquart-Pyatt, Reference Petrzelka and Marquart-Pyatt2011).
Green transition implications and future research
To understand the implication of less tree production on increasingly leased agricultural land in the context of the green transition, it is essential to understand the role of trees in the landscape. Trees play an important role in the green transition, and increasing planting uptake among private landowners and farmers would significantly help reach international environmental policy targets. The EU’s ‘Biodiversity Strategy 2030’ has a goal of expanding the forest area by planting 3 billion trees by 2030 as a way to work toward their biodiversity conservation targets. In addition, trees provide a significant mitigation contribution toward reaching climate neutral targets (Di Sacco et al. Reference Di Sacco, Hardwick, Blakesley, Brancalion, Breman, Cecilio Rebola and Antonelli2021), along with the potential of sustainable wood production. The EU ‘Nature Restoration Law’ is additionally impactful, with binding targets for improving biodiversity and ecosystem services as a core element of the Biodiversity Strategy and the European Green Deal (Hering et al., Reference Hering, Schürings, Wenskus, Blackstock, Borja, Birk, Bullock, Carvalho, Dagher-Kharrat, Lakner, Lovrić, McGuinness, Nabuurs, Sánchez-Arcilla, Settele and Pe’er2023). Our results highlight that the ongoing transition from farmer owned and operated to leased land may constrain opportunities to implement measures with long-time horizons and those causing structural changes to agricultural land. For example, rewetting of peatland to prevent carbon emissions, reforesting to enhance biodiversity, or semipermanent erosion mitigation measures to address increasing rainfall could be slowed due to land tenure dynamics.
Land use and land ownership dynamics are particularly important to highlight in Denmark. In 2024, a newly adopted policy—the Agreements on a Green Denmark—with corresponding funding sets out to convert 250,000 hectares of arable land into new forests and 140,000 hectares into rewetted peatlands (MGTP, 2025). This agreement aims to concurrently reduce nitrate leaching and carbon emissions, while improving conditions for biodiversity. When owners and managers of farmland are not the same, it adds an additional layer of complexity to decisions regarding agricultural land use changes. As the desire for implementing more permanent agricultural land use changes increases, shifting land tenure can create unfortunate consequences, which are important to monitor through time.
Study limitations
The authors acknowledge the difficulties of reproducing this study in other regions due to lack of similarly detailed data. Hence, this study is a first step toward understanding land ownership dynamics related to activity data. Although few differences were observed based on land tenure for annual crop rotation using Danish field scale activity data, these study findings may not capture nuances based on landscape and farm system characteristics. For example, although livestock production was included as a farm-scale variable, specific production categories were not (e.g., cattle, pig production), which may mask critical agricultural land use trends. Smaller-scale trends also influence agricultural land use; by not grouping fields by operators, our results are likely correlated as unobservable based on this factor. Exploring the relationship between farm operators and field tenure status would also be an important step toward better understanding of decision-making but was beyond the scope of the present study. At the landscape scale, including additional socio-economic indicators (e.g., age, gender), more granular farm-scale factors (e.g., livestock type), and geographical data (e.g., proximity to urban, soil type) could also support a deeper understanding of land tenure dynamics in Denmark (Long and Qu, Reference Long and Qu2018; Meyer et al., Reference Meyer, Früh-Müller, Lehmann and Schwarz2023). Furthermore, including soil data could help explain the effects of the management practices on soil health. Creating a tool to combine agricultural land use factors at decision-making scales (e.g., municipalities) could also support the green transition for agricultural land use and enable a co-creation process to design appropriate food system policy support in this context (Hausner, Brown and Lægreid, Reference Hausner, Brown and Lægreid2015; Stokstad and Krøgli, Reference Stokstad and Krøgli2015).
Conclusions
While demands for an agricultural green transition continue gaining momentum, agricultural land is increasingly leased in Europe. This study is the first of its kind exploring the effects of this reconfiguration of land ownership based on detailed accounts of farm activity data at a national scale. This study found significant differences in long-term agricultural land uses including tree production based on land tenure but only minor differences in annual crop rotations using field-scale data representing 91% of Danish agricultural land. In addition, larger fields of fruit, energy forestry, and permanent grassland tended to be leased. Fields with larger perimeters per area tended to be owner-operated across all agricultural land use categories indicating that irregularly shaped fields tended to be owned. For agricultural land in crop rotations, there were few detectable differences in the number of crops, or the types of crops included. Even when accounting for differences in farm management type, farmer occupation, farm type and controlling for region, land tenure produced little variation. Concerning the green transition, lands managed under environmental policies appear to be well represented for both owner-operated and leased fields, and there was no detectible difference in the inclusion of legumes or intercrops based on land tenure. However, the increasingly called for structural changes in agricultural production to support the green transition (e.g., rewetting, perennial plantings) are more difficult to implement on leased land. This study focused on field-scale factors; future research could study agricultural land use transitions moving from field to farm to landscape scales with increased attention to the social and environmental factors.
Acknowledgements
The authors would like to thank Maarit Mäenpää for consulting on the statistical approaches used in this work, and Tommy Dalgaard for consulting on the interpretation of our findings.
Author contribution
Conceptualization: TFS, MHT, MVO, SVI. Data curation, Methodology: MVO, TFS. Investigation, Formal analysis, Visualization: TFS. Writing—original draft: TFS. Writing—review and editing: TFS, MHT, MVO, SVI.
Competing interests
The authors declare that they have no known competing financial interests or personal relationships that could have appeared to influence the work reported in this article.






 Open access

