Background
Viral respiratory infections are frequently transmitted in healthcare settings. Reference Petrie and Talbot1,Reference Klompas, Milton, Rhee, Baker and Leekha2 For example, outbreaks of influenza and COVID-19 frequently occur in hospitals and healthcare facilities. Reference Henriques, Sousa, Faria, Pinto, Costa and Henriques3–Reference Salgado, Farr, Hall and Hayden5 Accordingly, vaccination is routinely recommended to healthcare professionals. Reference Salgado, Farr, Hall and Hayden5,Reference Nogareda, Gharpure and Contreras6 However, vaccines are not available for all viral respiratory pathogens, and rates of vaccination among healthcare professionals may not be high enough to ensure herd immunity. In addition, because vaccines may not be completely effective, even vaccinated healthcare professionals can still acquire and transmit respiratory infections to patients and to colleagues. Reference Thomas7,Reference Zhao, Hu, Ayaz Ahmed, Cheng, Chen and Sun8
Given the potential limitations for vaccinations to prevent the spread of respiratory infections, healthcare professionals are routinely recommended to avoid working while ill. Reference Kuster, Böni and Kouyos9,Reference Challener, Breeher, Frain, Swift, Tosh and OHoro10 Unfortunately, healthcare professionals frequently work while ill Reference Kuster, Böni and Kouyos9,Reference Challener, Breeher, Frain, Swift, Tosh and OHoro10 and also may be infectious in the presymptomatic stages of infection or with mild or atypical symptoms. Reference Shaikh, Swali and Houben11,Reference Montgomery, Morris and Rolfes12 Accordingly, universal masking was routinely recommended during the COVID-19 pandemic and has been used in other populations in other instances (eg, specific pediatric units during respiratory syncytial virus season). Reference French, McKenzie and Coope13,Reference Sung, Sung and Thomas14
During the COVID-19 pandemic, some investigations demonstrated that healthcare professionals were at higher risk of exposure to COVID-19 from their co-workers than from patients diagnosed with COVID-19. Reference Emecen, Keskin and Boncukcu Eren15–Reference Gordon, Trubiano and Holmes17 The risk from co-workers was attributable to two major factors. First, presymptomatic, mildly symptomatic, or asymptomatic healthcare workers were more contagious than hospitalized patients who likely had the disease for several days. Second, healthcare professionals might be more likely to adhere to Personal Protective Equipment (PPE) measures (eg, wearing masks) and practice social distancing around patients with known infections than around their co-workers. Indeed, transmission of COVID-19 was linked to healthcare professional breakrooms and workrooms where healthcare professionals were more likely not to wear masks. Reference Gordon, Trubiano and Holmes17,Reference Klompas, Baker and Rhee18
Given that healthcare professionals may be less likely to wear masks in workrooms and other non-patient care areas in hospitals, interventions to decrease crowding and increase social distancing in non-patient areas may be effective in reducing the spread of respiratory infections. Because room size and room occupancy are the two factors that drive crowding, we used a deployable sensor network system and agent-based simulations to understand how the size of physician workrooms could influence the spread of COVID-19 or other respiratory infections among healthcare professionals.
Methods
Sensor networks
To measure interactions between healthcare professionals, we used a mobile sensor network comprised of small, battery-powered, programmable devices containing a processor, flash memory, and an Institute of Electrical and Electronics Engineers (IEEE) 802.15.4-compliant wireless radio. These devices, which we call motes, were programmed to broadcast brief, time-stamped radio wave signals every 8 s. The signals use a band in the WiFi spectrum that does not interfere with other electronic equipment. We deployed two types of motes: (1) stationary motes, which we call anchors, were fixed in locations in physician workrooms and (2) mobile motes, which we call badges, that healthcare professionals wore in a badge holder affixed to their shirt collar. This sensor network approach has been described previously. Reference Monsalve, Pemmaraju, Thomas, Herman, Segre and Polgreen19–Reference Hornbeck, Naylor, Segre, Thomas, Herman and Polgreen21
When a mote’s signal is received by another mote (anchor or badge), the mote’s ID number, its received signal strength indicator (RSSI), and the time of transmission are collected and saved in the receiving mote’s memory. We can use the RSSI as a proxy for distance because the signal strength attenuates with distance. Reference Saxena, Gupta and Jain22,Reference Monsalve, Pemmaraju and Polgreen23 By assembling each mote’s received signal strengths throughout a work shift, we can estimate spatiotemporal information about healthcare professionals within range of the anchors.
Clinical procedures
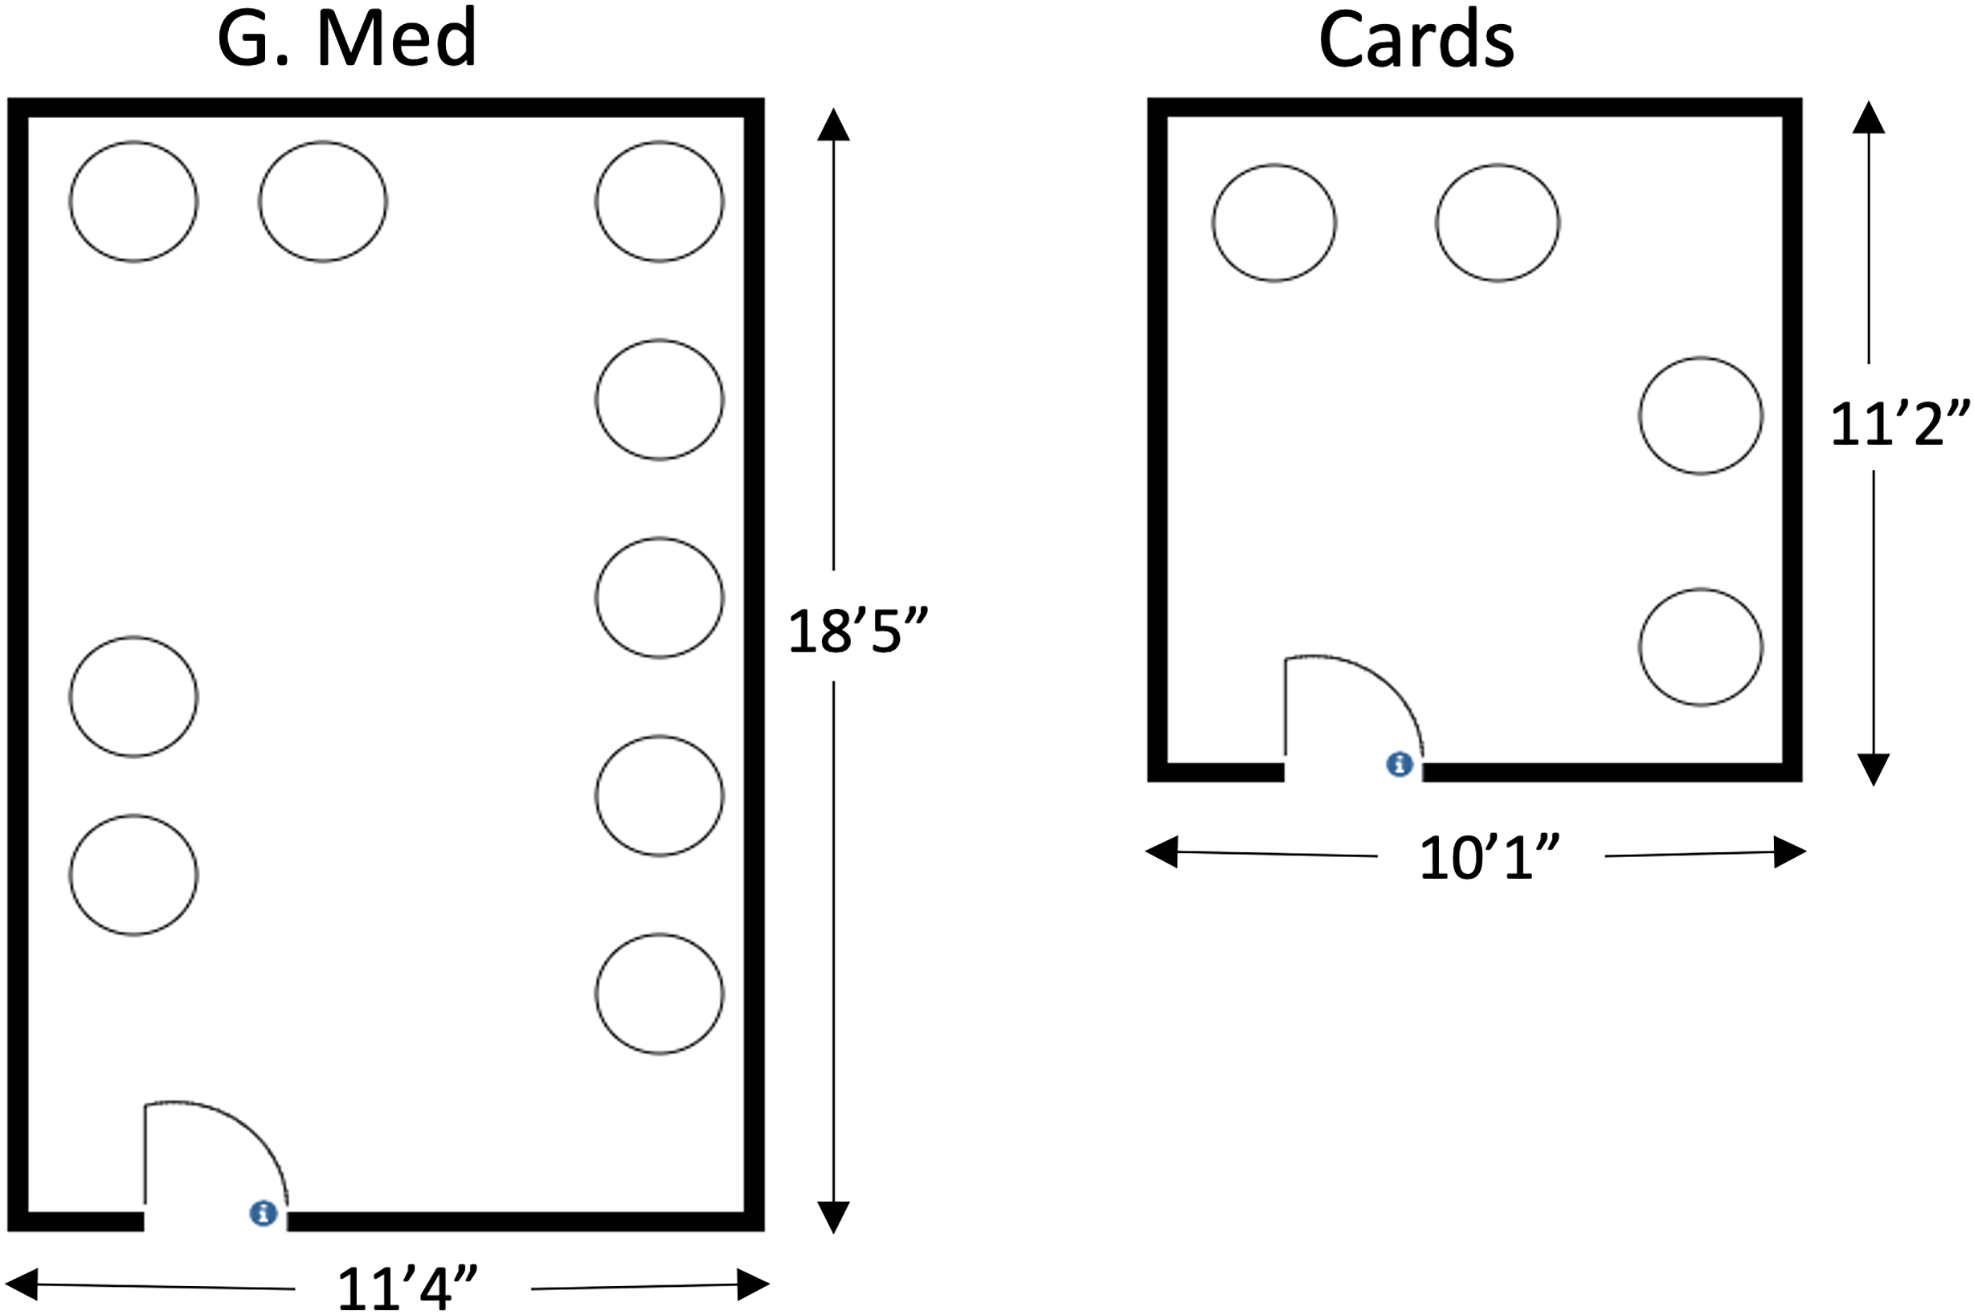
We collected data from physicians, residents, and medical students in an internal medicine specialty workroom and the cardiology workroom. The dimensions of the rooms and the location of the furniture are shown in Figure 1. For 18 days (12,965 minutes) in internal medicine and 14 days (10,080 minutes) in cardiology, we gave each healthcare professional a mote each morning (approximately 7:30 AM) to be worn on their collar for the entirety of their shift. Any professional who left the unit before we retrieved the motes would place them in a designated basket. We recorded the location of the basket so that our software would automatically remove any data received from a mote that was in the basket. At the end of the shift (approximately 6:00 PM), all motes were retrieved, and their memory was offloaded to a server. The motes were then cleaned, reset, and recharged for use the following day. To maintain anonymity, no other information about healthcare professionals was collected. Furthermore, healthcare professionals were given a mote randomly each day, so data could not be linked across multiple days.
Dimensions of the two workrooms, including placement of furniture.

Data analysis
Our first step was to transform the time series of RSSI values from motes into “contacts” between pairs of healthcare professionals. Specifically, we partitioned our observation period into epochs of 1 minute duration. For each epoch, we say that a contact occurred between a pair of healthcare professionals, A and B, in a workroom (internal medicine or cardiology), if the two professionals were distanced within 6 feet of each other at any point during that epoch. Additionally, if two professionals were within 6 feet of each other during two consecutive epochs, that was counted as two contacts.
To use RSSI values to accurately determine contacts between pairs of healthcare professionals, we implemented a calibration process, separate from the deployment described above. The goal of this process was to determine an RSSI threshold τ such that if badges A and B receive signals from each other at time t and the average RSSI of these two signals is at least τ then, with high specificity and sensitivity, the two badges are within 6 feet of each other. The calibration process was implemented by two members of our team, each wearing a badge on their left lapel. The two team members stood at various distances from each other, specifically ranging from 0.5 to 15.5 feet, at 0.5-foot increments. They stood for 10 minutes at each of these distances, and we saved the RSSI values stored on the two badges worn by the two team members.
When we analyzed the raw RSSI values obtained from our calibration process, we did not find a threshold τ that corresponded to being within 6 feet proximity with high enough sensitivity and specificity. However, when we smoothed the RSSI values by averaging them using a 1-minute sliding window, we found an RSSI threshold τ, for 6 feet proximity, with sensitivity 0.95833 and specificity 0.93822. We use this threshold to obtain contacts between healthcare professionals.
For each workroom R and each epoch e we define a contact network G e R whose nodes represent healthcare professionals who were present and whose edges represent contacts (as defined above) between pairs of healthcare professionals. There are as many contact networks as there are epochs. The density of contacts per epoch in a room can be measured by the average degree of each contact network. The degree of an individual in a contact network G e R refers to number of contacts that individual has in G e R . Since the temporal scale of each contact network is an epoch, the average degrees are also per epoch.
Simulations: We performed two simple types of disease simulations using the Susceptible-Infected (SI) compartmental disease spread model for a range of values of the transmissibility parameter ρ.
-
Base simulations: In our base simulations, for each workroom R, we pick a day d for which we have sensor network data. The disease starts at a randomly chosen healthcare professional. We then simply simulate the SI model over the contact network sequence G e R for epochs e during day d. Specifically, for each contact between healthcare professionals A and B in contact network G e R if A is infected and B is susceptible at the start of epoch e, then B becomes infected by the end of epoch e with probability ρ.
-
Occupancy-conditioned simulations: These are similar to the base simulations, except that these simulations are further parameterized by an occupancy value c. We simulated the SI model over the contact network sequence G e R for epochs e on day d, but restricted to only those epochs e during which workroom R is occupied by c healthcare professionals. Thus, this simulation considers the hypothetical situation in which workroom R is occupied exactly by c healthcare professionals for a period of time.
Results
Figure 1 shows the layout of desks in the two rooms and also that the internal medicine room is about 85% larger than the cardiology room in area (208.72 sq ft vs 112.60 sq ft).
The number of healthcare professionals badged in each room varied slightly from day to day, depending upon call schedules, from a minimum of 5 to a maximum of 8 in cardiology and a minimum of 6 and maximum of 9 in internal medicine (Table 1 in Supplementary Information). The average occupancy of the internal medicine room was 2.746 healthcare professionals per epoch, whereas the average occupancy of the cardiology room was 2.323 healthcare professionals per epoch.
Figure 2 shows that both rooms were in a “non-disease-spreading” state i.e., either unoccupied or occupied by just 1 person, for a substantial portion of the observation time (cardiology: 39.17%, internal medicine: 35.07%). The internal medicine room has high occupancy, ie, it is occupied by 5–8 people for larger fraction (28.00%) of the time, relative to the cardiology room (20.01%). The cardiology room has mid-range occupancy, ie, it is occupied by 3–4 people, for a larger fraction of the time (27.09%) relative to the internal medicine room (22.61%).
Distributions of workroom occupancy by time for the two workrooms. These distributions are over 12,965 minutes of observation for the internal medicine (G. Med) workroom and 10,080 minutes for the cardiology (Cards) workroom.

As shown in Figure 3, the average degree of contact networks is in the range 0–1 for a substantial portion of the time for both rooms (cardiology: 39.17%, internal medicine: 35.07%). This roughly matches the fraction of time these rooms are in a “non-disease-spreading” state (see Figure 2 above). The cardiology room has high average degree, ie, in the range 3–6 for a larger fraction (11.94%) of the time, relative to the internal medicine room (9.28%). The internal medicine room has mid-range average degree, ie, in the range 1–3, for a larger fraction of the time (55.62%) relative to the cardiology room (48.85%).
Distributions of average degree of contact networks by time for the two workrooms. These distributions are over 12,965 minutes of observation for the internal medicine (G. Med) workroom and 10,080 minutes for the cardiology (Cards) workroom.

Figure 4 makes this relationship between occupancy, room size, and average degree more explicit. For each integer c in the range 2–6, we consider all the epochs that each of the two rooms had occupancy c in that epoch. Then, separately, for each room, we compute the distribution of the average degree of contact networks for these epochs. These distributions, plotted in Figure 4, show that as c increases, the mean and median of the average degrees increase for both rooms. However, the increase is greater for the smaller cardiology room.
Average degree distribution of contact networks conditioned on workroom occupancy for the two workrooms. These distributions are over 12,965 minutes of observation for the internal medicine (G. Med) workroom and 10,080 minutes for the cardiology (Cards) workroom.

Figure 5(a,b) show results of the base simulations of the SI model, run with 10 different values of the transmission probability ρ. Figure 5(a) shows that despite lower average occupancy per epoch of cardiology room, the mean (and median) risk of secondary infection, ie, the probability that the infection source will infect some other healthcare professional, is consistently higher. This is especially true for lower values of ρ; for the higher values of ρ, this difference is less visible because the risk of secondary infection is capped at 1, because it is a probability. The variance in the risk of secondary infection is higher for the internal medicine workroom, reflecting both a smaller number of contacts because of the larger room size and a higher number of healthcare professionals using the room. Figure 5(b) shows that the number of people who acquire secondary infections is very similar for both rooms for smaller values of ρ, but higher for the internal medicine workroom for higher values of ρ. This is again reflective of the larger number of healthcare professionals using the internal medicine workroom.
(a) and (b): Results from base simulations. The plots show the average probability of a secondary infection (top) and the average number of secondary infections (bottom), with the average taken over 300 simulation replicates. The distributions shown are over 18 days for the internal medicine (G. Med) workroom and 14 days for the cardiology (Cards) workroom.

Figure 6(a,b) show results of occupancy-conditioned SI model simulations with transmission probability ρ = .0005. Figure 6(a) shows the distribution of the risk of a secondary infection. The distribution is over the 14 days during which both rooms were instrumented. As the occupancy c increases from 2 to 5, this risk increases for both rooms, but starting at c = 3 this risk becomes higher for the cardiology room, reflecting the greater density of contacts due to its smaller size. This trend continues in Figure 6(b) which shows the number of secondary infections. Furthermore, this trend persists for a wide range of ρ values. We show in a similar plot in Figure 6 in the Supplementary Information for ρ = .005.
(a) and (b): Results from occupancy-conditioned simulations for transmission probability for ρ = .0005. The plots shows the average probability of secondary infection (top) and the average number of secondary infections (bottom), with the average taken over 300 simulation replicates. The distributions shown are over 18 days for the internal medicine (G. Med) workroom and 14 days for the cardiology (Cards) workroom.

Discussion
Our modeling results, based on granular measurement of healthcare professionals’ movements within workrooms, show that risk for acquiring respiratory infections spread by respiratory droplets in a healthcare workroom is a function of both the number of people and the size of a room. Specifically, smaller workrooms will, in general, lead to increased infection risk for healthcare professionals. In the smaller cardiology room, the density of people (average degree) was higher than in the larger internal medicine room, despite the fact that the larger room had higher average occupancy. Our simulations demonstrated that this higher average degree was associated with increased risk of infection transmission for a wide range of values of the transmissibility parameter.
Healthcare professionals spend a substantial proportion of time in workrooms. Reference Butler, Monsalve and Thomas24,Reference Sagha Zadeh, Shepley, Owora, Dannenbaum, Waggener and Chung25 A major reason for the time spent in workrooms is the widespread emergence of electronic medical records systems that require healthcare professionals to spend a considerable proportion of their workday reading and entering information. Reference Kroth, Morioka-Douglas and Veres26,Reference Pinevich, Clark and Harrison27 In hospital settings. Physicians may spend a much greater proportion of their day in the clinical workroom than in direct patient contact. Reference Butler, Monsalve and Thomas24 Because of the time spent by healthcare professionals in these clinical workrooms, the rooms may play an important role in the transmission of respiratory viruses. Indeed, non-patient areas were identified as potential sources for occupational exposure during the COVID-19 pandemic. Reference Ellsworth, Chang and Ostrosky-Zeichner28–Reference Winkler, Hooper and Shenoy30
In addition to the large amount of time spent working on electronic medical records, clinical rounds are often held in workrooms. For patient privacy reasons, the doors are often closed, decreasing air circulation. Also, healthcare professionals with respiratory infections can be contagious when presymptomatic or asymptomatic. Thus, if workrooms are crowded, co-workers may be in close contact with infectious co-workers. Also, even when symptomatic, healthcare professionals frequently work when ill. Reference Kuster, Böni and Kouyos9,Reference Daniels, Wei and Han31 Furthermore, although universal masking is an option during outbreaks, healthcare workers are more likely to wear masks around infected patients than their co-workers, especially in non-clinical areas. Reference Brooks, Greenberg, Wessely and Rubin32,Reference O'Donohue, Fletcher-Gutowski, Sidhu, Verma, Phillips and Misra33 Even if masks are recommended, healthcare professionals drink and/or eat in these workrooms throughout the day, mitigating the effectiveness of masking.
During the COVID-19 pandemic, healthcare facilities, realizing the importance of crowding and contact networks, implemented a range of interventions to increase social distancing. Reference Gagneux-Brunon, Pelissier and Gagnaire34–Reference Sick-Samuels, Cosgrove and Rock36 However, many of these efforts were specifically designed to be temporary (eg, changes to dining areas). Yet, crowded clinical workrooms, even in the absence of COVID-19, still provide an opportunity for the transmission of respiratory viruses, including influenza and respiratory syncytial virus. Indeed, healthcare-associated respiratory viruses are an underappreciated source of morbidity and mortality. Reference Petrie and Talbot1,Reference Klompas, Milton, Rhee, Baker and Leekha2,Reference Yamaguto, Zhen, Moreira, Montesanti and Raboni37
Our results highlight the importance of space in influencing social interactions and thereby the risk of the transmission of respiratory infections. The results from our simulations helped convince hospital leadership to almost double the size of the smaller cardiology workroom used in our study. The approach we used could help inform the construction and redesign of new clinical workrooms and could also inform the design of other areas of the hospital. Given that contact networks are influenced by architecture and design, future hospital design could help decrease the spread of respiratory and other infections. In other contexts, closer physical proximity of co-workers is associated with more frequent and longer face-to-face interactions. Reference Sugiyama, Hadgraft and Clark38 Thus, changing of the physical layout could adversely impact communications between healthcare professionals. The role of workplace design on employee health, well-being, and productively has been widely investigated outside healthcare delivery settings. Reference Colenberg, Jylhä and Arkesteijn39,Reference Voordt and Jensen40 Our results suggest similar investigations should be extended into healthcare settings with an explicit focus on infection control.
One limitation to our study and modeling is that we did not consider the impact of ventilation. We assumed that ventilation was similar for both rooms and did not measure airflow or turnover. Differences in airflow and circulation could have affected our findings. Experiences with the COVID-19 pandemic greatly expanded the ability of hospitals to quickly design interventions to change airflow and the quality of air in healthcare settings. Yet, similar approaches could be used to change the quality of air in clinical workrooms. These air-focused interventions may be possible in situations where changing the size of the room or changing room occupancy is not feasible.
Our study has some additional limitations. First, our study was performed in only one healthcare setting, so our results may not be generalizable to others. Second, we used a distance of 6 feet to denote a contact in our infectious disease simulations. This is a convenient and commonly used distance for measuring the risk for respiratory infections predominantly spread by droplets, but longer distances may still be associated with risk. Furthermore, it is also possible that risk increases with proximity, even below 6 feet. Our RSSI data were not calibrated to estimate distances below 6 feet. Future work will explore distances shorter and longer than 6 feet. Third, we were able to measure proximity of healthcare professionals only to other badged healthcare professionals. Accordingly, our estimates likely underestimate risk because we cannot account for contacts with unbadged healthcare professionals (eg, consultant physicians entering rounding rooms to discuss recommendations). Finally, we limited our simulations to simple SI models and did not attempt realistic simulations of influenza, COVID-19, or other respiratory infections. This choice was made because more realistic simulations would need several additional modeling assumptions, which would have added more uncertainty to our conclusions.
Despite the limitations of our study, we show that the size of clinical workrooms greatly affects infection risk among healthcare professionals. If infections are spread in clinical workrooms, they can be transferred to vulnerable patients. Future research should examine the optimal room design to prevent the spread of infections.
Supplementary material
To view supplementary material for this article, please visit https://doi.org/10.1017/ice.2026.10401.
Acknowledgements
This work was supported in part by the Centers for Disease Control and Prevention (#U01 CK000594 to Segre, Polgreen, and Pemmaraju, and #U54 CK000613 to Polgreen) and the National Center for Advancing Translational Science (#UM1 TR0004403 to Polgreen).
Competing interests
All authors report no conflicts of interest relevant to this article.