

Introduction
Over the last decades, there has been a significant concentration of poultry production in a limited number of areas in the European member states (Bettio et al., Reference BETTIO, MARANGON, FERRÈ and MARTINI2003). The ongoing consolidation of poultry meat and hen egg production has led to different organisation patterns in poultry production. On the one hand there are sparsely populated poultry areas (SPPA), where small farms produce for own consumption or local markets. On the other hand there are densely populated poultry areas (DPPAs), where large vertically integrated companies supply national and international markets (Windhorst, Reference WINDHORST2008). A regional concentration of poultry production has many economical advantages, but implements also an increased risk on the introduction and spread of poultry diseases, for example avian influenza (AI). Experiences from AI outbreaks revealed that virus introduction is often caused by a complex interaction of different risk factors at farm level. Low biosecurity standards as well as a high number of contacts between farms by poultry transports, people or vehicles may play a crucial role in the introduction and spread of AIV. However, data on biosecurity practise and frequencies of visitor contacts at European poultry farms is rare.
To gain more insight into prevalent farm management structures and hygiene measures applied at poultry farms and to quantify the number of contacts on poultry farms, poultry farms in Austria, Germany, and The Netherlands were analysed. These countries developed a high concentration of regional poultry production clusters, but they differ in their production and organisation patterns, and are therefore good examples for detailed analyses (Veauthier and Windhorst, Reference WINDHORST2008). The study was conducted within the EU project Healthy Poultry which aimed to develop new integrated strategies for prevention, control and monitoring of epizootic poultry diseases.
The main objectives of this paper are:
• to describe the prevalent farm management and contact structures,
• to develop a method to evaluate the farm's risk status with regard to the introduction of the AI virus,
• to develop a comprehensible tool to communicate the results to the farmers.
Poultry farm survey
selection of farms
The survey was conducted in Austria, Germany, and The Netherlands. Due to the different organisation patterns of the poultry production sector in these countries and for practical reasons, the farm selection method differed by each country. In Germany, 976 poultry farmers in Lower Saxony and Mecklenburg-Vorpommern received an invitation letter and a flyer which informed the farmers about the aim, procedure, and background of the study. The response rate to the invitations was 18.9% (185/976 farms). Reasons for not willing to participate were 1) too busy, and 2) not interested. To reach a broader audience of poultry farmers, articles about the project were published in national poultry journals as well as in the local press. Responding to these announcements, 37 additional farmers registered for participation. In total, 222 German poultry farmers were involved who returned the survey instruments (documents, questionnaires and logbooks) by mail.
In the Netherlands, the study was conducted by Wageningen University. Sixty-five broiler and layer farms were selected from the Farm Accountancy Data Network (BIN) of the Agricultural Economics Research Institute (http://www.lei.wur.nl/UK/statis tics/Binternet/default.htm). This network collects financial and technical data of a representative sample of farms and holdings of the Dutch Agricultural Census. Based on a pre selection by the administrators of the network, 65 farms were identified to obtain a reasonable number of farms of each type (broiler and layer) and each housing type (cage, barn, mixed) in the study. Each selected farmer was sent a letter inviting his/her participation in the study, followed by a telephone call a few days later. The response rate was 60% (39/65 farms). Reasons for not willing to participate were 1) too busy, 2) not interested and 3) participating in too many studies already. Farmers who participated in this study were paid remuneration (Geenen et al., Reference GEENEN, LONGWORTH N. LIJFTOG, VAN HORNE and FRANKENA2007).
In Austria, the study was conducted in cooperation with the Austrian product board (‘Zentrale Arbeitsgemeinschaft der österreichischen Geflügelwirtschaft’, ZAG). The institution selected a representative sample of 30 broiler, 30 layer, and 30 turkey farms. The response rate was 93.3%. Reasons to refuse participation were 1) too busy, and 2) not interested. On-site, the supervising branches of the Austrian product board (Geflügelmastgenossenschaft Ges.m.b.H./GGÖ, EZG Frischei GmbH and Österreichischen Qualitätsgeflügelvereinigung (QGV)) visited the farms and distributed the questionnaires and logbooks. In case of any further questions, the farmer had the possibility to contact their branches as well as the product board itself. After a time period of 4-5 weeks, the documents were collected by the product board and sent back to Germany.
characterisation of the participants
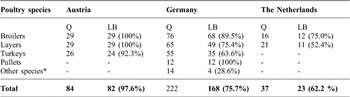
In total, 343 poultry farms participated within the study. As can be seen from Table 1, data were collected in 84 farms in Austria, in 37 farms in the Netherlands and in 222 poultry farms in Germany. The majority of farms had layers, broilers or turkeys. Since the importance of poultry other than broilers or layers in the Netherlands is quite low (e.g. turkey represent only 1.3% of the total poultry stock), only broiler and layer farms were included in the Dutch study. In Germany, twelve pullet farms, three layer breeder farms, one ostrich farm, one geese farm, and nine pedigree poultry farms additionally participated within the German study (Table 1). The poultry stocks analysed represent 3.0% of all Dutch farms (2.8 mill. birds), 11.2% (1.5 mill. birds) of the Austrian farms and 12.2% (13.1 mill. birds) of the poultry stocks in Germany.
Overview of participating farms (Q = Questionnaire, LB = Logbook).

*Three layer breeder farms, one goose and one ostrich farm, and nine pedigree poultry farms
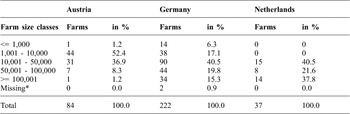
Table 2 shows the different farm size levels of the participating farms. The distribution of the participants to the farm size classes is similar to the poultry production structure of the countries. While the Netherlands and Germany tend to have larger farm units, Austrian farms show a different structure with smaller units. A closer look at Table 2 reveals that 41% of the Dutch and German participants house between 10,000 and 50,000 birds; 59% respectively 35% of the farms have units between 50,000 and 100,000 birds or even larger farms. In contrast, 52% of the Austrian farmers own smaller production units between 1,000 and 10,000 birds. The farm size can also be interpreted with regard to the consequences of AIV outbreaks. The larger the production unit, the higher are the economic losses in case of an AI outbreak.
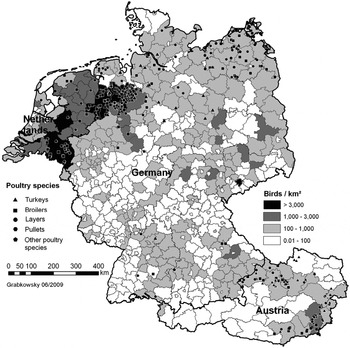
Figure 1 displays the distribution of participants as well as the poultry density (birds/km²) in the administrative districts of Austria, Germany and The Netherlands. Most of the farms are located in the main poultry production areas of the participating countries, where high densities of poultry with more than 3,000 birds/km² can be found. This is especially true for the regional concentration in the north-western part of Germany and the southern part of the Netherlands which pose an extremely high risk for an uncontrollable spread of AI as was the case after virus introduction in the Netherlands in 2003 (Capua and Alexander, Reference CAPUA and ALEXANDER2004). Furthermore, the map shows that the poultry density is much higher in Germany and the Netherlands than in Austria. Next to the varying density patterns, the different farm structures led to the selection of the three countries. In these densely populated poultry areas, the 2003 outbreak of AIV severely impacted the whole production chain of the Dutch poultry industry.
Overview of the farm size levels of the participating farms.

* No data stated
Distribution of participating poultry farms in Austria, Germany, and the Netherlands in regions with different poultry densities.

survey instruments
Data on location, management and disease prevention were collected by means of a questionnaire, data on farm contacts were collected with a logbook. Both tools were pre-tested by submitting them to experts as well as to a sample of farmers. The results were evaluated and used to adjust both survey instruments.
The questionnaire consisted of 68 questions with regard to the fields general farm structure and organisation, feed, litter, manure, employees, biosecurity, pest control, rendering, and machinery pools, which can be attributed to the three categories ‘location of the farm’ ‘farm management’ and ‘disease prevention’. In Austria and Germany, the questionnaire was filled in by the farmers, whereas the Dutch farmers were interviewed by a student from Wageningen University.
A standardised logbook was used to document all private and production related visitors for a period of four weeks by the farmers. On site, the following information on contacts were recorded: date and time of visit, reason of visit, access to the poultry houses (yes/no), address and type of business where the visitor was coming from (origin), whether poultry was present at the origin or destination address and, if yes, specification of the poultry species and whether the visitor had access to these poultry houses.
Methodical approach
The collected data were entered into SPSS 15.0, assimilated and checked on its consistency. Subsequently, a descriptive analysis was carried out on the whole dataset. Participants who did not deliver their logbook (Table 1) were excluded from the final evaluation.
assessment of the questionnaire data
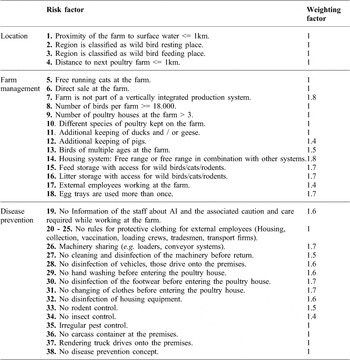
Basis for the evaluation process was the assumption that the number of prevalent risk factors and contacts is correlated with the likelihood for virus introduction (EFSA, 2008 after Thomas et al., Reference THOMAS, BOUMA, EKKER, FONKEN, STEGMAN and NIELEN2005). In total, 38 parameters were used which can be attributed to the three categories ‘location’, ‘farm management’ and ‘disease prevention’. The assessment for every single farm consisted of two steps. In the first step, each existing risk factor received one point. To emphasize very important risk factors for AIV introduction, an additional weight was derived in a second step. Based on a literature research, the relative importance of 19 risk factors related to either poultry production (e.g. housing system, number of poultry species housed at the farm) or biosecurity (e.g. pest control, basic hygiene before entering the poultry house, housing a new stock) was rated within a Delphi study (Geenen et al., Reference GEENEN, GRABKOWSKY, SAATKAMP and WINDHORST2008). The rates obtained from the Delphi study were used to derive weighting factors between 0 and 1, which were added to the score of one point obtained in step 1 (Table 3).
Within the evaluation process, the participants’ answers were checked on the occurrence of risk factors. For each risk factor present, the score specified in Table 3 was attributed to the farm's account. Subsequently, for each farm the total score of each category (location, management, disease prevention and contact structure) was calculated. The distribution of scores per category was plotted and based on equal intervals (equal intervals on the mean of the maximum scores reached by the countries), three risk classes (1-3) were determined. Accordingly, each farm was assigned to one of the three risk classes per category. To communicate the results as transparent and comprehensible as possible, the risk classes were visualised using a traffic-light scheme, where the red light represents the highest risk and the green light indicates a lower risk for AIV introduction. To gain more insight in the results of each category, the traffic light schemes were produced for every category as well as for the final scores of the questionnaire assessment.
Risk factors used within the evaluation procedure.

assessment of the logbook data
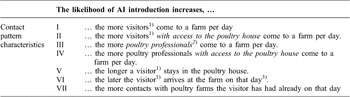
For the assessment of the logbook data, seven statements on characteristics of contact patterns at a poultry farm were phrased. As can be seen from Table 4, the statements deal with the frequency and type of the contact patterns on a poultry farm in the considered time period of 30 days. Within the Delphi study, the experts indicated their agreement or disagreement on the statements. In case of agreement, the expert panel rated the likelihood of AIV introduction for each contact pattern characteristic using a scale from ‘very important’ to ‘negligible’.
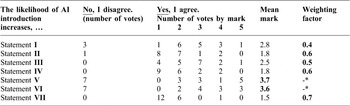
Since 36.8% of the experts did not agree with the statements V and VI, these records were excluded from the analysis. For the assessment of the data, the rating keys were transformed into school marks (very important = 1, negligible = 5). Accordingly, the mean mark was calculated and a weighting factor between 0 and 1 was derived as can be seen from Table 5.
Contact pattern characteristics used for the logbook assessment

1) Visitors = All persons, who visit a farm (Poultry professionals, officials, private visitors)
2) Poultry professionals = Poultry services, veterinarians, feed suppliers, quality controllers, management advisers etc.
3) Assumption: With proceeding daytime, the visitor could have visited more farms.
Derived weighting factors from the Delphi study.

* Not considered in the evaluation
In a next step, the frequency scores for each of the five contact characteristics of every farm were classified on the base of four quartiles; outliers (scores, that are twice higher than the forth class limit) were attributed to a fifth class. Considering the various amounts of contacts which vary by poultry species and by production type, the farms were assessed separately within their species category and by country. The weight calculated for each contact statement (Table 5) was added to the frequency class a farm was assigned to. For example: a layer farm registered 12 visitors (class 4), which had access to the poultry house (statement II, weighting factor 0.6), hence the result for this statement is 4 + 0.6 = 4.6. In the next step, for each farm the weights for each of the five statements were added and the distribution of final scores was plotted. Based on equal intervals, three risk classes (1-3) were determined, and each farm was assigned to one of the three risk classes. Again, the results were displayed using a traffic light scheme as described previously.
Final assessment and communication of the results
For the final assessment, only farms that handed in both the questionnaire and logbook were considered. For these farms, the scores of each category were added and subsequently, each farm was classified based on this final score (equal intervals) to one of the three risk classes. To communicate the results in a comprehensible way, a traffic light scheme was used to visualise the three risk classes. A high amount of risk factors led to risk class 3 (red traffic light), a relatively low number of risk factors to risk class 1 (green traffic light). In the Figures 2-6 shown below, the three different risk classes are represented by hachures. At the end of the study, all participants in Austria and Germany got a complete report of their results, where all parts of the survey were described and explained.
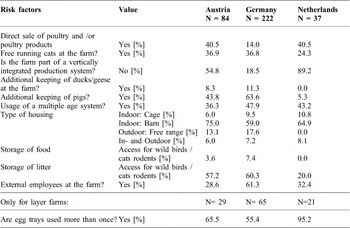
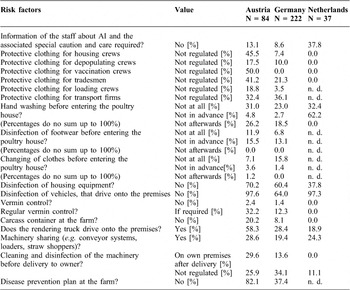
Tables 6 to 8 show the results of the selected questions from the questionnaire survey in Austria, Germany and the Netherlands. For all yes/no variables, the percentage of farms at which the risk factor is either present or absent is mentioned, for other nominal variables the percentage of farms is given for all values. In the case of continuous variables, the mean (min-max) values are given.
location
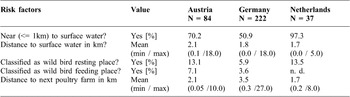
A closer look at the category ‘location’ (Table 6) reveals that 51% of the German farms and 70% of the Austrian farms are located to surface water within a radius of 1 km. Due to the high density of waterways and wetlands in the Netherlands, almost all Dutch participants are situated next to surface water (97.3%). Considering the distance to the next poultry, it is worth mentioning that all of the Austrian and Dutch poultry farms as well as 93.7% of the German farms were adjacent to another poultry farm within a radius of 10 km. This is especially important in case of an AIV outbreak, when the EU Council directive 2005/94/EC has to be followed. To prevent further spread, a surveillance zone with a radius of at least 10 km around the holding is established, in which different disease control measures (e.g. restrictions on live bird transports, implementation of preventive eradication programmes) have to be applied.
Results of the category location.

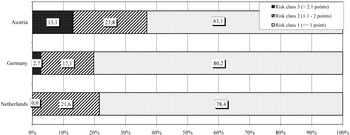
To assess the farms within the category ‘location’, five risk factors were used (Table 3). The first three factors are related to the farms’ distance to wetlands, which can be frequented by wild and migratory birds carrying the AI virus. The fourth variable is related to the poultry farm density, which is important to consider in a high risk period (Mannelli et al., Reference MANNELLI, FERRÈ and MARANGON2006). If a farm is infected, the distance to other poultry farms can be a crucial factor whether the virus is introduced to the adjacent farm. The maximum number of points for a farm to reach was four points. Accordingly, the farms were assigned to three risk classes. As can be seen from Figure 2, more than 60% of the farms from all countries reached the lowest class. 23.8% of all Austrian, 17.1% of the German, and 21.6% of the Dutch participants were assigned to class 2. None of the Dutch farms and only 2.7% of the German participants were attributed to the highest risk class, whereas 13.1% of the Austrian farms got three or more points in this category and were allocated to risk class 3.
Attribution of the participants to the risk classes in the category ‘farm location’

poultry farm management
Table 7 gives an overview about the collected data in the category ‘poultry farm management’. A comparison of the results for the three countries shows that 41% of the Austrian and Dutch farmers offer poultry and/or poultry products (mainly eggs, poultry meat and vegetables/fruits) in a farm shop on their premises, whereas this is only the case in 14% of the German farms. Since a direct sale is accompanied with a higher amount of visitors, it can increase the risk of the incursion of infectious agents (EFSA, 2005). Further important risk factors to be considered are the additional keeping of ducks and geese and the usage of an outdoor housing system (free range). Ducks, geese, and other poultry kept in free range are attractive for wild birds to mingle with the farmed birds and possibly deposit droppings on the ground which may represent a source of infection (Westbury et al., Reference WESTBURY, TURBER and KOVESKY1979, Tumpey et al., Reference TUMPEY, SUAREZ, PERKINS, SENNE, LEE, LEE, MO, SUNG and SWAYNE2003, EFSA, 2005). A closer look at Table 7 shows that 8.3% of the Austrian farms and 11.3% of the German farms additionally keep ducks or geese. Since the Dutch system of Integrated Quality Control (IKB) provides strict requirements, Dutch farms do not have mixed farming. A free range housing system is used in 13.1% of the Austrian and in 17.6% of the German farms, whereas 6% of the Austrian, 7.2% of the German, and 8.1% of the Dutch farmers even combine in- and outdoor housing systems (e.g. barn and free range housing). Furthermore, the storage of litter used in the poultry houses was investigated. Litter may be contaminated by the droppings of wild birds, cats, or vermin, which may present another cause for infection (EFSA, 2005). Table 7 reveals that between 20% of the Dutch farms, 57% of the Austrian, 60% of the German farmers store the litter with access for rodents, cats, and wild birds.
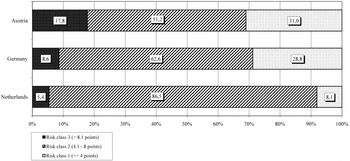
For the assessment of the participant's results in this category, 14 risk factors were evaluated. The theoretical maximum score was 19 points. The maximum score accomplished by the participants were 13 points in Austria, 15.4 points in Germany and 8.3 points in the Netherlands. Accordingly, the farms were assigned to three risk classes (Figure 3). 31% of the Austrian and 28.8% of the German farms reached the lowest risk class, whereas only 8.1% of the Dutch farms got less than 4 points. In risk class two, 86.5% of the Dutch participants, 62.6% of the German and 51.2% of the Austrian farms could be found. While only a small proportion of German and Dutch farms were assigned to risk class 3, the share of the Austrian farms in this class amounts to 18%.
Results of the category Farm management.

Attribution of the participating farms to risk classes in the category ‘farm management’.

hygiene/disease prevention
Next to farm management, biosecurity measures are widely accepted as the first line of defence against AI at farm level. The enquiry of prevalent hygiene measures undertaken in the participating farms covered measures applied for visitors as well as for employees of the poultry farm. A selection of variables investigated within the study can be found in Table 8.
In Austria and Germany, more than 80% of the farmers inform their staff about avian influenza and the associated special caution and care, which is required while working at the poultry farm. In contrast, almost 40% of the Dutch farmers stated not to inform their employees. A closer look at Table 8 reveals that regulations on protective clothing for crews that work temporarily at the farms are not common in all farms. This is especially the case in Austria, where 18.8 - 50% of the farms do not give clear instructions for external workers. In Germany, this is mainly true for tradesmen and people of transport firms, whereas all Dutch farmers instruct their staff to wear protective clothing.
Biosecurity measures such as cleaning and disinfection of clothes, shoes or hand washing before entering the poultry houses constitute important barriers to the introduction of AIV into poultry holdings. But the efficiency of biosecurity plans greatly depends on the compliance of the farmer and his personnel (EFSA, 2008). Therefore, all participants were asked about different hygiene measurements applied before entering the poultry house. Between 23% (DE) and 32% (NL) of all farms analysed do not wash their hands before and after leaving the poultry house. 7% (AT) and 16% (DE) of the participants do not change their clothes and between 7% (DE) and 12% (AT) do not disinfect their footwear before entering the poultry house. Furthermore, the disinfection of housing equipment (drinking systems, feed lines, tools etc.) was another question enquired. 37.8% of all Dutch farms, 60.4% of the German, and 70.2% of all Austrian farmers answered not to clean and disinfect any equipment before implementing it to the poultry house. Furthermore, 19.4 - 28.6% of all poultry farms investigated responded to share machinery with other poultry farms, but 11.1 - 34.1% of these farmers do not care about if and how the machinery is cleaned before the return.
Results of the category Hygiene/disease prevention.

n. d. = no data
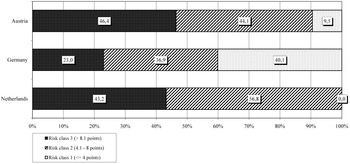
For the assessment of this category, 18 risk factors were used. The maximum score reached by the participants were 11.8 points in the Netherlands, 16.1 points in Germany, and 17.1 points in Austria. Accordingly, the farms were attributed to three classes of risk. As can be seen from Figure 4, 40% of the German and 9.4% of the Austrian farms reached less than 4 points, whereas no Dutch farm could be found in the lowest risk class. Between 36.9% (DE) and 56.8% (NL) of the poultry farms were assigned to risk class 2. More than 40% of the Dutch and Austrian participants could be found in the highest risk class, while only 20% of the German farmers got more than eight points in this category (Figure 4).
Attribution of the participating farms to risk classes in the category ‘hygiene / disease prevention’.

logbook data
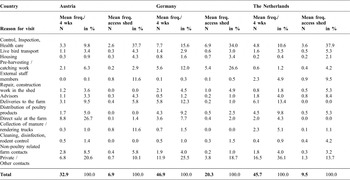
During the poultry production cycle, visitors with different purposes enter the premises. The risk of biosecurity breaches increases with an increasing number of people, birds, and items which enter the poultry farm (Thomas et al., Reference THOMAS, BOUMA, EKKER, FONKEN, STEGMAN and NIELEN2005). The visitors registered in the logbooks were differentiated by the reason of their visits. The mean frequencies of visitors differed by the type of contact as well as the amount and share of the visitors, who additionally had access to the poultry shed, are summarised in Table 9 (at the end of this paper).
Mean frequencies of visitors (premises and shed) per month by reason of visit.

The number of visitors registered during the investigation period averages between 33 in Austria, 46 in the Netherlands, and 47 visitors in Germany. Related to the larger farm sizes in Germany and the Netherlands, the mean number of contacts is 30% higher than in the Austrian farms. As can be seen from Table 9, the share of visitors who entered the poultry house is twofold higher in Germany (20.3 people on average) than in the Netherlands (9.5 people on average). This is related to the relatively high amount of visitors in the field of control, inspections and health care, as well as to the high amount of external workers who come to the farm temporarily to work in the poultry houses (e.g. loading or vaccination teams, poultry professionals).
The majority of all contacts registered can be attributed to deliveries of feed, litter and other materials as well as to private contacts which are considered to be low risk contacts. Transports of live poultry as well as the movement of manure were considered as high risk contacts by the Delphi experts (Geenen et al., Reference GEENEN, GRABKOWSKY, SAATKAMP and WINDHORST2008). Live bird transports usually take place once during a production cycle. Since not all farms conduct an all-in/all-out system, some of the farms registered more livestock trucks at their premises. A closer look at Table 9 reveals that the collection of manure contributes 5% to the total Dutch contacts, whereas this share is lower in Austria (1%) and in Germany (1.5%).
Practising a direct sale at the farm or keeping different domestic species result in more visitors per day. The share of contacts in this category in comparison to the total number of contacts is highest in Austria (26.7%), where on average 8.8 customers come to the farm per month. In Germany and the Netherlands, between two (NL) and four (DE) visitors can be attributed to farm sale activities.
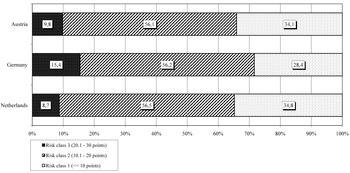
The assessment of the logbooks was conducted with regard to the frequency of visitors during the 30 day period. The higher the risk class, the more risk contacts where registered at the poultry farms. As can be seen from Figure 5, the distribution of the participants to the risk classes is similar in all countries. On third of the participants reached the lowest risk class with less than 10 points. 56% of all participants were assigned to the medium risk class, whereas between 8.7% (NL) and 15.4% (DE) of the poultry farms could be found in the highest risk class.
Results of the assessment of the contact structure in Austria, Germany, and the Netherlands.

results of final farm assessment
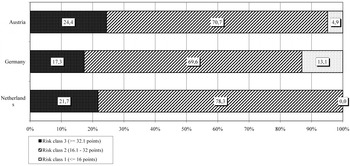
As described above, the scores derived from the questionnaire and logbook assessment were added for each farm. The final scores range between 11.1 and 49 points. The theoretical maximum to reach was 77 points. Figure 6 displays the final assessment of the farms to the risk classes using the traffic light colours.
The highest share of participants in risk class 1 can be found in Germany (13.1%), followed by Austria, where 4.9% of all Austrian farms reached less than 16 points. None of the Dutch farms could be found in the lowest risk class, which is influenced by the relatively high scores from the evaluation of the questionnaires. As can be seen from Figure 6, more than two thirds of all participating farms were assigned to the second risk class. The highest risk class 3 contains farms with more than 32 points. Almost one quarter of the Austrian farmers, more than one fifth of the Dutch poultry farms and 17% of the German farms were attributed to risk class 3.
Final attribution of the farms to three risk classes.

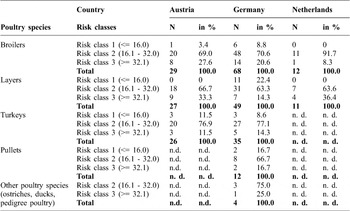
Table 10 gives an overview about the results by country and poultry species. As can be seen, two thirds of the participants were attributed to risk class 2; a quite low share reached the lowest class and between 8.3% and 36.4% could be found in the highest risk class. Only a small proportion of the Austrian and German broiler farms and no Dutch farm were attributed to the lowest risk class. 70% of the Austrian and German as well as 92% of the Dutch farms were allocated to class 2. The highest share of farms in risk class 3 showed the groups with broilers and layers. Although only 8.3% of the Dutch broiler farms could be found here, 21% of the German and 28% of the Austrian broiler farms received more than 32 points. A closer look at the results of the layer farms by countries reveals that none of the Austrian and Dutch farms reached the lowest risk class, but more than one third of them were assigned to the highest risk class. More than 20% of the German layer farms reached risk class 1 and 14.3% could be found in class 3.
Final assessment of the participating farms by poultry species and country.

n. d. = no data
Conclusions
In a European-based survey, poultry farms were analysed with regard to their location, farm management, hygiene/disease prevention measures, and contact structure. Within the evaluation process, the participant's answers were checked on the occurrence of risk factors and the frequency of high risk contacts respectively. For each risk factor present, a specific score was attributed to the farm's account. Subsequently, for each farm the total score of each category (location, management, disease prevention and contact structure) was attributed to one of three risk classes by assuming that more risk factors apparent at a farm lead to a higher risk on AIV introduction. To communicate the results in a comprehensible way, a traffic-light-scheme was proposed to assess the farms’ risk status for a possible incursion of the virus. However, the highest risk class is not intended to forecast an AIV incursion in the near future. As experiences of precedent outbreaks show, even farms with a good hygiene standard can be affected by an AIV outbreak (Korbel, Reference KORBEL2005).
The efficacy of biosecurity plans depends greatly on the compliance of the farmer and his personnel. Compliance will be enhanced when they have a basic understanding of the purpose of the measures (EFSA, 2008). Therefore, one focus of the study was especially laid on the implementation of disease prevention measures. One result was that the farms perform worst in this category ‘hygiene / disease prevention’. The investigation revealed a set of biosecurity gaps, which are related to basic hygiene measures such as hand washing or the disinfection of poultry house equipment. On the one hand, this means that more education of the farmers will be necessary and on the other hand that most of these security breaches are easy to bridge. To communicate the results, each of the Austrian and German farmers got individual information about the results including an explanatory text by mail. In addition, check lists for the premises, the service rooms as well as for the poultry houses were provided. In these lists, daily suggestions how to maintain a high level of biosecurity and how to prevent the incursion of pathogens were made. Furthermore, the participants were invited to a conference on disease prevention in poultry farms, which was held in each country. During these conventions the results were presented and additional veterinarian information was given. Besides, the farmers had the possibility to ask questions and to discuss their results. Most of the participants were grateful for the advice and astonished that such simple steps can help to improve their farm's risk status. From these reactions it can be stated that the traffic light system has been fully understood by the farmers. For further investigations it is advisable to evaluate the transparency and the use of the traffic light system and to investigate if the guidelines and suggestions are applied by the farmers. Based on these experiences it can be concluded that education and communication are still essential tools within farm management and disease prevention, even in the western part of the European Union where an invariable high degree of professionalism could be assumed.
Comparing the evaluation results between the countries, it is striking that the Austrian participants received the worst results, followed by the Dutch and the German farmers. An explanation could be the different organisation structures of poultry production in these countries, which could give reasons for variations in farm management and contact patterns. With regard to disease prevention, the Austrian and Dutch participants showed a high potential to improve their basic hygiene measurements. This is especially astonishing for the Netherlands since the country already faced a severe AIV outbreak in 2003 and therefore the farmers were expected to provide a high degree of hygiene standard. This is true for four participants (broiler farms), who had implemented the Dutch system of Integrated Quality Control (IKB) and reached risk class 2. The holistic IKB-concept includes the safety and quality of the product. The requested production method is implemented in 70% of the broiler farms in the Netherlands (Bekman, Reference BEKMAN2007). However, also farms working without the IKB-system reached lower risk classes. For further research it is recommended to evaluate the implementation of farm management, hygiene, and disease prevention measures in both types of farms with and without the IKB-system.
Since biosecurity is a farm's first line of defence, the results are not only relevant for the introduction of AIV, but also for the introduction of any poultry pathogens. Especially with regard to the EU zoonosis directive 2003/99/ECFootnote 1 and for example the realisation of the commission regulation No 1168/2006,Footnote 2 most of the farms investigated need to adjust their hygiene management in order to achieve the defined prevalence level by each country.
Despite the limitations of this study and the relatively small data set used in relation to the size of the countries, the methodology developed can provide an outline for the prevalent AI introduction risk status of livestock and poultry farms. For future research and use within disease prevention it is recommended to investigate a representative sample of farms in different European regions. Accordingly the data could be interpolated using multivariate statistical methods (e.g. kriging) to produce regional risk maps. As suggested by the expert panel within the Delphi study (Geenen et al., Reference GEENEN, GRABKOWSKY, SAATKAMP and WINDHORST2008), such maps could inform about the different share of farms posing a low, medium or high introduction risk. In combination with the regional risk maps developed within the Healthy Poultry project (Grabkowsky et al., Reference GRABKOWSKY, GEENEN, SAATKAMP and WINDHORST2008) this information could be useful for decision makers in terms of disease prevention.
Acknowledgements
We would like to thank Dr. Petra Geenen for her contribution to data provision and analysis within the EU project Healthy Poultry.