
Introduction
The electronic and optical properties of gold nanoparticles are integral in developing the technology for electronic warfare platforms for the obscuration and attenuation of light, medical detection technology for the treatment of cancer, nanoparticle sensors, and high-resolution biological imaging.[Reference Sokolnikov1–Reference Manzoor, Soleja and Mohsin3] Variations in the nanoparticle size, stabilizing ligand, and geometry can influence the electrochemical potential, quantum yield, and nonlinear optical properties. The absorbance spectra of gold nanoparticles that display quantum confinement, electronic transitions between the ligand and the gold core in the higher frequency regions of the electromagnetic spectrum are observed.[Reference Angelova, Kuchukova, Dobrikov, Petkova, Timtcheva, Kostova, Vauthey and Giorgetti4–Reference Kauffman, Alfonso, Matranga, Ohodnicki, Deng, Siva, Zeng and Jin6] The lower frequency transitions that are associated with the gold–gold interactions are seen in the near infrared (NIR) region.[Reference Sokolnikov1,Reference Park and Lee7] The crystal structures of icosahedral and bi-icosahedral structures have generated an interest in the last decade. This is because, in the bi-structure, the majority of the Au atoms form the core as opposed to the shell. The icosoheral Au25 contains 13 core atoms, whereas the latter contains a dimer of 13 Au atoms, connected by a single vertex Au atom while retaining the same Au–Au distance. Both clusters also show a structured spectral profile analogous to molecules.[Reference Zhu, Aikens, Hollander, Schatz and Jin8,Reference Shichibu, Negishi, Watanabe, Chaki, Kawaguchi and Tsukuda9] It is of general interest to compare the optical properties of these crystals (i- and bi-) with and without fluorophore labeling. This is because the quasicontinuous electronic bands in large nanoparticles (>5 nm) evolve to discrete levels as the size decreases to 1.3 nm and below. This leads to superatom behavior.[Reference Walter, Akola, Lopez-Acevedo, Jadzinsky, Calero, Ackerson, Whetten, Grönbeck and Häkkinen10,Reference Khanna and Jena11] Typically, the ligand's role in these clusters is to prevent the aggregation of the metal core and therefore has negligible contribution to the energetics of the gold cluster. We believe that the careful choice of ligands could influence the core states. A few studies investigate the influence of chromophore on the electronic energy levels of the Au core or shell atomic orbitals.[Reference Kang, Chong and Zhu12–Reference Stellacci, Bauer, Meyer-Friedrichsen, Wenseleers, Marder and Perry15] There are a few groups that have investigated the direct approach of synthesizing these clusters with fluorophores. Kamat and coworkers[Reference Thomas and Kamat13,Reference Thomas and Kamat14] have shown increased quantum yield in plasmonic nanoparticles (>2 nm) made with pyrene, as a result of electron transfer from the chromophore to the gold nanoparticle. Lee and coworkers[Reference Devadas, Kwak, Park, Choi, Jun, Sinn, Ramakrishna and Lee16] have shown a directional electron transfer from i-Au25 to a modified pyrene. The closed shell arrangement of the icosahedron and bi-icosohedral crystal lattice geometries produces the possibility of superatom properties if a potential is generated by tuning the surface of the cluster.[Reference Qian, Zhu and Jin17–Reference Liu, Xu, Jin, Wang, Xu and Zhu19] The energy barrier between a chromophore ligand and the gold core creates a potential for quantum tunneling. Fluorophores bound to nanocrystals display increased luminescence and photostability that apply to super high-resolution imaging when attached to the nanoparticle surface.[Reference Leduc, Jung, Carney, Stellacci and Lounis20,Reference Goh, Malola, Häkkinen and Akola21] This can be extended to applications such as solar energy storage and conversion if the electron localization/delocalization can be determined.[Reference Zhou, Jin, Sfeir, Chen, Song and Jin22]
The literature suggests that electronic transfers between the ligand and gold core are possible as opposed to the naturally occurring fundamental process of excitation energy transfer involving an electronic transfer from a donor to an accepter.[Reference Devadas, Kwak, Park, Choi, Jun, Sinn, Ramakrishna and Lee16,Reference Liu, Xu, Jin, Wang, Xu and Zhu19,Reference Banerjee, Maiti, Dutta and Dhara23] Forster resonance energy transfer explains the energy transfer exchange between two fluorescent species.[Reference Manzoor, Soleja and Mohsin3] The fluorescence and electrochemical properties of the gold cluster can be affected when coupled to a chromophore. As this can alter the optical properties such as an increase or a decrease in the quantum yield by the changes in the electronic states due to the possibility of electron density transfer from the ligand to the gold cluster or vice versa. Previously, Murray and coworkers[Reference Menard, Gao, Xu, Twesten, Harper, Song, Wang, Douglas, Yang, Frenkel, Nuzzo and Murray24] and Pineda and coworkers[Reference García-Raya, Madueño, Blázquez and Pineda25] have shown the possibility of multi-electron transfer (even if the redox processes were quasi-reversible) that the rate of electron transfer is dependent on the composition of the protecting layers and not on the core metal.
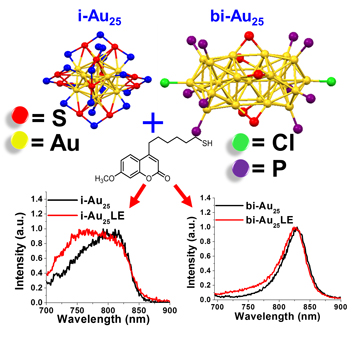
In this paper, we compare the properties of two well-defined crystal structures of the magic numbered cluster Au25 with and without fluorophore labeling the iscosohedral  ${\rm Au}_{25}\lpar {{\rm C}_6{\rm H}_{14}{\rm S}} \rpar _{18}{}^-$ (i-Au25) and [Au25(PPh)10(C6H14S) Cl2]2+ (bi-Au25). Ligand exchange reactions were performed with the coumarin hexanethiol ligand (Cou-SH), with the aim of labeling the cluster and at a minimal loading of 1 Cou-SH per cluster on an average. A coumarin-based ligand was chosen because coumarins are a naturally occurring versatile class of compounds that are under extensive study in use as an anticancer drug design. They are widely used and synthesized for pharmaceutical and homeopathic therapies. Coumarin are used as anticoagulants, antispasmodic agents, antioxidants, hepatoprotective, anti-inflammatory, antiviral, and antifungal, and they have offered benefits to people with coronary disease.[Reference Emami and Dadashpour26] A recent research, involving the anticancer properties of coumarin subclasses, has shown positive results in the cytotoxicty of cancer cells during in vitro studies.[Reference Emami and Dadashpour26,Reference Lagunes, Begines, Silva, Galán, Puerta, Fernandes, Maya, Fernández-Bolaños, López and Padrón27] This is the first study with the ligand (Cou-SH). The ligand-exchanged products with the Cou-SH will be referred to as i-Au25LE and bi-Au25LE. In this paper, we present a comparative study of the i- and bi-products. The motivation for the study comes from the possibility of the particle's potential facilitating directional transitions of electrons and a ligand enhanced optical response in gold nanoclusters, as described by Fortunelli and coworkers.[Reference Sementa, Barcaro, Baseggio, De Vetta, Dass, Aprà, Stener and Fortunelli5] Below, we present (i) the successful synthesis of the labeled clusters and their size distribution through a high-resolution transmission electron microscopy, (ii) the optical properties through UV–vis absorption, steady-state fluorescence, and IR spectroscopies, and (iii) electrochemical properties through square-wave voltammetry to investigate ground-state electron transfer.
Materials and methods
Chemicals for synthesis
The materials supplied by the manufacturers were Sigma Aldrich: gold(III) chloride (HAuCl4 reagent grade), sodium borohydride (NaBH4, 99%), tetraoctylammonium bromide (TOABr, 98%), toluene (C7H8 reagent grade, 99.5%); Fisher Chemical: NaOH (98%), methanol (CH3OH HPLC-grade), acetone (C3H6O ACS-grade); Acros Organics: hexanethiol (C6H14S 96%), dichloromethane (CH2Cl298%); and Milli-Q water purified using a Millipore Milli-Q system (18.2 MΩ·cm)
One-pot synthesis of Au25(C6H13S)18 or i-Au25
A modified literature procedure was used.[Reference Dass, Stevenson, Dubay, Tracy and Murray28] The reaction was conducted at room temperature in air. In a 250-mL round bottom flask, 2.5 mM (0.7854 g) of tetraoctylammonium bromide (TOABr) was dissolved in 50 mL of methanol with a magnetic stirring at a medium speed. Dissolved 0.9 mM (0.3 g) of gold(III) chloride trihydrate (HAuCl4) in the TOABr solution is continuously stirred. The solution was stirred for no longer than 15 min before the color changed from yellow to a deep red. 4.8 mmol (820 µL) of hexanethiol was added to the solution. The solution became colorless within 15 min. Once the solution became colorless, it could be stirred for 30 min. 13.7 mmol (0.52 g) of NaBH4 was dissolved in 5 mL of Milli-Q water at pH 10 and was chilled to 0 °C. The mixture was added all at once to the gold solution. Hydrogen gas evolved, and the solution immediately turned dark brown and the clusters precipitated out. The solution was then allowed to stir for 24 h. After the 24-h duration, we decanted the solution and the product into a centrifuge tube and centrifuged for 5 min at 3900 rpm. Then, the methanol solvent was decanted and discarded and 10 mL of methanol was added to the centrifuge tube, and the tube was shaken to disperse the product. This was then centrifuged for another 5 min at 3900 rpm, decanted and the solution was discarded unless the product dissolved (if the product began to dissolve then it was decanted, retained, and the methanol rinse was repeated until the solution was clear). A 10 mL aliquot of acetone was added to the centrifuge tube and shaken gently to disperse. Again, centrifugation was carried out for 5 min at 3900 rpm and the acetone extract was decanted into a scintillation vial. The acetone solution contained i-Au25. The steps were repeated of re-extracting with 10 mL acetone aliquots and centrifuging until the solution was clear. This indicated that all the i-Au25 has been extracted. The product was then rotary evaporated, re-extracted with 3 mL aliquots of acetone until clear, and syringe filtered with a 0.45-µm Teflon filter. Once the extraction of i-Au25 was complete, a liquid–liquid extraction was performed. A 1:1:1 ratio of i-Au25 product, Milli-Q water, and toluene was added to a clean centrifuge tube and vigorously shaken to mix the solvents, the excess polymer formed a white precipitate almost immediately. The mixture was centrifuged at 2000 rpm for 5 min. The white polymer layer was discarded. The golden layer was separated from the brown layer into two 250 mL round bottom flasks. All extracted samples were then rotary evaporated and washed with methanol for 1 h to remove the excess ligand. The average yield of Au25(C6H13S)18 was 15–20%.
Synthesis of [Au25(PPh)10(C6H14S)5Cl2]2+ or bi-Au25
An organic one-phase method was conducted under ambient conditions at room temperature and standard atmosphere. 0.25 mmol of Au PPh3Cl in 20 mL of a 3:1 dichloromethane/ethanol ratio was dissolved and stirred for 30 min at room temperature. Using a transfer pipette, 74 µL (0.50 mmol) of hexanethiol was added. The solution was allowed to stir at a moderate speed for 30 min (the solution remained clear during these steps). To chilled 5 mL of Milli-Q water to approximately 0 °C, 0.1800 g of NaBH4 (2.5 mmol) was added. Immediately, the NaBH4 was decanted into the solution and the stirring speed was increased (the solution began to turn gold to dark brown immediately). The solution was allowed to stir for 3 h then decanted into a separatory funnel. 10 mL aliquots of Milli-Q were added into the funnel and inverted several times. Then, the product was allowed to separate from the Milli-Q and removed. This step was repeated three more times to remove the excess NaBH4. The product was dried with sodium sulfate, then a Hirsch funnel was used with a filter paper and the drying agent was separated. The product was washed with the filter paper using 10 mL aliquots of methanol. The product was rotary evaporated before washing with 10 mL aliquots of hexane and ethyl acetate for 1 h continuously. After washing and removing larger particles, the bi-Au25 was extracted with 5 mL aliquots of methanol. The average yield was 10%.
Synthesis of i-Au25LE
16.9 mg of Au25(C6H13S)18 and 0.4 mg of the Cou-SH ligand were dissolved in 10 mL of dichloromethane and allowed to stir for 1 h. The solution was then rotary evaporated. The product was washed with 10 mL of methanol three times at 1-h intervals and then used for characterization.
Synthesis of bi-Au25LE
18.4 mg of [Au25(PPh)10(C6H14S)5Cl2]2+ and 0.4 mg of Cou-SH ligand were dissolved in 10 mL of dichloromethane and allowed to stir for 48 h. The solution was then rotary evaporated. The product was washed with 10 mL of hexane three times at 1-h intervals.
Synthesis of Cou-SH
The detailed synthesis and characterization of the new coumarin hexanethiolate ligand is given in the Supplementary Material.
UV–vis absorbance measurements
UV–vis absorbance measurements were collected n the 200–1100 nm range and used to examine the ground-state absorption and charge transfers. An Agilent Technologies Cary 60 instrument was used for particle characterization, dye quantification, the determination of optical density prior to fluorescence measurements, and the calculation of extinction coefficient measurements. UV–vis characterization methods involved the identification of documented absorption peaks for each material by recording the electronic spectra of solutions that have absorbance <1 as required by Beer-Lambert's Law. Fluorophore quantification procedures involved a baseline subtraction of the particle synthesized with hexanethiol. Each dye exchange product was measured for the relative quantifiable enhancement at 320 nm due to the Cou-SH ligand. The dye quantification process involved a series of procedures where the extinction coefficient for the gold particles was measured at the peak center at 680 nm associated with the sp ← sp transition, and the coumarin ligand extinction coefficient was calculated at 320 nm. The absorption from the gold on the exchange product was calculated and subtracted from the total absorbance at 320 nm. The calculation steps are given in Supplementary Material.
IR measurements
IR measurements were recorded using Thermo Scientific Nicolet iS10. The gold cluster solutions and Cou-SH were dissolved in dichloromethane (Acros Organics). A drop of the sample was added on to the ATR plate and allowed to dry before the spectrum was recorded in each case.
Proton NMR
Proton NMR data for each exchange product and the coumarin ligand were collected on a JEOL 400 SS 400 MHz instrument using a deuterated chloroform containing TMS standard. Gold exchange products were sonicated for 5 min in deuterated chloroform with iodine crystals to break the gold bonds. The proton NMR spectra were collected for the coumarin-derived ligand that was used for the exchange synthesis and compared to identify all peaks present in the scan. The integration ratio of a known single unique hydrogen atom on both the hexanethiol and coumarin hexanethiol ligand was used to identify the number of coumarin dyes on each exchange product. The ratio was compared to the results determined through absorption subtraction with UV–vis spectrophotometry.
Steady-state fluorescence
Steady-state fluorescence measurements were collected on a Horiba Jobin Yvon FluoroMax-4 spectrofluorometer and used to calculate the quantum yield in the ultraviolet and NIR regions. Emission spectra were collected with an excitation wavelength at 320 nm and 3-by-3 slit width to measure luminescence in the range 340–600 nm. The NIR luminescence for i-Au25 was collected with a 680 nm excitation wavelength, 5-by-5 slit width, and ranged from 690 to 900 nm. The NIR luminescence measurements of the bi-Au25 products were collected with a 670 nm excitation wavelength, 5-by-5 slit width, and ranged from 690 to 900 nm. The particles synthesized with hexanethiol were also characterized through fluorescence emission spectra. A stock solution of each particle was prepared with optical density at approximately 0.1 a.u. at λ = 320 nm. The samples were measured in triplicate using 2 mL aliquots of stock solution for each measurement. The average of all three spectra was graphed for each region. In addition, the average integration value and and the standard deviation were calculated. Quantum yield measurements for all particles were calculated at 320 nm with reference to Bis-MSB for the UV region. Phthalocyanine was used as a reference for quantum yield calculations in the NIR region. To calculate the quantum yield for the UV–vis and NIR regions, the integration value of each spectra is compared to the reference spectra and the absorbance ratio. The ratio of the solvent refractive index is also considered.
Fluorescence lifetime measurements
Fluorescence lifetime measurements were performed on a PTI-Horiba QuantaMaster 400 with a PicoMaster TCSPC steady-state fluorescence lifetime spectrometer. A 375 nm femtosecond pulsed laser diode, operated at 1 MHz, was the excitation source for all particle fluorescence lifetime measurements. The analysis of all lifetime traces was completed using the PTI-Horiba Felix-GX software.
Transmission electron microscopic images
Transmission electron microscopic (TEM) images were collected on a JEOL 2011, TEM 80–200 kV, 0.14 nm resolution. The images were utilized to determine the purity and size distribution. The average core diameter was determined using the Image J software. The average particle diameter and standard deviation were calculated based on a sample size of 100 or more measurements. Histograms were plotted to indicate a Gaussian distribution for particle size.
Electrochemical measurements
Electrochemical measurements were collected on a CH instrument 620D hardware station equipped with leads for a trielectrode system. Electrochemical potential was measured for each particle using a self-constructed silver quasi-reversible electrode. The trielectrode was assembled for the working, reference, and counter electrode. The working and counter electrodes each contained a 2 cm platinum wire soldered to the end of a copper wire. The reference electrode was soldered to a 2 cm silver wire. A protective shrink casing was applied with a heat gun before the assembled wires were placed in a plastic mold. A viscous solution of 5.128 g of poly(bisphenol A-co-epichlorohydrin) glycidyl end-capped and 0.734 g of m-phenylenediamine was made into a solution by heating. The solution was poured into the plastic mold and allowed to sit at room temperature for 15 min before being placed in the oven at 80 °C for 24 h. Square-wave voltametry (SWV) measurements were taken in a dichloromethane solvent containing 0.1 M Bu4NClO4 as the supporting electrolyte. Fisherbrand No. 37 white septa were used with 10 mL glass vials and parafilmed to degas the samples with argon. They were degassed for 30 min at room temperature before being placed in an isopropanol and dry ice mixture. The sample was purged for another 10 min and chilled to −78 °C (this was done only for the i-Au25). The band gap from the first oxidation peak to the reduction peak was measured.
Results and discussion
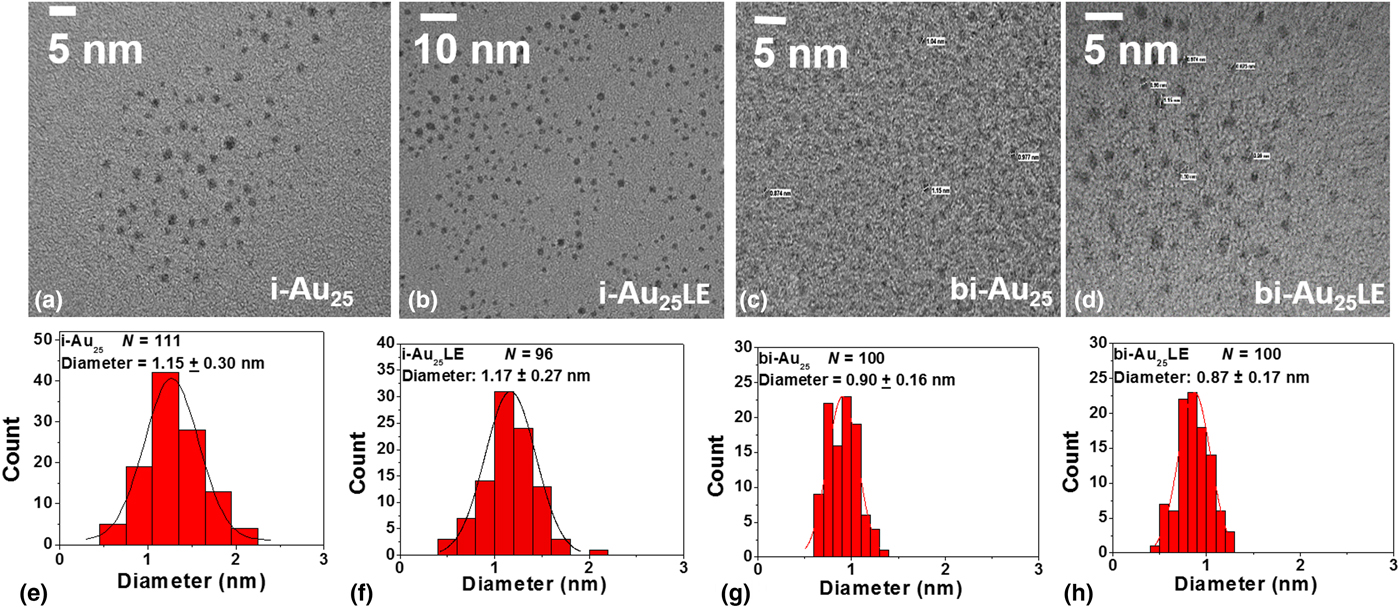
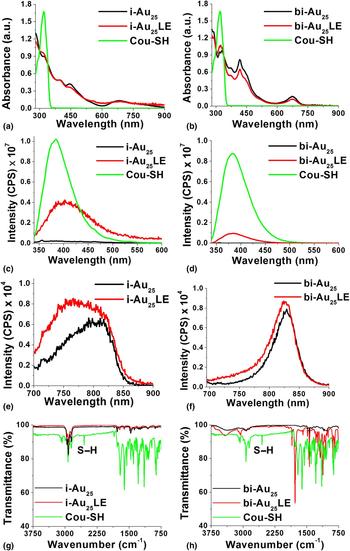
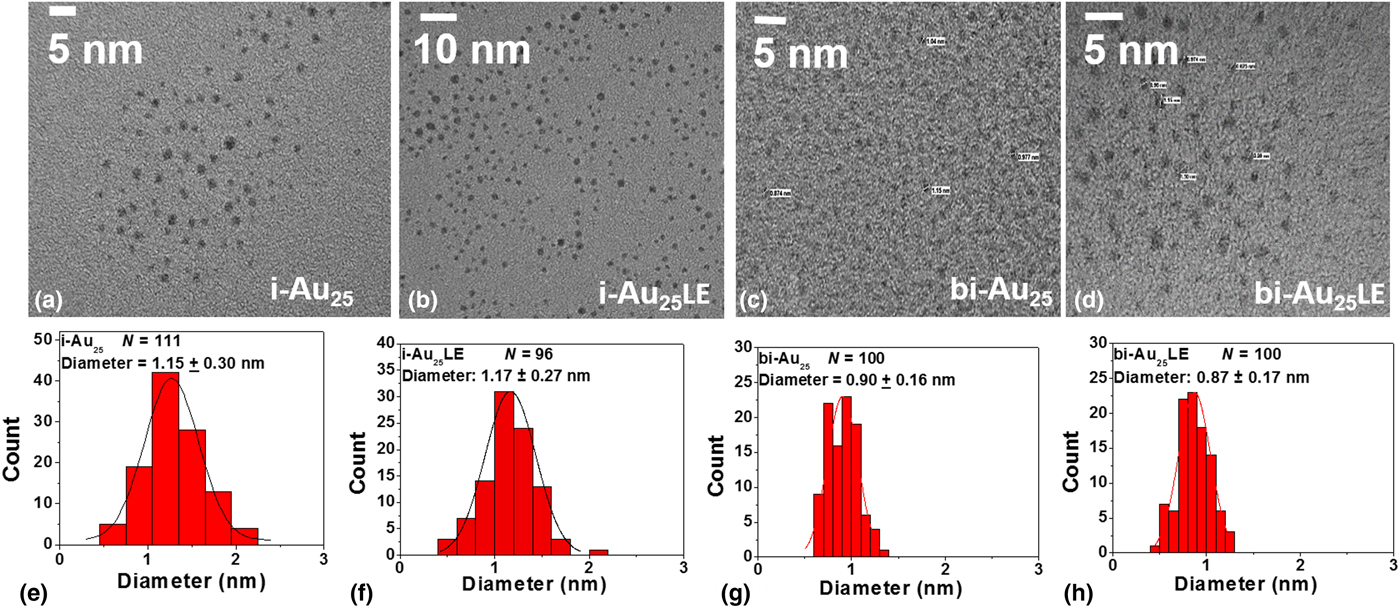
Monodispersed particles of both crystal structures (i- and bi-) were synthesized and characterized before and after ligand exchange reactions. Size dispersity was confirmed through TEM images that resulted in a Gaussian particle distribution. The particle diameters were 1.15 ± 0.30, 1.17 ± 0.27, 0.90 ± 0.16, and 0.87 ± 0.17 nm for i-Au25, i-Au LE, bi-Au25, and bi-Au25LE, respectively. Representative TEM micrographs and their corresponding size distribution histograms are shown in Figs. 1(a)–1(h). This supports the fact that the size of the original clusters did not change after the ligand exchange reactions in both crystal systems and is supported by the UV–vis optical absorbance spectra, as seen in Figs. 2(a) and 2(b). The spectra indicate the characteristic molecule-like transitions as expected for i-Au25 at 1.8, 2.7, 3.1, and 3.8 eV and at 1.9, 2.8, 2.9, 3.3, 3.7, and 3.9 eV for bi-Au25, respectively. It should be noted that the 3.9 eV transition in Cou-SH overlaps with the molecular transition of Au25 indicated by the change in the doublet-like peak to a single peak in the UV spectra of the ligand-exchanged products in the 3.9 eV region. The overlaid spectra indicate slight energy shifts when the Cou-SH is bound to the gold cluster, indicating the formation of a covalent bond between Cou-SH and the nanoparticle (Supplementary Fig. S1). The presence of the key transitions at 1.8 eV (sp ← sp)[Reference Qian, Eckenhoff, Bier, Pintauer and Jin29] for i-Au25LE and at 1.9 eV for the bi-Au25LE is an indication that the size of the clusters did not change after the exchange reaction was performed. This is attributed to the contributions solely from the atomic orbitals of the 13 core gold atoms. For bi-Au25LE, this transition is slightly higher which can be attributed to additional electron transfer capabilities of the triphenylphosphine ligand.[Reference Qian, Eckenhoff, Bier, Pintauer and Jin29]
TEM analysis of the i-Au25, i-Au25LE, bi-Au25, and bi-Au25LE. (a)–(d) Micrographs of the i- and bi-products with and without Cou-SH and (e)–(h) the size distribution histograms.
Comparison of the absorption, emission, and IR spectra of the i-Au25 and bi-Au25 before and after ligand exchange. (a) and (b) UV–vis spectra of i-Au25 and bi-Au25. (c) and (d) Emission spectra in the visible region of i-Au25 and bi-Au25 excited at 320 nm before and after ligand exchange. (e) and (f) Emission spectra of the same in the NIR region excited at 670 nm. (g) and (h) IR spectra of i-Au25 and bi-Au25 before and after ligand exchange, indicating the absence of the S–H stretch in the products.
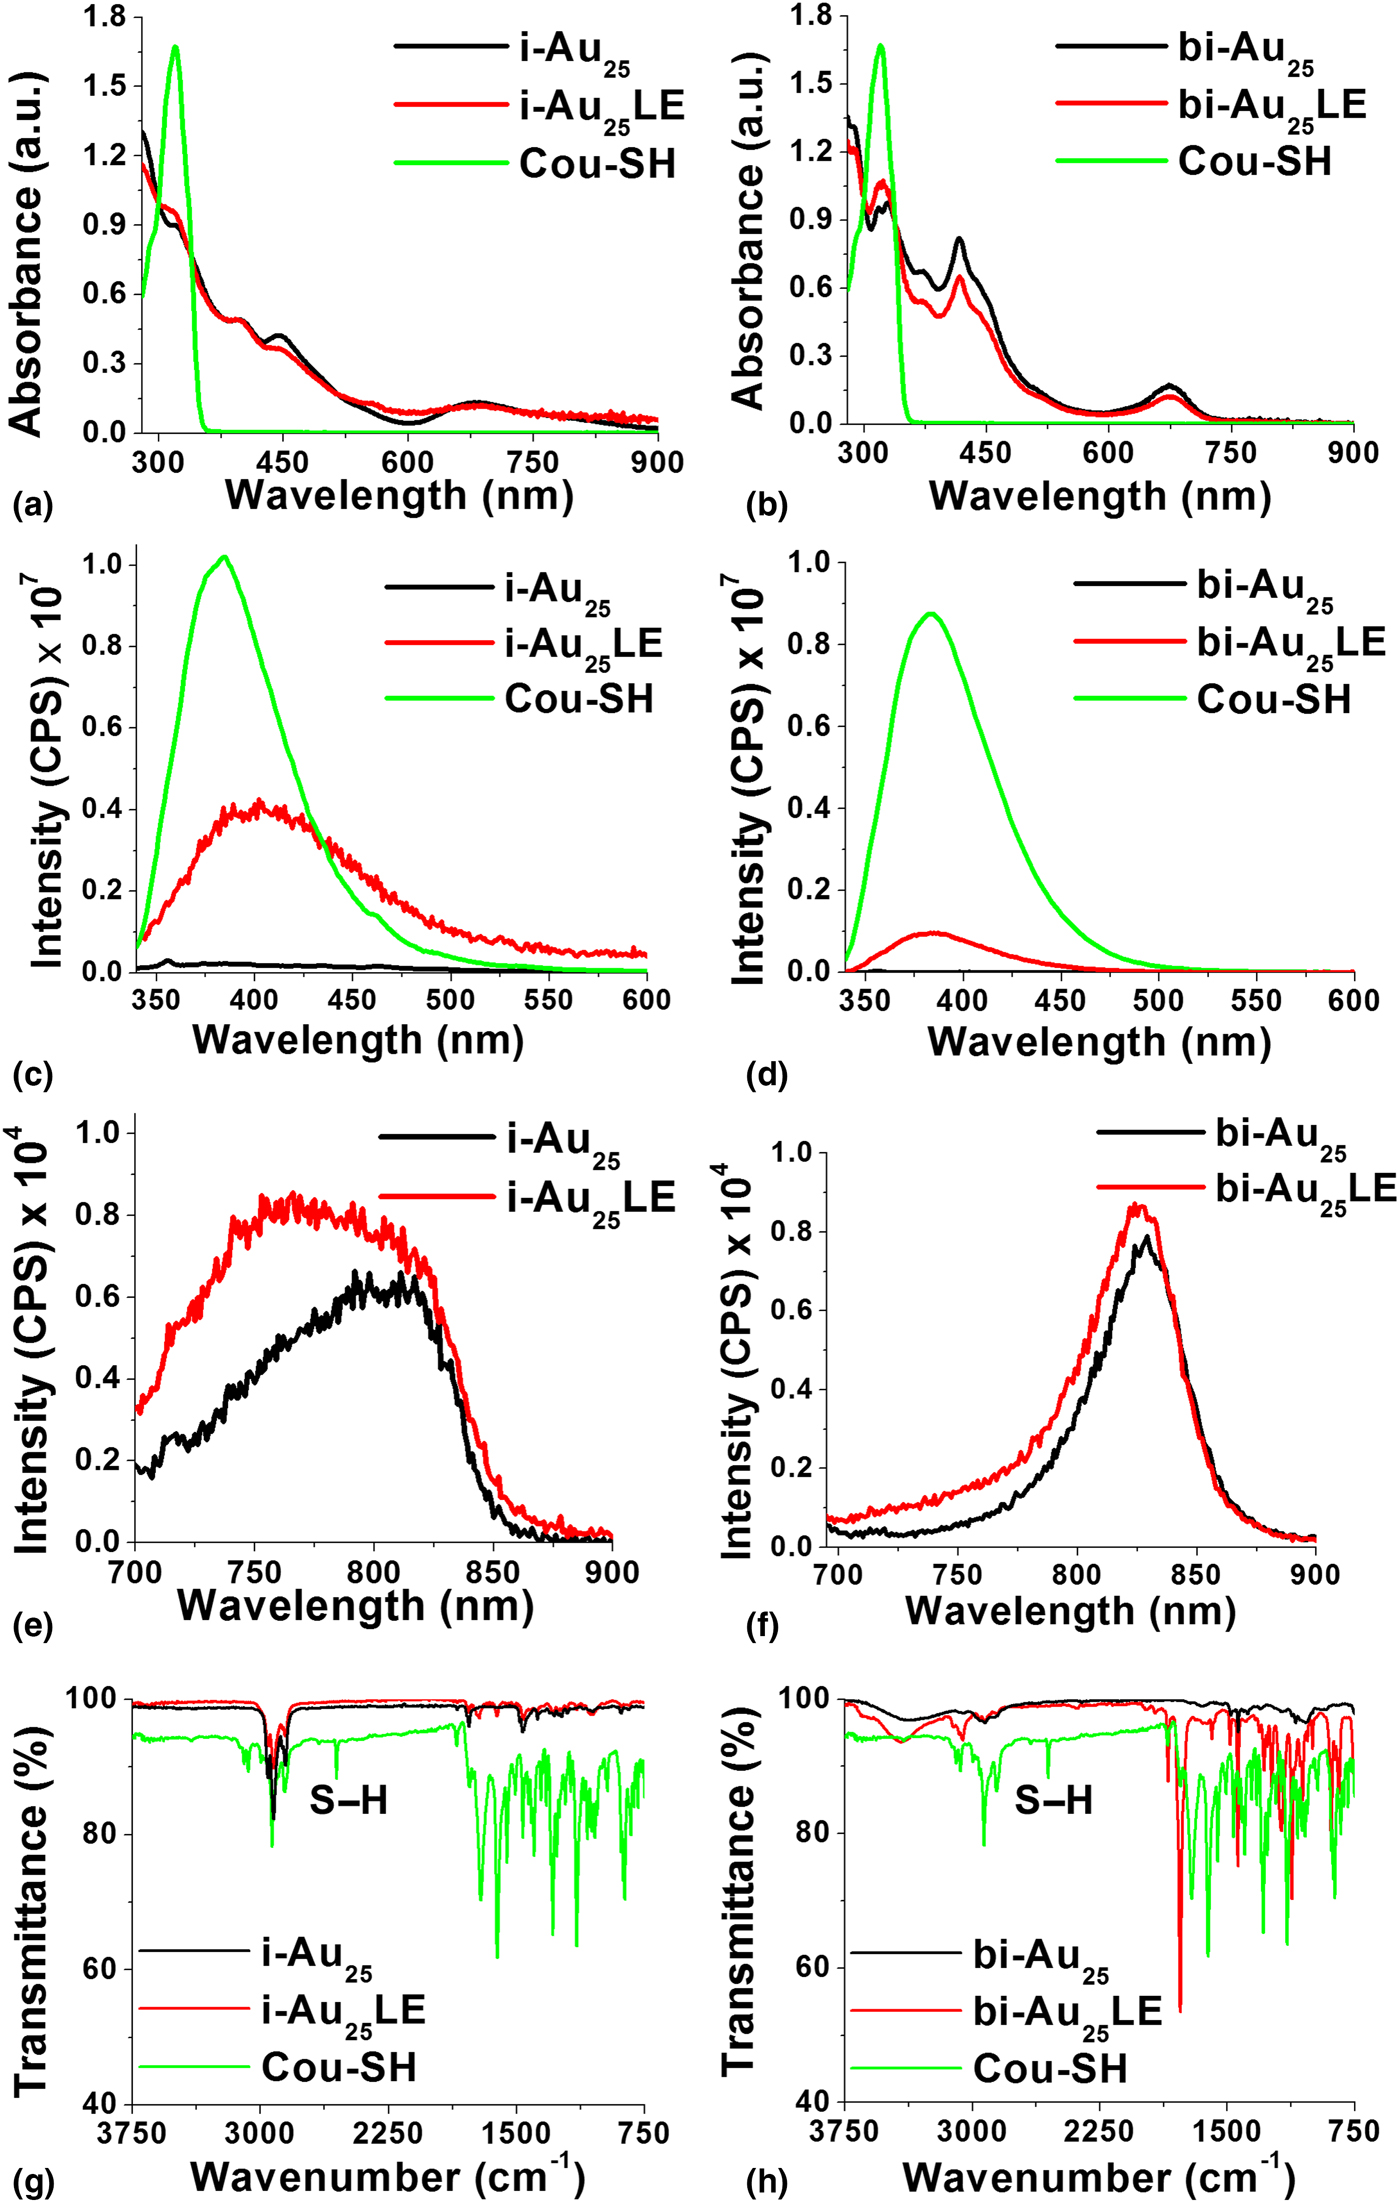
Steady-state fluorescence indicated quenching in the UV–vis region from the naked Cou-SH when bound to the surface of gold cluster. Figures 2(c)–2(f) give the visible and NIR emission profiles of i-Au25, i-Au25LE, bi-Au25, and bi-Au25LE, respectively. The visible luminescence of the Cou-SH has an emission maxima of 383 nm. This peak is quenched and red-shifted in the product to 403 nm in i-Au25LE (Supplementary Fig. S1(c)). In addition, the quantum yield (Φ) changes from 0.0377 ± 1.2 × 10⁻⁴ to 0.000257 ± 6.8 × 10⁻⁴ in i-Au25LE. In the bi-system, the Cou-SH peak did not show a peak shift and remains at 383 nm (Fig. 2 and Supplementary Fig. S1(d)). This supports the fact that the Cou-SH is replaced in the bridging location of the thiol ligands and bound to the bridging staples. However, there was a decrease in the quantum yield to 0.011 ± 2.8 × 10⁻⁴ from 0.0377 ± 1.2 × 10⁻⁴ in the NIR region.
The NIR emission peak was observed at 803 nm in the i-Au25 product and 828 nm in the bi-Au25 product. In the exchanged products i-Au25LE and bi-Au25LE, there is a blue shift in the emission maxima to 768 and 825 nm, respectively, and peak broadening (Fig. 2 and Supplementary Fig. S1(e) and (f)). This indicates that the incoming ligand Cou-SH is affecting the mixed ligand outer shell and is interacting with the core atomic orbitals. This is further supported by the quenching of fluorescence in the visible region with a Stokes shift for Cou-SH and further proved spectroscopically with the other techniques such as IR spectroscopy and HNMR later. We project that the Cou-SH is located on the staple motif in the case of the i-structure and the bridging location in the case of bi-Au25. In addition to the blue shift in the spectra, there was also an enhancement in quantum yield from the unexchanged i-Au25 (Φ = 0.000929) and bi- Au25 (Φ = 0.003180) to the ligand-exchanged products Φ = 0.00026 and Φ = 0.003677 for i-Au25LE and bi-Au25LE, respectively (Figs. 2(e) and 2(f)). Time-correlated single-photon counting measurements were done on the labeled and unlabeled or unexchanged structures. However, due to the lifetimes being faster than the instrument response factor/resolution, we have shown for qualitative purposes the change in the exponential decay for the exchanged product as opposed to the free dye in Supplementary Figs. S2(a) and S2(b) and their lifetimes in Supplementary Table S1. Additionally, IR spectroscopy was performed on the products to prove that there was no free Cou-SH in either system. This is indicated by the absence of the S–H vibrational stretch at 2556 cm−1 in both i-Au25LE and bi-Au25LE. The comparative spectra are given in Figs. 2(g) and 2(h).
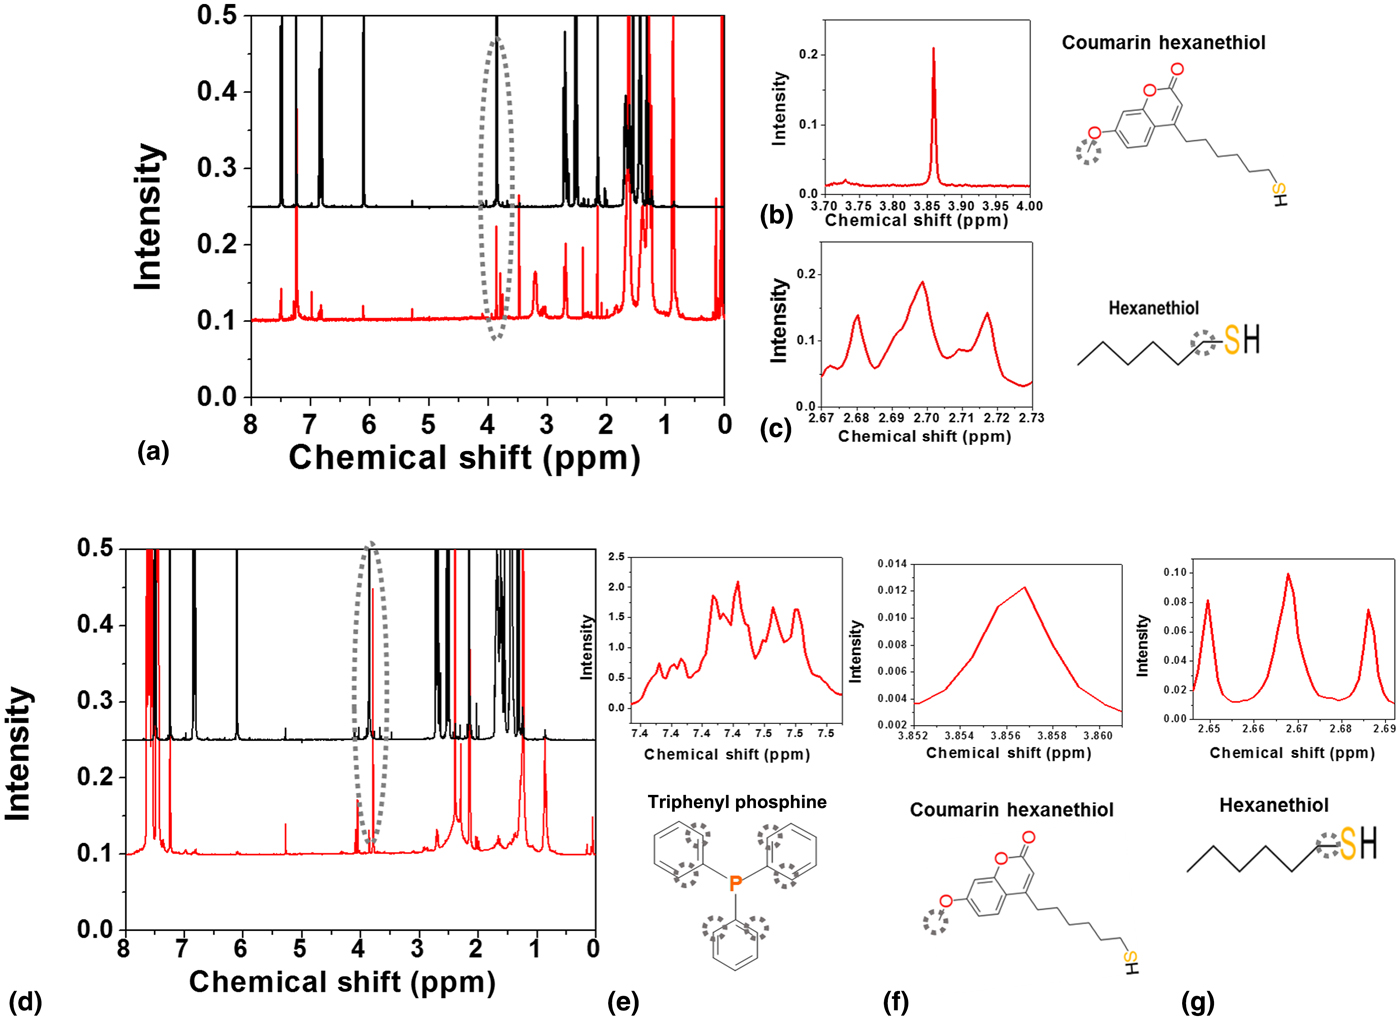
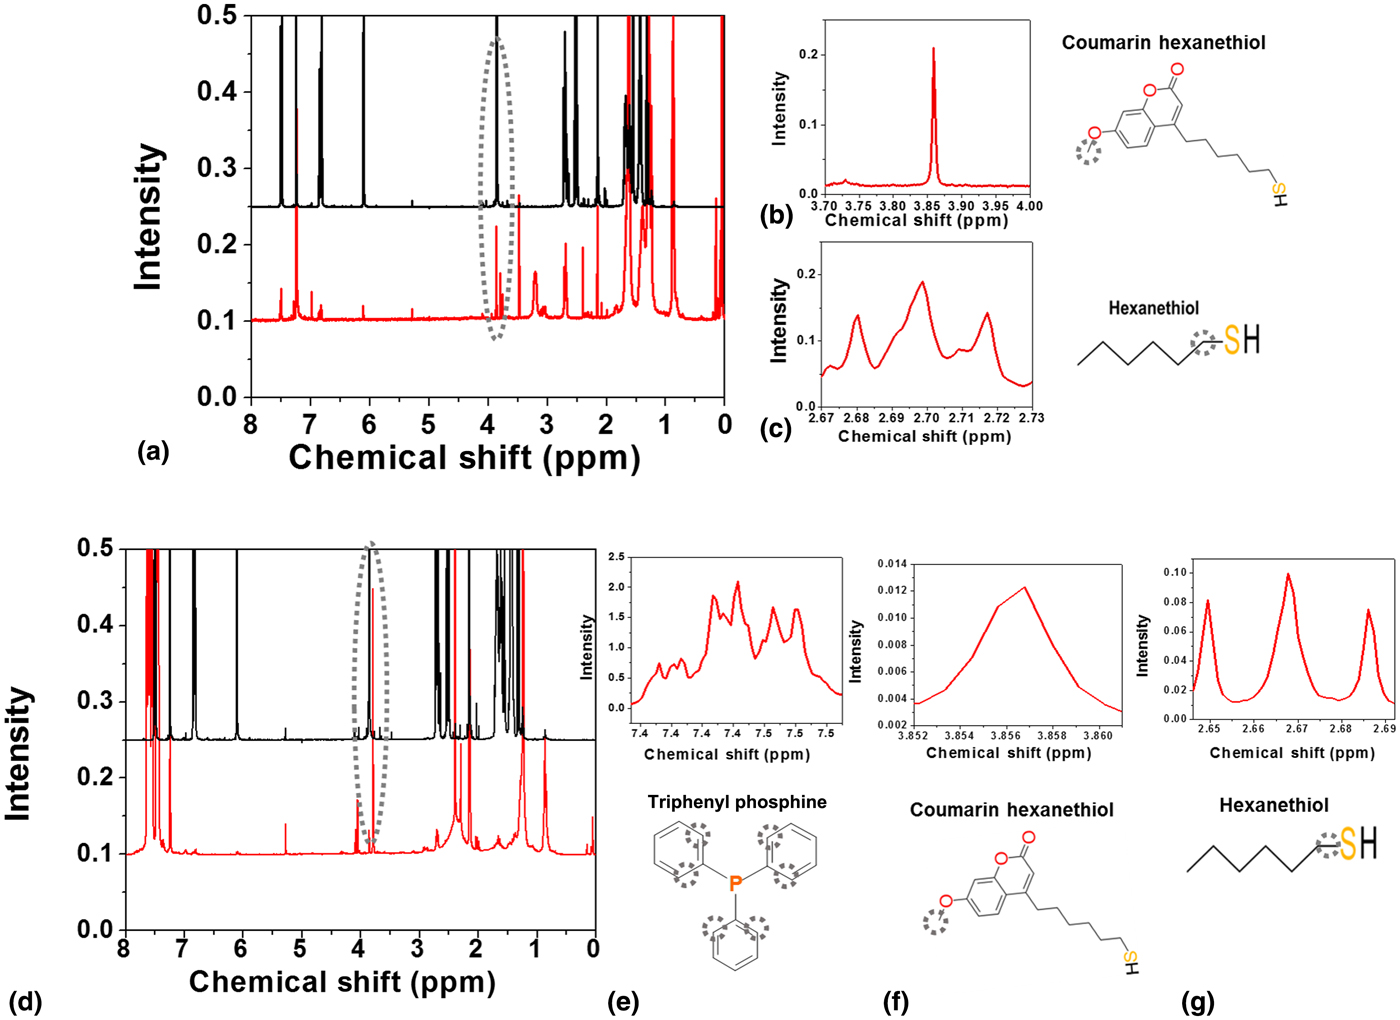
Figure 3 gives the proton NMR spectra of the ligand-exchanged products. Regions of interest were chosen in each case. The peak integral values for the methoxy group of Cou-SH (3.85 ppm) and the –CH2 on the α-carbon (2.7 ppm) on hexanethiol were used to find the number of dyes per cluster in i-Au25LE. Similarly, for bi-Au25LE, the same groups were chosen in addition to the α- and α′-carbon on the triphenylphosphine groups (7.4 ppm). The dye quantification with UV–vis subtraction and proton NMR resulted in a similar whole number formula of 1 and 3 on an average per particle for i-Au25LE and bi-Au25LE, respectively. The integration values are given in Supplementary Table S2.
Comparison of proton NMR analysis: (a) proton NMR of Cou-SH and i-Au25LE, the methoxy peak from the Cou-SH is circled in gray. (b) Region of interest (ROI) spectra from protons on the methoxy group and ligand structure. (c) Triplet from the protons on α-carbon from the thiol group in hexanethiol and its chemical structure. (d) Proton NMR of Cou-SH and bi-Au25LE, the methoxy peak from the Cou-SH is circled in gray. (e) ROI spectra from protons on the triphenylphosphine adjacent to the phosphorus bond. (f) ROI spectra from protons on the methoxy group and ligand structure. (g) Triplet from the protons on α-carbon from the thiol group in hexanethiol and its chemical structure.
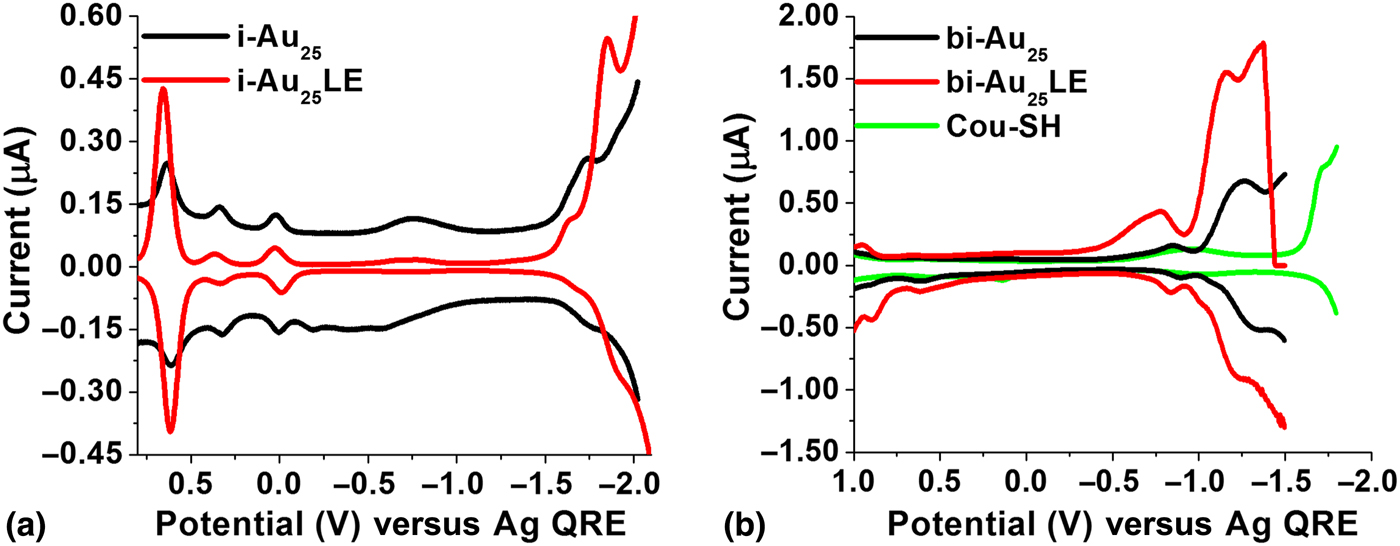
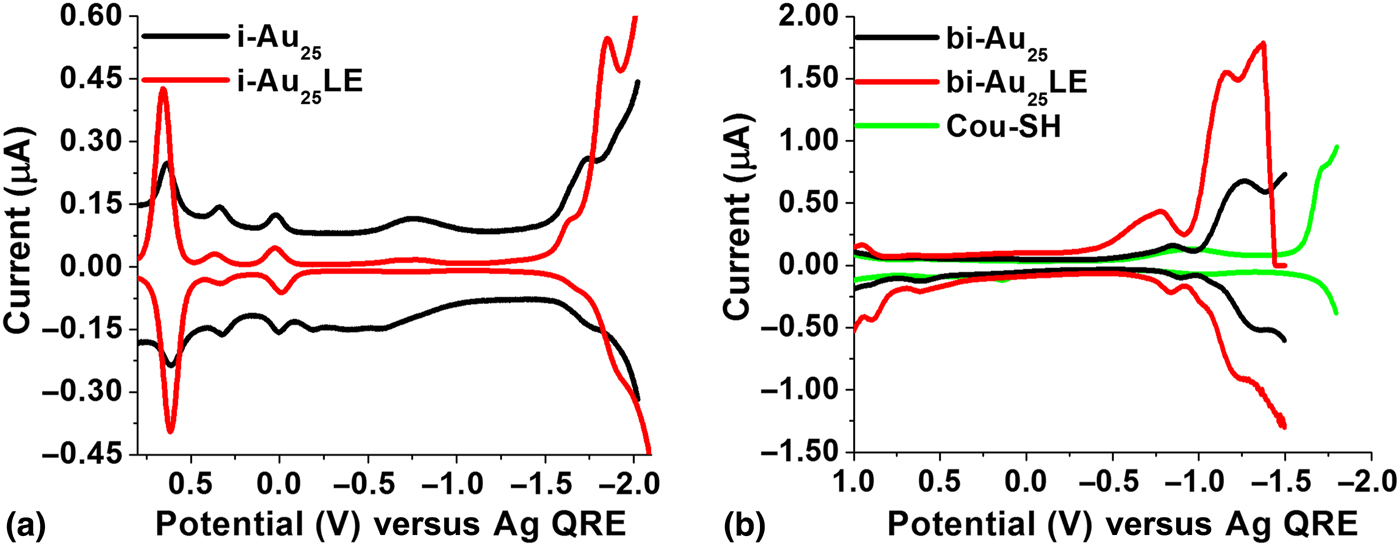
Electrochemical measurements were pursued to determine changes in the bandgap. The shift of the open circuit potential from zero indicated that the particles were a charged species. The square wave voltammograms (SWVs) of i-Au25 and bi-Au25 clusters corresponded with previously documented findings.[Reference Kwak, Thanthirige, Pyo, Lee and Ramakrishna30] The variation in the electrochemical gap between the two core structures is indicative of the structural differences. The ligand-exchanged SWVs suggest an electron transfer reaction in both cases instead of mass transfer as the UV spectra before and after the electrochemical measurements did not show significant changes. The i-Au25 systems were taken at −75 °C. The band gap changed from 1.76 to 1.64 V and in the bi-Au25 system, measured at room temperature the band gap changed from 1.4 to 1.2 V. The electrochemical bandgap measurements obtained from the SWV of bi-Au25 with that of the i-Au25 cluster were compared to reveal the electronic energy structure near the HOMO−LUMO levels. Lee and coworkers[Reference Park and Lee7] have shown that the band gap is smaller for the rod-shaped bi-Au25 compared to i-Au25. The decrease in the band gap in i-Au25LE to 1.64 V and in bi-Au25LE cluster to 1.2 V suggest significant electronic variations owing to replacement of the hexanethiol ligand with the Cou-SH in the staple motif S–Au–S–Au–S. Wang and coworkers[Reference Ahuja, Wang, Tang, Robinson, Padelford and Wang31] have reported previously that strong coupling exists between the Au core and ligand energy states with durene–dithiolate ligands. They noted that the electrochemical energy gap of bi-Au25 is also substantially smaller (1.4 V, measured at room temperature) than that of an icosahedral Au13 cluster (1.76 V) that was assigned as Au13(PPh3)4(SC12H25)2Cl2 by Menard et al..[Reference Menard, Gao, Xu, Twesten, Harper, Song, Wang, Douglas, Yang, Frenkel, Nuzzo and Murray24] In Fig. 4, the peak at +0.6 V is the oxidation potential from the internal standard ferrocence and not from the ligand. The peak at −1.8 V is due to Cou-SH. Pineda and coworkers[Reference García-Raya, Madueño, Blázquez and Pineda25] have also shown that the substituents on the Au25L18 clusters, where L = hexanethiol, have a direct effect on the redox potentials favoring reduction rather than oxidation. In addition, they have demonstrated that there are changes in bandgap only when there are electron donating or withdrawing groups, and this could be as large as 0. 45 V. Ramakrishna and coworkers[Reference Shabaninezhad, Abuhagr, Sakthivel, Kumara, Dass, Kwak, Pyo, Lee and Ramakrishna32] have also shown that this changes could also be attributed to electrostatic field effects due to the structure of the ligand and the substituents on the aromatic ring of Cou-SH.[Reference Kwak and Lee33]
Comparison of the square wave voltammograms of the (a) i- and (b) bi-Au25 products with the unbound Cou-SH.
In conclusion, we synthesized and characterized the ligand-exchanged products of i-Au25 and bi-Au25 with Cou-SH to produce i-Au25LE and bi-Au25LE, respectively. We compared the optical and electrochemical changes and projected the location of the incoming ligand based on bandgap changes, quenching of fluorescence, and the absence of S–H stretch in the IR spectra. Additionally, qualitative lifetimes indicate the attachment of Cou-SH to the cluster. In both cases, we note that the hexanethiol ligand was successfully replaced with Cou-SH. Additionally, we have shown the possibility of electron density transfer in the ground state due to changes in the bandgap, as noted from the square wave volatammograms. Fortunelli and coworkers[Reference Sementa, Barcaro, Baseggio, De Vetta, Dass, Aprà, Stener and Fortunelli5] have proved by time-dependent density functional theory that aromatic ligands with tailored electron withdrawing groups exhibiting steric hindrance achieve charge decompression at the surface-enhancing light absorption. This warrants additional studies of the excited state through transient absorption measurements. These clusters labeled with fluorophores can be used as excellent two-photon imaging agents and light-harvesting capabilities owing to the strong luminescence in the NIR region and the possibility to change the ligand states to fine tune the localization/delocalization of electrons.
Supplementary material
The supplementary material for this article can be found at https://doi.org/10.1557/mrc.2019.113.
Acknowledgments
We are grateful to Dr. Masaru Kuno for allowing us to use the TEM at the University of Notre Dame and ThermoFisher Corporation. We also thank Mr. Stephen Blama for his help with EDS. This work was supported by NSF MRI-1626326, and Towson University Fisher Chair, Fisher General Endowment, Faculty Development Research Committee, Fisher College Undergraduate Research, and Graduate Student Association Grants.
Conflicts of interest
The authors declare no conflicts of interest.