1. Introduction
Leading edge vortices (LEVs) are found in a large variety of biological and biomimetic flyers and other engineering applications under unsteady conditions, such as micro-air vehicles (MAVs), wind turbines and helicopter blades. The evolution of the vortices causes a strong deviation of the lift and drag forces from the well-defined values under steady conditions. As long as a growing vortex is attached to a wing, the delayed stall effect enhances lift, as explained by McCroskey (Reference McCroskey1982); however, upon detachment, lift drops significantly. Therefore, the prediction of the vortex behaviour in terms of growth rate, detachment time and maximal circulation as a function of unsteady on-flow conditions is of crucial interest for the design of unsteady wings or the development of more accurate models to predict airfoil loads for helicopters or wind turbines.
Often the growth duration and subsequent detachment of an LEV is attributed to an interaction with the trailing edge; in this case the chord length
 $c$
is the characteristic length scale describing the LEV formation. The most commonly known concept for predicting the LEV circulation in flapping flight is the concept of optimal vortex formation introduced by Gharib, Rambod & Shariff (Reference Gharib, Rambod and Shariff1998) and extended to flapping flight by Dabiri (Reference Dabiri2009). It predicts the period of non-dimensional time over which a single vortex created by an arbitrary vortex generator grows, and is defined as
 $T^{\ast }=C{\it\Gamma}/(D{\rm\Delta}U)$
. Here,
 ${\it\Gamma}$
is the circulation of the created vortex,
 $C$
is a constant depending on the vortex generator geometry,
 $D$
is a characteristic length scale and
 ${\rm\Delta}U$
is the velocity difference over the shear layer feeding into the vortex. Originally the parameters were defined for a piston–cylinder arrangement, with the stroke height of the piston as the characteristic length scale. Dabiri (Reference Dabiri2009) shows that
 $C=2$
for such a configuration. In flapping flight the wing stroke height
 $h$
is used as the characteristic length scale and the vortex generator constant is
 $C=1$
, as shown by Rival, Prangemeier & Tropea (Reference Rival, Prangemeier and Tropea2008).
For typical airfoil plunging motions Rival et al. (Reference Rival, Kriegseis, Schaub, Widmann and Tropea2014) rewrite the formation time in analogy with Dabiri (Reference Dabiri2009), given by
 $$\begin{eqnarray}T^{\ast }=\frac{{\it\Gamma}}{D{\rm\Delta}U}=\frac{U_{\infty }T{\it\delta}_{SL}{\rm\Delta}U/{\it\delta}_{SL}}{2h{\rm\Delta}U}=\frac{TU_{\infty }}{2h}=\frac{1}{\mathit{St}}.\end{eqnarray}$$
In (1.1)
 ${\it\delta}_{SL}$
is the thickness of the shear layer feeding the vortex. This shows that a direct connection between the Strouhal number and the optimal vortex formation number exists. This finding is supported by the results of Dabiri (Reference Dabiri2009), who finds vortex formation numbers of
 $T^{\ast }\approx 4$
for efficient flapping flight, and Nudds, Taylor & Thomas (Reference Nudds, Taylor and Thomas2004) and Triantafyllou, Techet & Hover (Reference Triantafyllou, Techet and Hover2004), who identify a narrow Strouhal number range of
 $\mathit{St}=0.2{-}0.3$
as characteristic for the same flight regime. The concept of optimal vortex formation has been tested experimentally by Rival et al. (Reference Rival, Prangemeier and Tropea2008) and Baik et al. (Reference Baik, Bernal, Granlund and Ol2012) for low reduced frequencies, and has been confirmed especially for flight parameters representing efficient forward flapping flight.
However, LEV formation and detachment depend on a large variety of parameters, like the reduced frequency, the Strouhal number, the number of wings and the angle of attack history. As more of these parameters are investigated in a wider range, less agreement with the concept of optimal vortex formation is found. Rival, Manejev & Tropea (Reference Rival, Manejev and Tropea2010) compute an LEV circulation for two wings in tandem arrangement, which far exceeds the value predicted by the concept of optimal vortex formation. DeVoria & Ringuette (Reference DeVoria and Ringuette2012) use an approach similar to the formulations given by Gharib et al. (Reference Gharib, Rambod and Shariff1998), Dabiri & Gharib (Reference Dabiri and Gharib2005), Krueger, Dabiri & Gharib (Reference Krueger, Dabiri and Gharib2006) and Ringuette, Milano & Gharib (Reference Ringuette, Milano and Gharib2007) to formulate a vortex formation time for experiments on low-aspect-ratio flat-plate fins under rapid rotation. They find formation time values between 0.26 and 0.59, which fall well below optimal formation times. The formation numbers encountered by Afanasyev (Reference Afanasyev2006), Pedrizzetti (Reference Pedrizzetti2010) and Domenichini (Reference Domenichini2011) for two-dimensional starting vortex formation from orifice flows do not correspond to the values predicted by optimal vortex formation. While their results are consistent with optimal vortex formation for their pitching and plunging airfoil experiments at low reduced frequencies, Baik et al. (Reference Baik, Bernal, Granlund and Ol2012) find much lower formation numbers for high reduced frequencies.
Jones & Babinsky (Reference Jones and Babinsky2011) investigate the influence of the Reynolds number on the LEV formation on a rapidly accelerated airfoil. Although the ‘LEV breakoff’ occurs at similar values of non-dimensional circulation values, the travelling distance of the airfoil at which the ‘breakoff’ occurs is different for different Reynolds numbers. Therefore, non-uniform vortex formation times are identified in their study. In most studies concerning LEV formation in unsteady aerodynamics, the chord length has been chosen as the parameter limiting the LEV size, implying a uniform LEV detachment mechanism that is linked to the airfoil chord length. Jones & Babinsky (Reference Jones and Babinsky2010) find situations for which the LEV created by a rapidly accelerating airfoil detaches before it reaches the trailing edge. This casts doubt on whether the chord length can considered as a universal length scale characterizing LEV formation. The variety of
 $T^{\ast }$
values encountered in the abovementioned studies suggests that the mechanism responsible for LEV detachment may not always be the same, depending on the particular flow conditions and airfoil kinematics.
For a fixed set of non-dimensional parameters with an optimal Strouhal number
 $\mathit{St}=0.25$
and fixed airfoil kinematics (
 $C=\text{constant}$
), the formation time
 $T^{\ast }=1/\mathit{St}$
is also expected to be constant. Taking the definitions for the reduced frequency
 $k={\rm\pi}c/UT$
and Strouhal number
 $\mathit{St}=2h/UT$
into account, the formation number can be rewritten an as
 $T^{\ast }=C{\it\Gamma}/cU_{\infty }$
. This formulation implies that for a fixed set of non-dimensional parameters the chord is the characteristic length for limiting vortex growth. By keeping the Strouhal number fixed, the hypothesis can be tested of whether deviations from the concept of optimal vortex formation for an optimal Strouhal number may be explained by different LEV detachment mechanisms and whether all LEV detachment mechanisms need to be related to the chord length or whether different formation times can be found for a varying chord length.
Two mechanisms have been postulated as being responsible for LEV detachment, one related to flow behaviour at the trailing edge and the other one relying on the viscous/inviscid interaction between the vortex and the airfoil. The former is referred to as the ‘bluff body detachment mechanism’, the latter as ‘boundary layer eruption’. Both mechanisms are briefly described below.
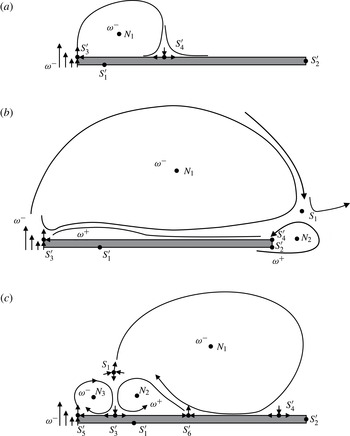
Topologically, the LEV is initially bounded by two half-saddles; one is at the leading edge where the shear layer feeding the LEV separates; the second is the LEV reattachment point as shown in figure 1(a) (labelled
 $S_{4}^{\prime }$
). As the LEV grows this reattachment moves further downstream on the airfoil surface. If the reattachment point moves beyond the trailing edge, it merges with the half-saddle stagnation point at the rear of the airfoil and forms a full saddle point
 $S$
in the free stream. The full saddle results in flow reversal at the trailing edge and, consistent with the sense of the LEV, an upstream boundary layer flow over the entire plate. This boundary layer contains vorticity of opposite sign (
 ${\it\omega}^{+}$
) to that of the LEV and of the shear layer separating from the leading edge (
 ${\it\omega}^{-}$
), as pictured in figure 1(b), and the LEV vortex can be considered to be detached. The interaction of the upstream-directed boundary layer and the shear layer at the leading edge initiates the next LEV, leading to the supposition that the geometrical length between the leading edge and the trailing edge, i.e. the chord, will govern the frequency of LEV formation, similarly to the well-accepted concept for flow around bluff bodies, in which the body diameter is the appropriate length scale (Roshko Reference Roshko1954; Gerrard Reference Gerrard1966).
Topological representation of the leading edge vortex:
 $N$
– node,
 $S$
– saddle,
 $S^{\prime }$
– half-saddle,
 ${\it\omega}$
– vorticity. (a) Flow topology during the formation of the LEV; (b) LEV detachment according to the bluff body detachment mechanism, with a full saddle point and flow reversal at the trailing edge; (c) flow topology after boundary layer eruption.

The boundary layer eruption-driven mechanism is inherent to any vortex/wall configuration and is independent of any geometric length scale. Doligalski, Smith & Walker (Reference Doligalski, Smith and Walker1994) explain this mechanism as the viscous response of a boundary layer to the imposed pressure gradient of a vortex. The LEV induces a velocity relative to the airfoil surface, which is maximal just below its core and decreases towards the stagnation point at the leading edge. This implies an adverse pressure gradient imposed on the boundary layer, which eventually separates from the airfoil surface as soon as the pressure gradient or vortex-induced velocity reaches some critical threshold. Doligalski et al. (Reference Doligalski, Smith and Walker1994) formulate this threshold in terms of the fractional convection rate
 $k^{\ast }={\it\Gamma}/(4{\rm\pi}yU_{\infty })$
(with
 ${\it\Gamma}$
as the vortex circulation,
 $y$
as its wall-normal distance and
 $U_{\infty }$
as the free stream velocity) for the generic case of an infinitely long wall, steady flow conditions, a rectilinear vortex velocity distribution and no external pressure gradient. A fractional convection rate of
 $k^{\ast }>0.25$
is given as a condition for boundary layer separation. From the definition it is evident that two possibilities exist for
 $k^{\ast }$
to increase above the critical value for separation: either the circulation increases or
 $y$
decreases. However, this critical value and the underlying conditions upon which is based are not directly applicable to the present case.
The boundary layer separation leads to the ejection of vorticity carrying fluid out of the boundary layer, which accumulates and forms a secondary vortex. This boundary layer eruption mechanism for vortex detachment is pictured in figure 1(c). Topological considerations (Foss Reference Foss2004) dictate that the formation of a secondary vortex with a node is accompanied by the formation of another node
 $N_{3}$
and saddle points
 $S_{5}^{\prime }$
and
 $S_{1}$
. A tertiary vortex (
 $N_{2}$
) with the same rotation direction as the LEV and a full saddle (
 $S_{1}$
) form. The full saddle redistributes the vorticity carrying fluid emerging from the shear layer: the vorticity is not fed into the primary LEV, but into the tertiary vortex, which in turn starts to grow. This mechanism may lead to vortex detachment independent of the length of the airfoil,
 $c$
.
Both mechanisms indicate the importance of the leading edge shear layer for LEV formation and detachment, since, in both cases, an interaction of secondary flow structures with the shear layer causes LEV detachment. A shear layer with a higher velocity gradient is more robust against this interaction, as suggested in Rival et al. (Reference Rival, Prangemeier and Tropea2008) and Rival et al. (Reference Rival, Kriegseis, Schaub, Widmann and Tropea2014). Moreover, the growth rate of the LEV mass and circulation is determined by the shear layer properties. For instance, Kaden (Reference Kaden1931) argues that the fluid emerging from the shear layer is directly advected into the LEV. Because the LEV circulation and its distance to the solid wall (given by its diameter) determine the boundary layer eruption, it is plausible that the shear layer affects the LEV detachment directly. As a first-order approximation, Roshko (Reference Roshko1954) and Didden (Reference Didden1979) express the rate of growth of LEV circulation
 $\dot{{\it\Gamma}}$
in (1.3) as the integration of vorticity flux
 ${\it\omega}(y)U(y)$
over the shear layer thickness
 ${\it\delta}_{SL}$
, with
 $U(y)$
as the velocity profile over the shear layer. The shear layer vorticity is approximated as
 ${\it\omega}\approx -(\partial U_{\infty }/\partial y)$
with
 $y$
as the wall-normal distance:
 $$\begin{eqnarray}\displaystyle & \displaystyle \dot{{\it\Gamma}}=\int _{y=0}^{{\it\delta}_{SL}}{\it\omega}(y)\frac{1}{2}U(y)\,\text{d}y, & \displaystyle\end{eqnarray}$$
 $$\begin{eqnarray}\displaystyle & \dot{{\it\Gamma}}\approx {\textstyle \frac{1}{2}}U_{\infty }^{2}. & \displaystyle\end{eqnarray}$$
Following Kaden (Reference Kaden1931), the mass flux can be calculated by integrating over the shear layer:
 $$\begin{eqnarray}\displaystyle & \displaystyle {\dot{m}}={\it\rho}\int _{y=0}^{{\it\delta}_{SL}}U(y)\,\text{d}y, & \displaystyle\end{eqnarray}$$
 $$\begin{eqnarray}\displaystyle & {\dot{m}}\approx {\textstyle \frac{1}{2}}{\it\rho}U_{\infty }{\it\delta}_{SL}. & \displaystyle\end{eqnarray}$$
The first-order approximations in (1.3) and (1.5) assume linear velocity profiles. While the mass flux
 ${\dot{m}}$
into the LEV directly depends on the shear layer thickness
 ${\it\delta}_{SL}$
, the rate of circulation growth
 $\dot{{\it\Gamma}}$
is independent of
 ${\it\delta}_{SL}$
. If one assumes that the shear layer emerges from the stagnation point on the pressure side of the airfoil and moves around the leading edge where it finally separates from the surface, the shear layer thickness may be approximated by the Falkner–Skan solution taken from Schlichting & Gersten (Reference Schlichting and Gersten2001):
 $$\begin{eqnarray}{\it\delta}_{SL}=2.4\sqrt{({\it\nu}/a)},\end{eqnarray}$$
where
 ${\it\nu}$
is the kinematic viscosity of the fluid and
 $a=(U(x,y))/x=-(V(x,y))/y$
is a constant describing the local flow field in the vicinity of a stagnation point. Because
 $a\propto U_{\infty }$
,
 ${\it\delta}_{SL}$
varies with
 ${\it\delta}_{SL}\propto U_{\infty }^{-0.5}$
. Therefore, the ratio of circulation and contained mass varies for an LEV according to the shear layer properties. This concept is in agreement with the considerations of Betz (Reference Betz1950), who emphasizes the impact of the shear layer thickness on vortex formation.
The flow around a pitching and plunging airfoil is described by the airfoil chord length
 $c~(\text{m})$
, the free stream velocity
 $U_{\infty }~(\text{m}~\text{s}^{-1})$
, the plunging height
 ${\rm\Delta}h~(\text{m})$
, the motion frequency or motion period
 $f=(1/T)~(\text{s}^{-1})$
, the angle of attack history
 ${\it\alpha}_{eff}~({-})$
and the kinematic viscosity of the fluid
 ${\it\nu}~(\text{m}^{2}~\text{s}^{-1})$
. According to the Buckingham-
 ${\rm\pi}$
theorem (Reference Buckingham1914), the three non-dimensional parameters, the Reynolds number
 $\mathit{Re}=(U_{\infty }c)/{\it\nu}$
, the Strouhal number
 $\mathit{St}=(2{\rm\Delta}h)/(U_{\infty }T)$
and the reduced frequency
 $k=({\rm\pi}c)/(U_{\infty }T)$
, are therefore sufficient to describe the flow. Keeping all non-dimensional parameters constant should ensure similarity between experiments with different dimensional parameter space.
However, this only takes global flow features into account; localized viscous effects like the boundary layer eruption or the shear layer thickness are not explicitly considered, for instance by taking the leading edge curvature or the separating shear layer properties into account. Therefore, the eruption-driven detachment mechanism may not be accounted for using only these parameters. If one increases the chord length of an unsteady (e.g. plunging) airfoil to semi-infinity, no flow reversal at the trailing edge can occur and an attached LEV would not detach due to the bluff body mechanism. However, the LEV does not grow indefinitely; it has to detach after some time. The possible detachment mechanism in this case is the boundary layer eruption. For short chord lengths, the bluff body detachment mechanism limits the LEV growth, before the eruption can even occur. Therefore, with increasing chord length, the LEV detachment mechanism must experience a transition from the bluff body type to the eruption-driven type. At large Reynolds number, viscous effects such as the eruption may be less influential, but they may be more important for low Reynolds number. Therefore, a critical combination of Reynolds number and chord length should exist, which forces a transition of the LEV detachment mechanism. For chord lengths below and Reynolds numbers above these critical values, the chord length is the characteristic length scale; however, systematic studies around these critical flow conditions have not yet been performed. The purpose of the present study is to test this hypothesis.
If the dimensional parameters of an unsteady airfoil are varied in such a way that the non-dimensional parameters
 $\mathit{Re}$
,
 $\mathit{St}$
and
 $k$
are kept constant, then the separating shear layer thickness cannot be kept unchanged (for a fixed leading edge geometry). For a constant Reynolds number
 $c\propto U_{\infty }^{-1}$
, the shear layer thickness dependence is
 ${\it\delta}_{SL}\propto U_{\infty }^{-0.5}$
.
Therefore, the shear layer thickness breaks the similarity between the experimental cases. For an experimental case with flow parameters leading to an eruption-driven detachment, an additional non-dimensional parameter considering the shear layer thickness is necessary to ensure similarity.
This article describes the experimental observations of the flow around a pitching and plunging sharp-edged flat plate, for which the chord length is increased systematically from
 $c=90~\text{mm}$
to 180 mm in order to observe a transition in the LEV detachment mechanism, while all non-dimensional parameters are kept constant. A deviation of the normalized circulation curves is expected when the LEV circulation is normalized with the chord and the free stream velocity for all cases. A relatively low Reynolds number of
 $\mathit{Re}=17\,000$
is chosen to highlight viscous effects, and a large reduced frequency of
 $k=0.5$
is chosen to underline unsteady effects. The Strouhal number
 $\mathit{St}=0.25$
is fixed to a value representative of efficient forward flight, according to Nudds et al. (Reference Nudds, Taylor and Thomas2004) and Triantafyllou et al. (Reference Triantafyllou, Techet and Hover2004).
A second issue investigated in this study concerns the influence of the competing time scales determined by the airfoil motion and the LEV inherent formation time. Taking into account the considerations of Roshko (Reference Roshko1954) and Didden (Reference Didden1979), expressed by (1.3), the increase in LEV circulation depends only on the free stream velocity. The time scale given by the airfoil motion therefore determines the phase lag between the LEV formation and the airfoil motion. This time scale is represented by the reduced frequency
 $k={\rm\pi}c/(TU_{\infty })$
. The isolated influence of the reduced frequency of the airfoil on the mechanisms leading to LEV detachment is investigated.
The range of reduced frequencies is extended to a lower range,
 $k=0.16$
, 0.24, 0.32 and 0.48, to identify its impact on the LEV formation at conditions that are especially representative for efficient forward flight, according to Triantafyllou et al. (Reference Triantafyllou, Techet and Hover2004). The highest reduced frequency,
 $k=0.48$
, has been selected to provoke a transition in the LEV detachment mechanism, which is expected to occur above a certain reduced frequency. The Reynolds number is fixed at a value of
 $\mathit{Re}=24\,000$
, representative of flapping flight, while the Strouhal number is fixed at
 $\mathit{St}=0.2$
to ensure conditions representative of efficient forward flight. The airfoil kinematics is a sinusoidal plunging motion.
1.1. Hypotheses
Several hypotheses about the impact of the reduced frequency can be formulated. First, two extreme cases may be considered. At low reduced frequencies, the LEV reaches the trailing edge and detaches before the maximal angle of attack has been reached in the airfoil motion and the LEV is no longer fed by the shear layer with vorticity. At high reduced frequencies, the largest effective angle of attack is exceeded before one of the detachment mechanisms is initiated. Consequently, at the onset of LEV detachment, the effective angle of attack is small, the shear layer is susceptible to interaction and the LEV can detach due to a boundary layer eruption. In this case, no trailing edge vortex (TEV) is expected, because the small LEV does not evoke flow reversal at the trailing edge and the effective angle of attack is small enough to avoid the roll-up of a TEV. For both cases, a low LEV circulation can be expected. At high
 $k$
the LEV detachment is triggered by the boundary layer eruption, which is the result of an increasing pressure gradient at the leading edge, caused by the decreasing effective angle of attack during the second half of the downstroke. Therefore, the airfoil kinematics determines the instant of LEV detachment, before the rear stagnation point of the LEV can exceed the trailing edge and cause the bluff body detachment mechanism. Between the extreme cases of high and low reduced frequencies, there must be one reduced frequency that adjusts to the LEV timing in such a way that the highest effective angle of attack and the flow reversal at the trailing edge coincide, producing maximal circulation.
For varying chord length, the transition in the LEV detachment mechanism occurs if the vortex–wall interaction evokes a boundary layer eruption before the LEV has reached the trailing edge and the bluff body mechanism is initiated. Therefore, the instant in the motion cycle when the LEV covers the whole chord length marks the boundary between the two detachment mechanisms.
Therefore, the ratio between the chord length
 $c$
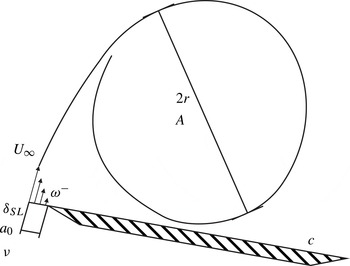
and the LEV size determined by the mass flux through the shear layer is used to determine the curve separating the two detachment mechanisms. Figure 2 schematically shows the mass flux through the shear layer into the LEV.
Schematical representation of the mass flux from the shear layer into the LEV.

All quantities describing the LEV size and influencing the mass flux are labelled. The area covered by the LEV is denoted by
 $A$
, assuming a circular vortex shape, and the LEV radius is denoted by
 $r$
. The mass flux
 $(U_{\infty }{\it\delta}_{SL})/2$
is given by the free stream velocity
 $U_{\infty }$
and the shear layer thickness
 ${\it\delta}_{SL}$
(which in turn depends on the kinematic viscosity of the fluid
 ${\it\nu}$
and the curvature denoted by
 $a_{0}$
). The motion period of the airfoil,
 $T$
, is characteristic for the time during which mass is transferred into the LEV. The transition parameter
 ${\it\kappa}_{trans}$
representing the ratio of approximate LEV radius
 $r$
and chord length
 $c$
is defined in (1.7). The radius
 $r$
is related to the approximate area covered by the LEV,
 $A$
, and assumes a circular shape (in (1.8)). The area
 $A$
is computed from the mass flux
 $(U_{\infty }{\it\delta}_{SL})/2$
into the LEV during one motion period
 $T$
in (1.9). The shear layer thickness
 ${\it\delta}_{SL}$
emerging from the stagnation point is estimated using the Falkner–Skan solution, given in (1.10):
 $$\begin{eqnarray}\displaystyle & \displaystyle {\it\kappa}_{trans}=\frac{2r}{c}, & \displaystyle\end{eqnarray}$$
 $$\begin{eqnarray}\displaystyle & \displaystyle r_{LEV}=\sqrt{\frac{A_{LEV}}{{\rm\pi}}}, & \displaystyle\end{eqnarray}$$
 $$\begin{eqnarray}\displaystyle & A_{LEV}\approx {\textstyle \frac{1}{2}}U_{\infty }{\it\delta}_{SL}T, & \displaystyle\end{eqnarray}$$
 $$\begin{eqnarray}\displaystyle & \displaystyle {\it\delta}_{SL}=2.4\sqrt{\frac{{\it\nu}}{a_{0}U_{\infty }}}. & \displaystyle\end{eqnarray}$$
The expression
 $U_{\infty }T$
can be replaced by
 ${\rm\pi}c/2k$
in (1.9), yielding
 $$\begin{eqnarray}{\it\kappa}_{trans}\approx \sqrt{2.4\ast 2}c^{-0.5}k^{-0.5}{\it\nu}^{0.25}a_{0}^{-0.25}U_{\infty }^{-0.25}.\end{eqnarray}$$
It can be seen from (1.11) that the transition of detachment mechanisms depends on three non-dimensional numbers: the reduced frequency
 $k^{(-0.5)}$
, the ratio of shear layer curvature and chord length
 $(ca_{0})^{(-0.25)}$
and the Reynolds number
 $((cU_{\infty })/{\it\nu})^{(-0.25)}$
, as a pair of velocity and chord length values. Therefore, the reduced frequency and the velocity–chord-length value pairs are investigated in this study to identify their effect on LEV detachment. The shear layer curvature
 $a_{0}$
was held approximately constant at a fixed value by using a sharp leading edge.
Although the exact value for
 ${\it\kappa}_{trans}$
for which both detachment mechanisms coincide cannot be determined analytically, since it depends on the shear layer and the motion history, it may be determined by inserting the experimental parameters of a case for which this coincidence is observed into (1.11).
2. Experimental set-up
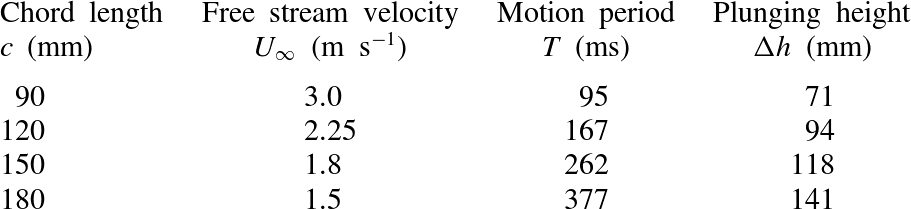
Particle image velocimetry (PIV) was used to investigate the flow field created by the pitching and plunging flat plates in the open return wind tunnel at the Technische Universität Darmstadt. For the first part of the study, four different chord lengths,
 $c=90$
, 120, 150 and 180 mm, were used. Five independent runs were executed per test case. The free stream velocity
 $U_{\infty }$
, the plunging height
 ${\rm\Delta}h$
, the motion period
 $T$
and the pitch angle were adjusted to maintain constant values for
 $\mathit{Re}$
,
 $\mathit{St}$
,
 $k$
and
 ${\it\alpha}_{eff}(t)$
; the dimensional parameters for the four test cases are given in table 1. One-shot experiments were performed in which the airfoil moved through one half-cycle, i.e. over the duration
 $T/2$
.
Dimensional experimental parameters for the four test cases with varying chord length.

The parameters for the experiments involving different reduced frequency values,
 $k=0.16$
, 0.24, 0.32 and 0.48, are listed in table 2. The chord length is
 $c=120~\text{mm}$
in all cases, and the effective angle of attack history is
 ${\it\alpha}_{eff}(t/T)=30^{\circ }\sin (2{\rm\pi}t/T)$
.
Dimensional experimental parameters for the four test cases with varying reduced frequency.

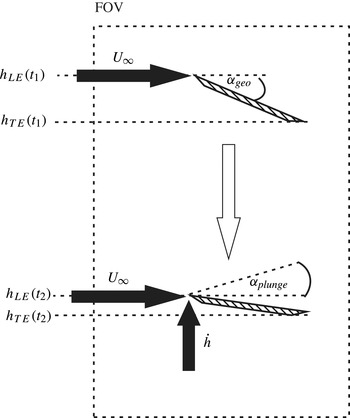
A schematic description of the airfoil kinematic motion is given in figure 3. A combined pitching and plunging motion leads to the separation of the boundary layer at the leading edge and subsequent roll-up of the shear layer into a distinct vortex. Linear actuators with a streamwise spacing of
 $s=80~\text{mm}$
create arbitrary pitching and plunging motions. In the two diagrams of figure 3, the airfoil is depicted right at the beginning of the stroke at
 $t_{1}$
(top) and later in the stroke cycle at
 $t_{2}$
(bottom).
Schematic representation of the combined pitching and plunging motion.

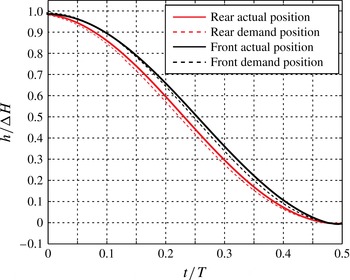
The actual motion of the upstream actuator (black) and the downstream actuator (red) is compared with the theoretical trajectory (dashed line) in figure 4 for the case of
 $c=90~\text{mm}$
. The real curves (solid lines) exhibit a small delay with respect to the demand trajectories (dashed lines).
Comparison between the theoretical linear actuator trajectories (dashed lines) and the actual position (solid lines) for the upstream (black) and downstream (red) actuators.

The camera field of view (FOV) is given by the dashed line. The parameters defining the airfoil motion are defined as follows:
 $h_{LE}$
is the height of the leading edge,
 $h_{TE}$
is the height of the trailing edge and
 $U_{\infty }$
denotes the free stream velocity. The plunging motion is given by the height of the pitch axis,
 $h_{LE}(t)=h_{0}\cos (2{\rm\pi}t/T)$
, and the plunging velocity
 ${\dot{h}}$
, with the amplitude
 $h_{0}$
and stroke period
 $T$
. The actuator controller monitored the actual actuator position, and if deviations of more than
 $1~\text{mm}$
from the specified motion were detected, the experiment was aborted. The plunging velocity causes an angle of attack
 ${\it\alpha}_{plunge}(t)=\text{atan}({\dot{h}}/U_{\infty })$
which is superimposed onto the geometrical angle of attack
 ${\it\alpha}_{geo}$
to obtain an effective angle of attack
 ${\it\alpha}_{eff}(t)={\it\alpha}_{plunge}(t)+{\it\alpha}_{geo}$
. The geometrical angle of attack is given by the height difference between the linear actuators on the airfoil,
 $h_{LE}$
and
 $h_{S}$
, and their spacing
 $s$
:
 ${\it\alpha}_{geo}(t)=\tan ^{-1}((h_{LE}-h_{S})/s)$
.
The Strouhal number is based on the height difference at the start and the end of the stroke,
 ${\rm\Delta}h=h_{TE}(t_{1})-h_{TE}(t_{2})$
. The turbulence level of the approach flow was measured to be
 $1\,\%$
using a set of hot-wire probes distributed along the wind tunnel span. The test section has a length of 2 m and a cross-section of
 $450~\text{mm}\times 450~\text{mm}$
.
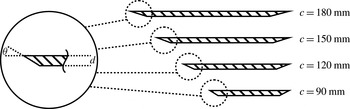
The airfoil spanned the width of the test section, creating nominally two-dimensional conditions. The thickness and leading edge shape of the airfoil remain unchanged. Figure 5 shows the flat-plate profiles used in the study schematically.
Geometry of the flat plates for the four cases involving changing the chord length.

The leading and trailing edges were sharp, with an angle of
 ${\it\Theta}=30^{\circ }$
, ensuring a well-defined separation location. The plate thickness was
 $d=6~\text{mm}$
. The pivot point of the pitch movement was placed at the leading edge to prevent the effective angle of attack from being influenced by the pitch rate of the profile. The sinusoidal plunging motion was determined by the position of the leading edge, and the pitch angle was set by the position difference between the linear actuators. Combined pitching and plunging motions were used to facilitate an effective angle of attack history of
 ${\it\alpha}_{eff}=30^{\circ }\sin (2{\rm\pi}t/T)$
. The blockage due to the pitch angle was in no case larger than
 $6\,\%$
.
Di-ethyl-hexyl-sebacat (DEHS) was introduced into the settling chamber to seed the flow. The diameter of the seeding particles is specified by the manufacturer to be
 $d_{DEHS}=1~{\rm\mu}\text{m}$
with a density of
 ${\it\rho}_{DEHS}=910~\text{kg}~\text{m}^{-3}$
. The response time (Stokes) is then given as
 ${\it\tau}_{s}={\it\rho}_{DEHS}d_{DEHS}^{2}/(18\times {\it\mu}_{air})=2.7~{\rm\mu}\text{s}$
. A minimum flow time scale
 ${\it\tau}_{F}$
was conservatively estimated to be the convective time of the Kolmogorov length scale
 ${\it\eta}_{K}$
, i.e.
 ${\it\tau}_{F}={\it\eta}_{K}/U_{\infty }$
. The Kolmogorov scale was given by
 ${\it\eta}_{K}=c\times \mathit{Re}^{-3/4}\approx 60~{\rm\mu}\text{m}$
, estimated using the chord as the macro length scale of the problem. This leads to a flow time scale of
 ${\it\tau}_{F}=20~{\rm\mu}\text{s}$
at a tunnel velocity of
 $U_{\infty }=3~\text{m}~\text{s}^{-1}$
, which is a factor
 ${>}7$
larger than the response time of the seeding particles.
A Litron LDY-303 laser was used to create a light sheet in the wind tunnel. The laser light sheet originated from downstream of the airfoil inside the wind tunnel, which resulted in regions upstream of and below the airfoil being shadowed. Particle image velocimetry image pairs were recorded by a Phantom V12 high-speed camera (12-bit monochrome image sensor with a resolution of
 $1280~\text{pixel}\times 800~\text{pixel}$
) at an acquisition frequency of 2 kHz. The laser output energy per pulse was 18 mJ for the given acquisition frequency. The overall size of the domain captured was 250 mm in the streamwise direction and 325 mm in the perpendicular direction. The raw images were correlated using the correlation software Dantec Dynamic Studio 3.4 with a stepwise multigrid technique, initially with an interrogation area (IA) size of
 $64~\text{pixel}\times 64~\text{pixel}$
and finally with an IA size of
 $16~\text{pixel}\times 16~\text{pixel}$
. The IA overlap was set to 50 %. The spatial resolution with respect to the chord length was 1.4 % for
 $c=180~\text{mm}$
, 1.68 % for
 $c=150~\text{mm}$
, 2.1 % for
 $c=120~\text{mm}$
and 2.8 % for
 $c=90~\text{mm}$
. The time between the two laser pulses was adjusted in such a way that the minimal resolvable velocity amounted to 2.9 % of the free stream velocity, if a subpixel resolution of 0.2 pixels was assumed, see Raffel et al. (Reference Raffel, Willert, Wereley and Kompenhans2007). Outliers (deviation greater than six times the local standard variation) were removed by using a
 $3\times 3$
neighbourhood filter. The averaged case-to-case variation of the flow field is defined as
 $\overline{{\it\sigma}}_{FOV}=(1/N_{IA})\sum _{N_{IA}}{\it\sigma}_{IA}$
for one time step, where
 $N_{IA}$
is the number of interrogation areas above the airfoil and
 ${\it\sigma}_{IA}$
is the local standard deviation of the five independent runs normalized by the free stream velocity
 $U_{\infty }$
. The variation
 $\overline{{\it\sigma}}_{FOV}$
was below 7 %, indicating repeatability of the single runs.
2.1. Data processing
The measured vorticity
 ${\it\omega}=(\partial V/\partial x)-(\partial U_{\infty }/\partial y)$
in the flow field cannot be exclusively attributed to a single flow structure. Therefore, a vortex identification scheme was applied to allocate circulation to the different flow structures, in this case to the primary LEV, the secondary vortex due to boundary layer eruption and the tertiary vortex rolling up at the leading edge during LEV detachment.
The integral method introduced by Graftieaux, Michard & Grosjean (Reference Graftieaux, Michard and Grosjean2001) was used to identify vortices by calculating two fields of scalars
 ${\it\Gamma}_{1}$
and
 ${\it\Gamma}_{2}$
from the velocity data. The scalars represent the circular motion of the flow in a predefined area around each discrete control point in the flow field. A point in the scalar fields for which the absolute values of these scalars exceed their respective thresholds of
 $|{\it\Gamma}_{1}|=0.9$
and
 $|{\it\Gamma}_{2}|=0.6$
is marked as a vortex centre (for
 ${\it\Gamma}_{1}$
) or vortex core (for
 ${\it\Gamma}_{2}$
). While
 ${\it\Gamma}_{2}$
is invariant of the flow velocity, a fixed laboratory frame was chosen for
 ${\it\Gamma}_{1}$
to ensure the conformity of the vortex centre with a critical point, which per definition exhibits zero flow velocity.
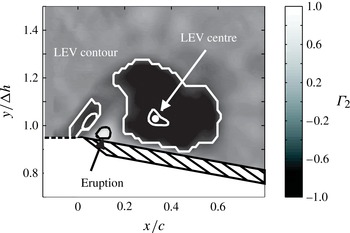
Figure 6 gives an example of the identified vortical structures near the airfoil leading edge. The figure shows a flooded grey-shade contour map of the scalar
 ${\it\Gamma}_{2}$
. The contours corresponding to the vortex core and centre according to the
 ${\it\Gamma}_{2}$
and
 ${\it\Gamma}_{1}$
criteria are marked. The areas covered by the LEV and its centre are marked. Additionally, the secondary vortex caused by the boundary layer eruption is identified, as well as the tertiary vortex directly at the leading edge. Such a configuration is in agreement with the topological constraints shown schematically in figure 1.
Example of the identified vortical structures using
 ${\it\Gamma}_{2}$
in the flow field above the airfoil.

The circulation of each structure was then calculated by an integration of vorticity
 ${\it\omega}$
over the respective area
 $A_{i}$
, which is marked by white lines in figure 6:
 ${\it\Gamma}_{i}=\iint {\it\omega}\,\text{d}A_{i}$
, with
 $i$
indicating the index of the respective flow structure. Here,
 ${\it\Gamma}^{LEV}$
is the circulation attributed to the LEV and
 ${\it\Gamma}^{Eruption}$
is the circulation attributed to the secondary vortical structure near the leading edge. According to Fage & Johansen (Reference Fage and Johansen1928), the LEV detachment is defined as the instant when a self-contained vortical structure is no longer fed any more vorticity through the shear layer and therefore the circulation reaches a peak value.
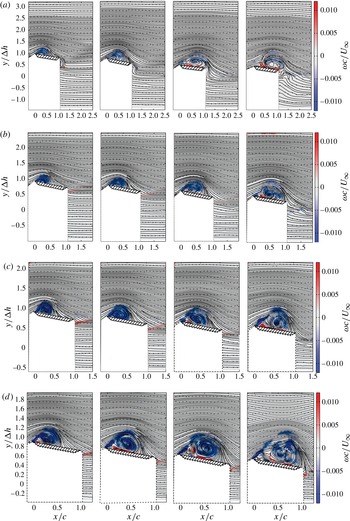
Flow field development in terms of normalized vorticity and streamlines for different chord lengths, (a)
 $c=90~\text{mm}$
, (b)
 $c=120~\text{mm}$
, (c)
 $c=150~\text{mm}$
, (d)
 $c=180~\text{mm}$
, and
 $t/T=0.18$
, 0.22, 0.26 and 0.30.

The global flow topology, and therefore the position of the rear reattachment point of the LEV, determines when the bluff body detachment mechanism is triggered. As soon as the rear reattachment moves beyond the trailing edge, flow reversal occurs at the trailing edge and fluid is transported upstream to interact with the separating shear layer. Therefore, this instant is considered as the time of incipient detachment. The rear reattachment point of the vortex,
 $X_{RP}$
, is defined as the location where the local flow velocity parallel to the plate at the measurement height closest to the wall changes its sign. After LEV detachment, the rear reattachment point (a half-saddle) becomes a full saddle and is identified by tracking the nearest critical point with a Poincaré–Bendixson index (PBI) of
 $-1$
behind the trailing edge in the flow field.
The results for each of the five independent experimental runs were averaged for better statistical certainty. The error bars presented in the following sections represent the standard deviation over the five experimental runs for the respective quantities. The vorticity/velocity fields are based on time-resolved non-averaged data.
3. Results – variation of the chord length
The results of the time-resolved PIV measurements are shown in figure 7 for the four plate chord lengths. The instantaneous streamlines and the colour coded normalized vorticity
 ${\it\omega}^{\ast }={\it\omega}c/U_{\infty }$
are given for non-dimensional time steps in the plunging motion
 $t/T=0.18$
, 0.22, 0.26 and 0.30. Negative vorticity appears blue and positive vorticity is red. The regions below and upstream of the airfoil are masked out due to shadowed regions of the PIV FOV. In all cases, a distinct vortex can be observed over the suction side of the airfoil with its feeding shear layer at the leading edge. As the motion period
 $t/T$
increases, a layer of positive vorticity forms below the LEV on the suction side of the airfoil due to the no-slip condition. Subsequently, secondary structures emerge from this layer, leading to LEV detachment and a full saddle in the free stream above the leading edge. This full saddle initiates the LEV detachment by a redistribution of fluid emerging from the shear layer into the tertiary structure. The circulation calculation is limited to the LEV (given by the largest vortical structure in the flow field) and the secondary vortex near the leading edge.
The time instants shown in figure 7 have been chosen to show early LEV development and the LEV prior to and after detachment. It should be noted that the normalized vorticity
 ${\it\omega}^{\ast }={\it\omega}c/U_{\infty }$
for
 $c=90~\text{mm}$
appears weaker, because
 $c$
is minimal and
 $U_{\infty }$
is maximal in that case. A secondary structure at the leading edge of the airfoil for
 $c=90~\text{mm}$
appears only after the LEV rear attachment point has moved beyond the trailing edge, whereas for
 $c=120~\text{mm}$
,
 $c=150~\text{mm}$
and
 $c=180~\text{mm}$
the evolution of such a structure is already present before the LEV rear attachment point has reached the trailing edge. For the time step
 $t/T=0.26$
, for
 $c=90~\text{mm}$
the reversed flow below the LEV, containing positive vorticity, is clearly visible. Prior to this time, no secondary structures appear in the flow field. In contrast, this flow reversal does not occur for
 $c=120~\text{mm}$
,
 $c=150~\text{mm}$
and
 $c=180~\text{mm}$
until the LEV has detached from the airfoil. This indicates that the boundary layer has separated independently of any length scales related to the airfoil chord. The size or area covered by the LEV increases with decreasing free stream velocity, which is consistent with theoretical considerations.
The temporal evolution of the non-dimensional LEV circulation,
 $({\it\Gamma}^{LEV})/cU_{\infty }$
, the circulation of the secondary structure,
 $({\it\Gamma}^{Eruption})/cU_{\infty }$
, and the position of the rear reattachment point,
 $(X_{RP})/c$
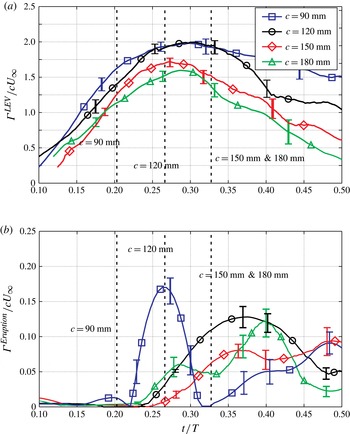
, were calculated from the experimental data. Figure 8 shows the normalized LEV circulation for a period of
 $t/T=0.1{-}0.5$
. The instants in time for which the rear LEV reattachment point reaches the trailing edge,
 $(X_{SP})/c=1$
, are marked by a vertical dashed line; the standard deviation of the position of the rear stagnation point at that instant is 5 % of the chord length at most.
Development of the circulation for the LEV and the boundary layer eruption zone. (a) Chord based normalized LEV circulation
 ${\it\Gamma}^{LEV}/(cU_{\infty })$
; (b) chord based normalized eruption circulation
 ${\it\Gamma}^{Eruption}/(cU_{\infty })$
.

The non-dimensional times for
 $X_{RP}=c$
are different for the different experimental cases, shifting towards earlier times for shorter chord lengths. This indicates smaller LEV sizes with respect to the chord length with increasing free stream velocities, due to thinner shear layers, which agrees with the theoretical considerations in § 1.
Early in the stroke cycle, a compact LEV rolls up at the leading edge of the airfoil. After the initial formation, its circulation increases at an approximately constant rate until a peak in circulation is reached and the LEV detaches. After LEV detachment, the LEV breaks up, loses its spatial coherence and the vortex identification scheme yields lower values of the circulation of the remaining vortex core.
The peak values of the normalized LEV circulation decrease with increasing chord length. Although the non-dimensional parameters of all experimental cases are kept constant, the circulation curves do not collapse. A completely different behaviour is observed for the circulation development of the secondary vortical structures in figure 8(b). For
 $c=90~\text{mm}$
the secondary vortical structure exhibits a peak early in the stroke cycle, which immediately follows the flow reversal at the trailing edge. In contrast, for all other cases, the formation of the secondary structures coincides with (
 $c=120~\text{mm}$
) or even precedes (
 $c=150~\text{mm}$
and
 $c=180~\text{mm}$
) the movement of the rear reattachment point beyond the trailing edge, indicating that the formation of the secondary vortical structure is independent of the chord length. These observations suggest that different mechanisms lead to the LEV detachment for the case
 $c=90~\text{mm}$
on one hand and the cases
 $c=150~\text{mm}$
and
 $c=180~\text{mm}$
on the other hand. Since both events roughly coincide for
 $c=120~\text{mm}$
, the detachment may be a mixture of both mechanisms.
To estimate the effect of the boundary layer eruption on the LEV detachment, the fractional convection rate
 $k^{\ast }={\it\Gamma}_{1}/(4{\rm\pi}yU_{\infty })$
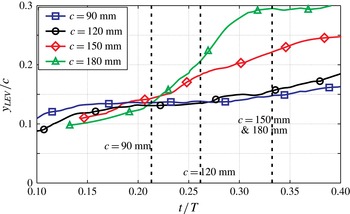
introduced by Doligalski et al. (Reference Doligalski, Smith and Walker1994) was estimated experimentally by tracking the wall-normal distance of the vortex centre (given by the maximum value in the
 ${\it\Gamma}_{1}$
field); the normalized wall distance
 $y/c$
is given in figure 9. Doligalski et al. (Reference Doligalski, Smith and Walker1994) connect the occurrence of the boundary layer eruption with a critical value of
 $k^{\ast }$
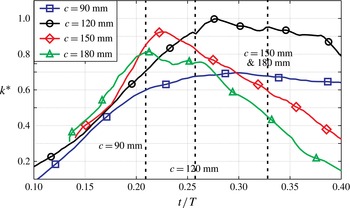
being exceeded. The result is given in figure 10.
Normalized wall-normal distance of the vortex centre and the solid surface
 $y/c$
. The dashed lines indicate the times at which
 $X_{RP}=c$
.

Vortex-induced normalized velocity
 $k^{\ast }$
responsible for the eruptive boundary layer response according to Doligalski et al. (Reference Doligalski, Smith and Walker1994). The dashed lines indicate the times at which
 $X_{RP}=c$
.

The fractional convection rate
 $k^{\ast }$
for
 $c=90~\text{mm}$
is low compared with all other cases. This may suggest that the critical value of
 $k^{\ast }$
is exceeded at some instant in the stroke cycle for
 $c=120~\text{mm}$
,
 $c=150~\text{mm}$
and
 $c=180~\text{mm}$
, but not for
 $c=90~\text{mm}$
. For
 $c=150~\text{mm}$
and
 $c=180~\text{mm}$
, the maximum value of
 $k^{\ast }$
occurs well before
 $(X_{SP})/c=1$
, again indicating chord length independence of this detachment criterion. In summary, the lack of collapse of the LEV circulation curves may be attributed to different LEV detachment mechanisms; the chord length
 $c$
is not the proper characteristic length for all cases.
3.1. Shear layer based normalization
Taking the hypothesis proposed in the introduction into account, and considering the results presented above, an alternative normalization method for the LEV circulation is now introduced and tested. It is expected that the LEV circulation curves should collapse for a normalization based on characteristic parameters of the shear layer separating at the leading edge, at least for the experimental cases (
 $c=150~\text{mm}$
and
 $c=180~\text{mm}$
, perhaps
 $c=120~\text{mm}$
) in which the same eruption-driven mechanism leads to LEV detachment. In contrast to the non-dimensional parameters
 $\mathit{Re}$
,
 $\mathit{St}$
and
 $k$
, the shear layer thickness could not be kept constant for all experimental cases. To assess the shear layer thickness
 ${\it\delta}_{SL}$
, the Falkner–Skan equation
 ${\it\delta}_{SL}=2.4\sqrt{({\it\nu}/a)}$
(Schlichting & Gersten Reference Schlichting and Gersten2001) with the
 $m=1$
was used under the assumption that the shear layer emerges from a stagnation point on the pressure side of the airfoil. Because the parameter
 $a=(U_{\infty }(x,y))/x=-((V(x,y))/y)$
(with the origin of the coordinate system (
 $[x~y]=[0~0]$
) placed at the stagnation point) was not accessible, the velocity field around the stagnation point was estimated using potential flow theory for a flat plate inclined at a maximal angle of attack of
 ${\it\alpha}_{eff}=30^{\circ }$
under the assumptions of steady inviscid flow and neglecting the influence of the LEV attached to the airfoil suction side. The parameter
 $a_{0}=a/U_{\infty }$
was calculated from the mean value over a circular region with a diameter of 10 % of the respective chord length around the stagnation point. The coefficient
 $a_{0}$
was estimated for all cases to be
 $a_{0}=2.77$
, 2.78, 2.75 and 2.76
 $1/m$
with a corresponding standard deviation of
 ${\it\sigma}(a_{0})=6.40$
, 6.48, 5.82 and 5.76 %. In all cases,
 $a_{0}$
was uniform in the circular region, implying the correctness of the assumptions. The shear layer thickness was then estimated using the mean value
 $\overline{a}_{0}=2.765~(1/m)$
, yielding
 ${\it\delta}_{SL}=2.4{\it\nu}^{0.5}a_{0}^{-0.5}U_{\infty }^{-0.5}$
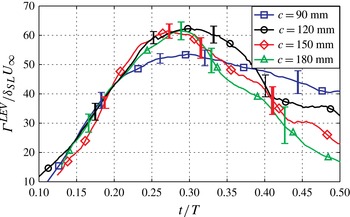
. The LEV circulation normalized with this length scale was then given by
 $$\begin{eqnarray}{\it\Gamma}^{\ast }=\frac{{\it\Gamma}^{LEV}}{{\it\delta}_{SL}U_{\infty }}=\frac{a_{0}^{0.5}}{2.4{\it\nu}^{0.5}}\frac{{\it\Gamma}}{U_{\infty }^{0.5}}.\end{eqnarray}$$
This alternative normalization of the LEV circulation curves is shown in figure 11. It can be seen that the circulation curves collapse for the cases
 $c=120~\text{mm}$
,
 $c=150~\text{mm}$
and
 $c=180~\text{mm}$
, which exhibit LEV detachment through boundary layer eruption, but fail for the case
 $c=90~\text{mm}$
, where the LEV detaches due to the bluff body mechanism. The ratio of circulation flux (
 ${\approx}U_{\infty }^{2}/2$
) versus mass flux (
 ${\approx}{\it\delta}_{SL}U_{\infty }$
) out of the shear layer decreases from the case
 $c=90~\text{mm}$
(with the thinnest shear layer and the highest velocity) to the case
 $c=180~\text{mm}$
(with the thickest shear layer and the lowest velocity). Hence, with decreasing vorticity in the shear layer (
 $\propto U_{\infty }{\it\delta}_{SL}^{-1}$
) the LEV has to accumulate more mass to achieve the same circulation. The velocity gradients are smaller and the LEV is less compact. If a Reynolds number based on the LEV circulation,
 $\mathit{Re}_{LEV}=({\it\Gamma}^{LEV})/{\it\nu}$
, is defined, it decreases (and therefore promotes viscous effects like the boundary layer eruption) with decreasing free stream velocity
 $U_{\infty }$
, as can be seen in figure 8(a).
Normalized LEV circulation based on the shear layer properties according to (3.1).

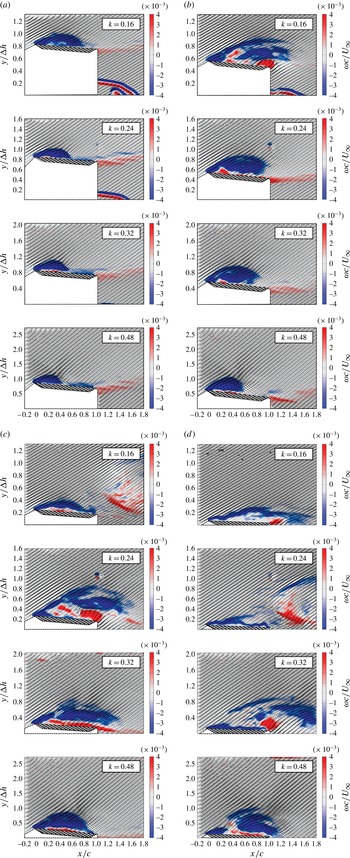
4. Results – variation of the reduced frequency
The time-resolved velocity fields of all four reduced frequencies (
 $k=0.16$
, 0.24, 0.32 and 0.48) are depicted in figure 12. Each row shows a single reduced frequency while each panel represents a time instant of the motion period,
 $t=T~D~0:15$
, 0.25 in the first half of figure 12. In the second half of figure 12 each row shows a single reduced frequency at a time instant of the motion period,
 $t=T~D~0.35$
, 0.45, represented by each panel. The normalized vorticity
 $({\it\omega}c)/U_{\infty }$
is given as contours, with blue representing negative vorticity and red representing positive vorticity. The local flow velocity is represented by vectors at every second IA. The development of a distinct LEV can be observed in all cases. For lower reduced frequencies, the LEV has developed faster and the rear reattachment point
 $X_{RP}$
reaches the trailing edge earlier with respect to the airfoil motion period. In later stages of the airfoil motion, a TEV develops for
 $k=0.16$
, 0.24 and 0.32, but not for
 $k=0.48$
, when the LEV detaches before its rear reattachment point
 $X_{RP}$
has reached the trailing edge. Instead of a TEV, a secondary vortex, altering the flow topology, forms around
 $t/T=0.45$
at the leading edge.
Flow field development in terms of normalized vorticity and velocity vectors for different reduced frequencies and
 $t/T=0.15$
(a), 0.25 (b), 0.35 (c) and 0.45 (d).

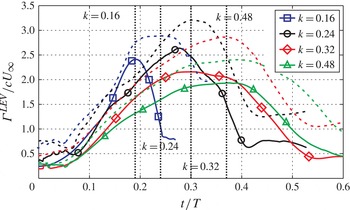
In figure 13 the normalized LEV circulation
 $({\it\Gamma}^{LEV})/(cU_{\infty })$
for all four cases is shown using solid lines and the normalized negative circulation contained in all vortical structures in the flow field
 ${\it\Gamma}^{-}/(cU_{\infty })$
is shown with dashed lines. The divergence between
 $({\it\Gamma}^{LEV})/(cU_{\infty })$
and
 ${\it\Gamma}^{-}/(cU_{\infty })$
indicates the onset of the formation of a secondary LEV at the leading edge. The instant in the motion cycle when the rear reattachment point moves beyond the trailing edge is indicated by vertical dashed lines. It is apparent that the maximum circulation differs strongly from case to case. While the normalized negative circulation contained in all vortical structures in the flow field reaches a level of
 ${\it\Gamma}^{-}/(cU_{\infty })=3.3$
for
 $k=0.24$
, and therefore corresponds roughly to the level predicted by the concept of optimal vortex formation, the peak values in all other cases are significantly lower. The peaks are shifted towards later stages in the stroke cycle with increasing
 $k$
. These observations agree with Nudds et al. (Reference Nudds, Taylor and Thomas2004) and Triantafyllou et al. (Reference Triantafyllou, Techet and Hover2004), who found the highest force production at reduced frequencies around
 $k=0.2\dots 0.35$
, and Baik et al. (Reference Baik, Bernal, Granlund and Ol2012), who found deviations from the concept of optimal vortex formation especially at higher reduced frequencies.
Comparison of the entire circulation produced at the leading edge,
 ${\it\Gamma}^{-}$
(dashed lines), and the circulation attributed to the LEV,
 ${\it\Gamma}^{LEV}$
(solid lines).

The LEV circulation alone exhibits a similar behaviour, although at a lower magnitude. For
 $k=0.16$
the LEV circulation drops immediately after flow reversal at the trailing edge, indicating LEV detachment. The drop in circulation occurs because the reverse flow boundary layer carries vorticity of opposite sign to that of the LEV or the separating shear layer at the leading edge, therefore decreasing the overall vorticity in the LEV. Furthermore, following detachment, the vortex begins to break up and loses its spatial coherence, leading to a lower value of circulation computed using the identification scheme.
For
 $k=0.24$
, the instant when the rear reattachment point exceeds the trailing edge coincides with the largest effective angle of attack around
 $t/T\approx 0.25$
when the shear layer is most resistant against interaction (as shown by Rival et al.
Reference Rival, Prangemeier and Tropea2008). It should be noted that both circulation curves for
 $k=0.16$
and
 $k=0.24$
exhibit the same circulation level when the rear reattachment point reaches the trailing edge. Consequently, the LEV for
 $k=0.24$
grows further until it reaches its peak value. For
 $k=0.32$
, the peak in LEV circulation again coincides with
 $X_{RP}=c$
. Only the LEV circulation for
 $k=0.48$
exhibits a somewhat different behaviour. It reaches a plateau around
 $t/T\approx 0.3$
before
 $X_{RP}=c$
and starts to deviate from the overall circulation well before
 $X_{RP}=c$
. Its limiting mechanism appears not to be directly linked with the trailing edge.
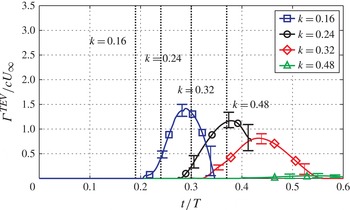
To support the proposition that the LEV detachment for
 $k=0.48$
is not attributed to the bluff body mechanism, the TEV circulation for all reduced frequencies is shown in figure 14. For
 $k=0.16$
, 0.24 and 0.32, a distinct TEV develops after flow reversal at the trailing edge, but for
 $k=0.48$
no flow reversal is present and only a wake is formed. In the wake immediately next to the trailing edge, fluid from the pressure side curls around the trailing edge and rolls up into a distinct TEV, which grows until it detaches from the airfoil. During its growth period, the TEV circulation increases. The peak in TEV circulation is reached when the TEV detaches from the airfoil and can no longer grow. The subsequent drop occurs as the TEV breaks up after separation and loses its spatial coherency. The decreasing magnitude of the circulation may be a result of smaller effective angles of attack at the onset of TEV formation for the different cases.
Trailing edge vortex circulation development for different reduced frequencies.

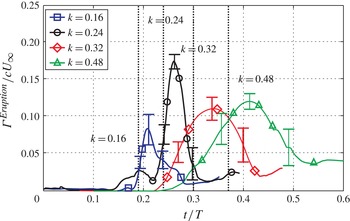
The evolution of the circulation of the eruption,
 $({\it\Gamma}^{Eruption})/(cU_{\infty })$
, near the leading edge, given in figure 15, shows that for the cases of higher reduced frequencies
 $k=0.32$
and 0.48 distinct secondary structures develop independently of the position of the rear reattachment point: considerable levels of circulation have already been reached before
 $X_{RP}=c$
. The circulation of the secondary structure is built up by fluid of positive vorticity ejected from the boundary layer (which may either be attributed to the flow reversal at lower
 $k$
or to the boundary layer eruption for higher
 $k$
, or a combination thereof). The interaction of the secondary structure with the shear layer causes a cancellation of vorticity, which leads to a drop in the circulation curves presented in figure 15 and ultimately results in the detachment of the LEV. As the LEV convects away from the airfoil, the adverse pressure gradient to support the growth of the secondary structure diminishes.
Development of the circulation of the secondary vortex structure near the leading edge for different reduced frequencies.

It should be noted that the instant when the peak values in LEV circulation are reached coincides with that of the eruption vortex for
 $k=0.32$
and 0.48, which indicates that the secondary structures play a significant role in the limitation of the LEV size. This finding is consistent with the results of Wojcik & Buchholz (Reference Wojcik and Buchholz2014), who also identified the significant role that secondary vorticity induced by an LEV over a rotating wing plays in limiting the LEV circulation. The occurrence of these secondary structures may explain the different LEV detachment processes. For a reduced frequency of
 $k=0.24$
the magnitude of
 $({\it\Gamma}^{Eruption})/(cU_{\infty })$
is higher, while for low (
 $k=0.16$
) and high (
 $k=[0.32,0.48]$
) reduced frequencies lower magnitudes of
 $({\it\Gamma}^{Eruption})/(cU_{\infty })$
are sufficient to cause LEV detachment. Analogously, the velocity difference over the shear layer at the instant of LEV detachment is larger for
 $k=0.24$
than for all other reduced frequencies. Smaller secondary structures are sufficient to cause LEV detachment at weaker shear layers.
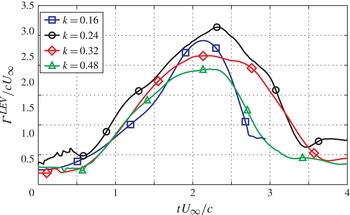
Finally, the LEV circulation growth rate is plotted against the convective time scale
 $(tU_{\infty })/c$
in figure 16 to verify whether the LEV evolution time scale is independent of the airfoil motion time scale
 $T$
. The circulation growth rate is roughly the same in all four cases, and even the LEV peak values are reached around the range of
 $(tU_{\infty })/c\approx 2.2{-}2.5$
.
Leading edge vortex circulation development for different reduced frequencies over the convective time scale
 $tU_{\infty }/c$
.

5. Discussion – variation of the chord length
An increasing free stream velocity
 $U_{\infty }$
decreases the shear layer thickness
 ${\it\delta}_{SL}$
and therefore increases the shear layer vorticity
 ${\it\omega}_{SL}\approx U_{\infty }/({\it\delta}_{SL})$
and decreases viscous effects. The LEV growth in cases of high free stream velocities is therefore limited by the chord length. However, as seen in § 3, the non-dimensional peak circulation values for cases with lower free stream velocity fall below the peak value of the LEV circulation at the highest free stream velocity. This dependence of maximal LEV circulation on the shear layer properties has already been observed by Rival et al. (Reference Rival, Prangemeier and Tropea2008) and Rival et al. (Reference Rival, Kriegseis, Schaub, Widmann and Tropea2014). In these cases, a viscous mechanism inherent to vortex–wall interaction appears. It is assumed that the larger shear layer thickness and the lower LEV based Reynolds number
 $\mathit{Re}_{LEV}=({\it\Gamma}^{LEV})/{\it\nu}$
promote boundary layer eruption. A combination of the interaction-prone shear layer at low free stream velocities and this boundary layer eruption is assumed to cause the LEV to detach from the airfoil. The alternative normalization method proposed here takes the shear layer thickness
 ${\it\delta}_{SL}$
and the mass flux
 ${\it\delta}_{SL}U_{\infty }$
into account. The non-dimensional peak values of all cases attributed to the boundary layer eruption therefore collapse.
To determine a numerical value of the transition parameter
 ${\it\kappa}_{trans}$
, which indicates the combination of parameters for which both LEV detachment mechanisms coincide and therefore a transition takes place, the experimental results are used. If the case
 $c=120~\text{mm}$
is considered, for which both detachment mechanisms occur at roughly the same time,
 ${\it\kappa}_{trans}$
can be approximated by inserting the parameters of the case
 $c=120~\text{mm}$
into (1.11). The transitional value is estimated to be
 ${\it\kappa}_{trans}=0.358$
.
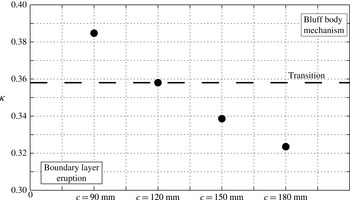
Figure 17 shows
 ${\it\kappa}$
for each experimental case as dots. The case with
 $c=120~\text{mm}$
and
 ${\it\kappa}(c=120~\text{mm})={\it\kappa}_{trans}$
is shown as a horizontal dashed line, indicating flow conditions for which a transition between the two detachment mechanisms occurs. For
 ${\it\kappa}(c=90~\text{mm})>{\it\kappa}_{trans}$
the bluff body detachment mechanism prevails, while for
 ${\it\kappa}(c=180~\text{mm})<{\it\kappa}(c=150~\text{mm})<{\it\kappa}_{trans}$
the boundary layer eruption causes LEV detachment. A transition in the LEV detachment mechanism therefore occurs for a certain set of dimensional parameters, although their non-dimensional equivalents are constant. It should be noted that this transition prediction curve is only valid within strict limits, especially to small Reynolds numbers
 $\mathit{Re}=17\,000$
, sinusoidal airfoil kinematics and high reduced frequencies
 $k=0.5$
.
Estimated transitional conditions for the LEV detachment mechanisms at
 ${\it\kappa}_{trans}=0.358$
, and
 ${\it\kappa}$
values for each set of parameters for different chord lengths, shown as dots.

6. Discussion – variation of the reduced frequency
A change in the reduced frequency causes a phase shift in the LEV evolution relative to the airfoil kinematics, especially in the effective angle of attack history
 ${\it\alpha}_{eff}(t/T)$
. While the angle of attack history
 ${\it\alpha}_{eff}(t/T)$
is directly a function of the airfoil kinematics with the period
 $T$
, the vortex development is independent, as seen in § 4. As a result, an optimal reduced frequency exists for which a maximum of circulation can be created, approximately corresponding to the predictions of optimal vortex formation. At higher and lower reduced frequencies deviations from this concept can be observed. At lower
 $k$
the flow reversal occurs early in the stroke cycle when the effective angle of attack
 ${\it\alpha}_{eff}$
is small and the shear layer is susceptible to interactions, which makes the LEV detach at a lower level of circulation. If the reduced frequency is sufficiently high, the formation of secondary structures is promoted, independent of the global flow topology represented by the position of the rear reattachment point. These structures occur after the maximal angle of attack has been crossed and then decrease in circulation strength. This decrease imposes a stronger adverse pressure gradient on the flow below the LEV (which moves towards the leading edge), because the suction peak at the leading edge decreases with smaller angles of attack. This increased pressure gradient provokes a separation of the boundary layer and subsequently the evolution of the secondary vortical structures near the leading edge. These structures then lead to LEV detachment. Therefore, a reduced frequency exists, above which a transition in flow topology and in the LEV detachment mechanism occurs, which is consistent with (1.11).
Analogously to § 5, the
 ${\it\kappa}$
value can again be estimated for each reduced frequency and compared with the transition value of
 ${\it\kappa}_{trans}$
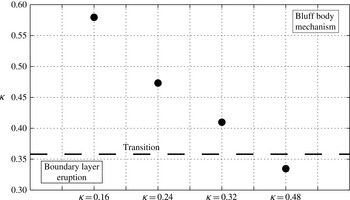
to predict which detachment mechanism leads to LEV detachment. Figure 18 shows the
 ${\it\kappa}$
value for each reduced frequency (shown as dots) compared with the transitional value
 ${\it\kappa}_{trans}$
(as a horizontal dashed line). It can be seen that the detachment mechanisms are correctly predicted.
Estimated transitional conditions for the LEV detachment mechanisms at
 ${\it\kappa}_{trans}=0.358$
, and
 ${\it\kappa}$
values for each set of parameters for different reduced frequencies, shown as dots.

To account for the changing effective angle of attack for all reduced frequencies and the resulting changing shear layer parameters, a new approach for the normalization of the LEV circulation is suggested. The peak circulation is normalized with the velocity component perpendicular to the flat plate,
 $U_{\bot }(t/T)=U_{eff}(t/T)\sin ({\it\alpha}_{eff}(t/T))$
. Because the velocity difference over the shear layer depends only on the velocity component perpendicular to the flat plate, only this portion is relevant for the LEV detachment. This portion changes during a stroke cycle due to the sinusoidal plunging motion and the pitching motion. The effective angle of attack is given by
 ${\it\alpha}_{eff}(t/T)=30^{\circ }\sin (2{\rm\pi}t/T)$
and the effective velocity is given by
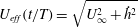 $U_{eff}(t/T)=\sqrt{U_{\infty }^{2}+{\dot{h}}^{2}}$
, where
 ${\dot{h}}$
is the plunging velocity. The peak values of the normalized circulation are
 $({\it\Gamma}^{LEV})/(cU_{\infty })=2.42$
, 2.65, 2.27 and 1.93 and occur approximately at the instants
 $t/T=0.18$
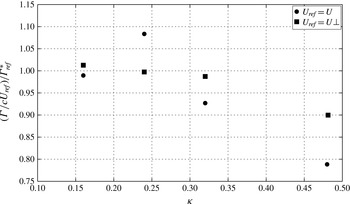
, 0.27, 0.33 and 0.34, just prior to LEV detachment or when the plateau value of circulation is reached. Figure 19 compares the conventional normalization method using the free stream velocity as a reference velocity,
 $U_{ref}=U_{\infty }$
(indicated by dots), with the normalization based on
 $U_{ref}=U_{\bot }$
. Therefore, the non-dimensional circulation
 ${\it\Gamma}/(cU_{ref})$
is normalized using
 ${\it\Gamma}_{ref}^{\ast }$
as a reference value, which is defined as
 ${\it\Gamma}_{ref}^{\ast }=(1/3)((({\it\Gamma}(k=0.16))/(cU_{ref}))+(({\it\Gamma}(k=0.24))/(cU_{ref}))+(({\it\Gamma}(k=0.32))/(cU_{ref})))$
. Here,
 ${\it\Gamma}_{ref}^{\ast }$
represents the mean value of the peak circulations for the reduced frequencies
 $k=0.16$
, 0.24 and 0.32, for which the bluff body mechanism causes LEV detachment. For the normalization using
 $U_{\infty }$
there is strong deviation of the normalized peak values
 $({\it\Gamma}/(cU_{ref}))/{\it\Gamma}_{ref}^{\ast }$
, while the normalized peak circulation values using
 $U_{\bot }$
at the instant of detachment produce more uniform values, at least for the cases whose LEV detachment is connected with the trailing edge. The normalized circulation
 $({\it\Gamma}^{LEV})/(cU_{\bot })$
of the case
 $k=0.48$
with an eruption-driven LEV detachment is lower for both normalization methods. It can be seen that the normalized circulation peak values collapse, if they are related to the parameters determining the boundary layer thickness (here,
 $U_{\bot }$
is the characteristic velocity for the stagnation point) at the instants of detachment, if the LEV detachment is based on the same mechanism. The conventional normalization using the chord length and the free stream velocity fails to incorporate the effects of the airfoil kinematics given by the reduced frequency
 $k$
.
Comparison of the circulation normalized using the free stream velocity
 $U_{\infty }$
(indicated by dots) and using the velocity component perpendicular to the flat plate at the LEV detachment instant
 $U_{\bot }$
(indicated by squares).

7. Conclusions and outlook
It is shown in the present study that a transition in the LEV detachment mechanism could be facilitated by a change in the chord length, a change in the free stream velocity or a change in the reduced frequency. The results indicate that a transition due to a change in the Reynolds number may also be possible, a postulate that will be investigated in future experiments. The influence of the chord length on the formation and detachment of LEVs has been investigated, while keeping all non-dimensional parameters constant. Two different LEV detachment mechanisms were observed for the four experimental cases: for one mechanism the chord length was the characteristic geometrical length scale limiting LEV growth, for the other mechanism no geometrical length scale was found to be associated with LEV detachment, which is in accordance with the findings of Afanasyev (Reference Afanasyev2006), Pedrizzetti (Reference Pedrizzetti2010) and Domenichini (Reference Domenichini2011). Instead, the shear layer curvature
 $a_{0}$
is found to have an impact on the LEV detachment, which corresponds to the findings of Sattari et al. (Reference Sattari, Rival, Martinuzzi and Tropea2012). The viscous/inviscid wall–vortex interaction is inherent to all vortex–airfoil configurations. The shear layer properties determining the circulation/mass ratio in an LEV were found to be characteristic for the maximal LEV circulation. An additional non-dimensional number based on the shear layer properties was introduced to facilitate complete similarity between flapping flight experiments. The shear layer parameters govern the LEV size for the eruption based detachment mechanism.
The results also suggest a dependence of the boundary layer eruption on the Reynolds number. If the Reynolds number is sufficiently low, a transition from the bluff body mechanism to an eruption-driven mechanism is expected. The impact of the airfoil motion and its resulting pressure gradient on the onset of the boundary layer eruption is of major influence. While for low reduced frequencies the flow reversal at the chord length is characteristic, for high reduced frequencies the airfoil kinematics determines LEV detachment. Between the two extreme cases an optimal reduced frequency exists, which leads to a circulation maximum in the LEV.
In summary, the eruption-caused LEV detachment is expected to occur only at high reduced frequencies in combination with large chord lengths at low Reynolds numbers. The impact of the shear layer thickness decreases with higher flow velocities, because the thickness of the shear layer varies as
 $((\partial d_{SL})/(\partial U_{\infty }))\propto U_{\infty }^{-1.5}$
and therefore exhibits less change at high flow velocities. These conditions deviate significantly from the parameters observed in efficient forward flight; therefore, the chord length may be considered as the characteristic parameter limiting LEV growth in such cases.