INTRODUCTION
Sorghum, Sorghum bicolor (L.) Moench, the fifth most important cereal crop, offers various utilities and advantages over other crops throughout the world and in the United States. Sorghum has special importance in the United States as it generates major revenue through exports, as livestock feed and raw material for the biofuel industry. This crop is particularly sought after for feedstock in the Great Plains, owing to its high performance in this climatic region. However, in this region, sorghum yield is often reduced by insect pests, specifically the greenbug [Schizaphis graminum (Rondani)]. Among more than ten different biotypes currently found on sorghum, biotype C was the first one to break out in 1968 (Harvey & Hackerott Reference Harvey and Hackerott1969) and then in 1980 biotype E was found on sorghum hybrids resistant to biotype C (Porter et al. Reference Porter, Peterson and Vise1982). In 1990, biotype I was predominantly found to be infesting resistant hybrids developed for previous biotypes in Kansas (Harvey et al. Reference Harvey, Kofoid, Martin and Sloderbeck1991). Similarly, biotype K followed biotype I (Harvey et al. Reference Harvey, Wilde and Kofoid1997). The prominent aspect of greenbug biotype emergence in the Great Plains of the USA appeared as if one biotype emerged and replaced the previous one, but studies show that biotypic diversity among greenbugs existed long before the deployment of commercial resistant hybrids and these preadapted opportunists diverged on other non-cultivated grass hosts and took advantage of deployment of one or few resistant genes (Porter et al. Reference Porter, Burd, Shufran, Webster and Teetes1997; Burd & Porter Reference Burd and Porter2006). Since its discovery in 1990, greenbug biotype I, the most distinguishable biotype, has established sorghum as a predominant host crop (Harvey et al. Reference Harvey, Kofoid, Martin and Sloderbeck1991; Kofoid et al. Reference Kofoid, Harvey, Sloderbeck and Wilkinson1991; Burd & Porter Reference Burd and Porter2006). Greenbug damage to sorghum is detrimental in almost all stages of crop growth with observable symptoms such as red necrotic spots and chlorosis. The annual loss of sorghum due to greenbug damage is estimated around $248 million to US sorghum producers (INTSORMIL 2006). Greenbug not only causes losses by damage on the sorghum leaf, but also serves as a vector that transmits several viral diseases, including maize dwarf mosaic virus and sugarcane mosaic virus. The best way to control such diseases is through the control of aphids that carry these viruses. The use of sorghum host-plant resistance is advocated as a promising integrated pest management (IPM) tool in developing resistant hybrids to biotype I as it reduces the associated cost of insecticides for sorghum producers (Michaud et al. Reference Michaud, Whitworth and Schwarting2015; Royer et al. Reference Royer, Pendleton, Elliott and Giles2015). The hunt for good sources of resistance against insects always remains a long quest and daunting task in plant breeding as sorghum has a good reservoir of resistant germplasm (Huang et al. Reference Huang, Sharma, Dillon and Paterson2013). The undesirable effects of systemic insecticides should lead to increased interest in host-plant resistance against greenbug infestation as a better alternative to chemical control measures and as an effective means of IPM practices (Smith Reference Smith and Goodman2004).
Plants recognize aphid effector proteins through the use of R gene products containing transmembrane pattern recognition receptors or nucleotide binding leucine-rich-repeat (NB-LRR) protein sequences (Morkunas et al. Reference Morkunas, Mai and Gabryś2011). To date, there are two dominant resistance genes, Mi-1 and Vat, that have been isolated in plants, both of which share structural similarities and encode NBS-LRR proteins involved in specific recognition of aphids (Dogimont et al. Reference Dogimont, Bendahmane, Chovelon and Boissot2010; Smith & Clement Reference Smith and Clement2012). Sorghum, like any other plant, has innate mechanisms to tolerate and respond to aphid feeding through defensive responses which parallel pathogen-induced responses (Huang Reference Huang, Xu, Li, Xue and Yang2007). The recent understanding and unravelling of genetic and molecular interactions involved in several crops’ defence response to aphid feeding, including sorghum, have supported the role of plant R genes (resistant genes) (Smith & Boyko Reference Smith and Boyko2007; Mace et al. Reference Mace, Tai, Innes, Godwin, Hu, Campbell, Gilding, Cruickshank, Prentis, Wang and Jordan2014; Sekhwal et al. Reference Sekhwal, Li, Lam, Wang, Cloutier and You2015). The upregulation of glycoprotein sequences with a LRR motif and Xa1 in response to greenbug attack has clearly depicted the involvement of plant R genes in sorghum (Zhu-Salzman et al. Reference Zhu-Salzman, Salzman, Ahn and Koiwa2004; Park et al. Reference Park, Huang and Ayoubi2006). Real-time polymerase chain reaction (PCR) experiments have also supported the differential expression of candidate genes between resistant and susceptible cultivars (Punnuri Reference Punnuri2011). These transcriptomic studies have also shown that defence response of sorghum to greenbug attack is augmented through expression of numerous other genes and messenger molecules.
Increasingly popular as genomic resources, DNA markers have spurred on efforts towards the development of sorghum linkage maps. The linkage maps represent genome architecture by using DNA markers in a linear order and have diverse utility because they form the basic framework for studying simple and complex genetic traits (Tanksley Reference Tanksley1993; Cone & Coe Reference Cone, Coe, Bennetzen and Hake2009). Genetic maps also serve as a valuable source for comparative analysis among different crops (Mullet et al. Reference Mullet, Klein and Klein2002; Mace et al. Reference Mace, Rami, Bouchet, Klein, Klein, Kilian, Wenzl, Xia, Halloran and Jordan2009). Furthermore, linkage maps allow researchers to identify and tag significant genomic regions affecting traits such as insect resistance and disease resistance (Mohan et al. Reference Mohan, Nair, Bhagwat, Krishna, Yano, Bhatia and Sasaki1997; Yencho et al. Reference Yencho, Cohen and Byrne2000; Reddy et al. Reference Reddy, Fakrudin, Rajkumar, Punnuri, Arun, Kuruvinashetti, Das and Seetharama2008). Several linkage maps developed in sorghum have facilitated tagging of greenbug resistance (Agrama et al. Reference Agrama, Wilde, Reese, Campbell and Tuinstra2002; Katsar et al. Reference Katsar, Paterson, Teetes and Peterson2002; Nagaraj et al. Reference Nagaraj, Reese, Tuinstra, Smith, Amand, Kirkham, Kofoid, Campbell and Wilde2005; Wu et al. Reference Wu, Huang, Porter, Tauer and Hollaway2007; Wu & Huang Reference Wu and Huang2008; Punnuri et al. Reference Punnuri, Huang, Steets and Wu2013). The alleles accounting for sorghum biotype I resistance have been documented through quantitative trait loci (QTL) studies, which support the involvement of multiple regions of the sorghum genome in greenbug resistance (Agrama et al. Reference Agrama, Wilde, Reese, Campbell and Tuinstra2002; Katsar et al. Reference Katsar, Paterson, Teetes and Peterson2002; Nagaraj et al. Reference Nagaraj, Reese, Tuinstra, Smith, Amand, Kirkham, Kofoid, Campbell and Wilde2005; Wu & Huang Reference Wu and Huang2008; Punnuri et al. Reference Punnuri, Huang, Steets and Wu2013).
The reliability of QTL mapping experiments depends on the type and size of the mapping population used, marker system employed, map saturation, map resolution and the insect/disease resistance scoring method involved in the bioassay. The type of mapping population which is primarily developed based on the objective of the study plays a crucial role in developing linkage maps for QTL studies, because the mapping population reflects the diversity of genetic information it can provide to the researcher (Young Reference Young, Philips and Vasil2000). Although F2 mapping populations are quick, easy to develop, transient and best suited for initial mapping, they are seldom used for fine mapping due to the fact that they contain fewer numbers of meiotic events. For this reason, F2-derived populations, such as immortalized populations, advanced inter-cross lines and inter-mated populations, have an advantage over F2 mapping populations with respect to mapping resolution and accuracy. For example, the heterozygosity of parent (F2) alleles is fixed and maintained in the pooled seeds of immortalized individuals (Gardiner et al. Reference Gardiner, Coe, Melia-Hancock, Hoisington and Chao1993; Hua et al. Reference Hua, Xing, Wu, Xu, Sun, Yu and Zhang2003). Advanced inter-cross lines and randomly crossed inter-mated populations, which accumulate recombination events in short chromosome segments, increase the accuracy of fine mapping (Darvasi & Soller Reference Darvasi and Soller1995; Liu et al. Reference Liu, Kowalski, Lan, Feldmann and Paterson1996; Lee et al. Reference Lee, Sharopova, Beavis, Grant, Katt, Blair and Hallauer2002). These recombinations between two loci, accumulated over generations by inter-mating within a population derived from F2 increase the ability to precisely identify a QTL map location and its effects (Liu et al. Reference Liu, Kowalski, Lan, Feldmann and Paterson1996; Darvasi Reference Darvasi1998).
Earlier efforts on QTL mapping for greenbug resistance in an F2 mapping population showed promising results with the identification of resistance loci closer to Xa21-binding protein3 on sorghum chromosome SBI09 (Punnuri et al. Reference Punnuri, Huang, Steets and Wu2013). Therefore, the objective of the current study was to confirm the QTL positions identified from earlier studies and also to identify, if any, new QTLs in an inter-cross population which has undergone recombination and locate potential insect-resistant candidate genes residing in the QTL region. The use of an advanced mapping population would confirm and increase the accuracy of QTL map location with reduced confidence interval for the loci and their genetic effects. Utilizing this information, the aim was to confirm and identify, if any, new loci for greenbug resistance could be identified using an advanced mapping population derived from an F2 population used in the previous project.
MATERIALS AND METHODS
Development of an inter-cross population
The mapping population used in the current study was an inter-cross population, developed from an F2 population of the cross between BTx623 and PI 607900. The procedure for developing an inter-mated population was initiated in F3 lines. A total of 400 F3 plants were chosen, which were divided into two halves with 200 plants in each group. One half was used as the female group and plants were emasculated based on pollen availability from the other group. One to one crossings were done with 200 paired plants. Upon successful crossing, 158 crossed seeds were obtained which were further selfed to produce the F1 generation of the inter-cross population, of which 143 plants were used for genotyping. The F2 generation was used in the greenhouse trials for phenotyping of greenbug resistance. There was one round of random inter-mating and one round of selfing after crossing prior to the use of material for linkage and QTL analysis.
Genotyping
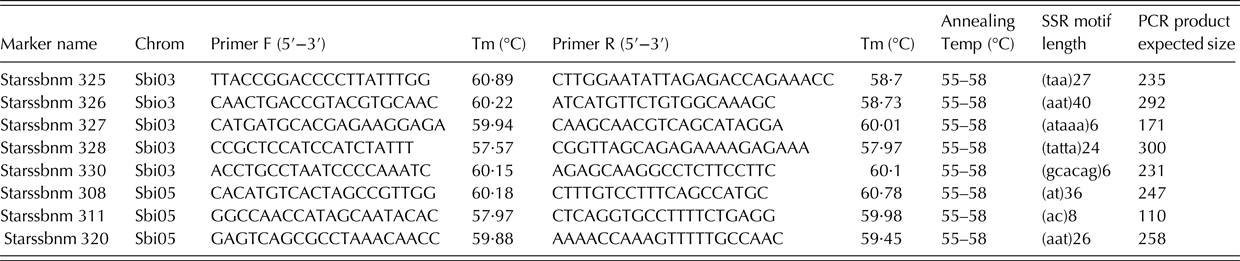
The genotyping procedure involved initial DNA extraction of 143 inter-crossed plants using a modified cetyl trimethylammonium bromide procedure (Murray & Thompson Reference Murray and Thompson1980). More primers were developed and screened, in addition to the primers that were used in the F2 mapping population (Punnuri et al. Reference Punnuri, Huang, Steets and Wu2013), to adequately cover the genome. New microsatellite markers were specifically developed to cover those regions of chromosomes that were not covered in the earlier experiment (Table 1). The criteria to develop new microsatellite markers were the same as followed in Punnuri et al. (Reference Punnuri, Huang, Steets and Wu2013). The parental polymorphic simple sequence repeat (SSR) markers were genotyped across 143 individuals and scored as A and B (allele from two parental lines) and H (heterozygote with alleles from both parents). Missing marker information was scored as ’_’. The PCR amplification protocol using fluorescence dye labelled (IR 700 and IR 800) primers was similar to that followed in Wu & Huang (Reference Wu and Huang2008). The products obtained from two dyes were mixed and loaded onto LI-COR 4300 DNA analyser (LI-COR Inc, Lincoln, NE, USA). Allele sizing was done by comparing to parental alleles which were used as controls in each gel. The genotyping data have been included in Supplementary Table S1 (available online from https://multimediafluids.uam.elogim.com/core/journals/journal-of-agricultural-science).
List of newly synthesized microsatellites on sorghum chromosomes 3 and 5 used in the current study

SSR, simple sequence repeat; PCR, polymerase chain reaction.
Construction of linkage map
Linkage analysis was performed utilizing the genotypic data obtained from all the available polymorphic markers in this population, using MAPMAKER/EXP 3.0 (Lander et al. Reference Lander, Green, Abrahamson, Barlow, Daly, Lincoln and Newburg1987). The markers were linked and ordered on linkage groups using minimum logarithm of odds (LOD) of 3.0 and a maximum linkage distance of 40 cM, except in a few cases where the distance exceeded 40 cM, but was <45 cM. Newly added markers were assigned to the chromosomes based on co-segregation banding patterns. In general, the association of most of these markers was already known from previous linkage analysis, which necessitated to perform other commands such as ‘Compare’ and ‘Ripple’ to determine the best order and final framework on the chromosome for all the markers including newly added markers. The Kosambi mapping function was executed to calculate the relative mapping distances in cM (Kosambi Reference Kosambi1943). The sorghum chromosomes were named in accordance with the internationally accepted names given by Kim et al. (Reference Kim, Klein, Klein, Price, Mullet and Stelly2005).
Quantitative trait loci analysis
The identification of quantitative trait loci was carried out using QTL Cartographer version 2·5 (Wang et al. Reference Wang, Basten and Zeng2010) by using suitable .map and .raw files from mapmaker. The best possible way to avoid association of false QTLs is to determine the significance level of the LOD threshold value for each trait through a 1000 permutation test given by Churchill & Doerge (Reference Churchill and Doerge1994). In order to identify the critical LOD values associated with four different greenbug-resistant traits, 1000 permutation tests were performed. Identification of significant markers, marker intervals with flanking markers from single-marker analysis, interval mapping, and composite interval mapping were included in the initial model for Multiple Interval Mapping (MIM) method of QTL analysis. The MIM analysis for each trait was initiated with the P-values set to 0·05 and LOD score obtained from the 1000 permutation tests. The MIM module in QTL cartographer includes step-wise and iterative mode of search for new QTLs along with optimizing position and effects of QTLs (Kao et al. Reference Kao, Zeng and Teasdale1999; Zeng et al. Reference Zeng, Kao and Basten1999). The initial model was tested in repeated mode to identify significant QTLs based on the Bayes Information Criterion values. Initially identified QTL positions and effects were stabilized and included in the final model.
Phenotyping and statistical analysis
The phenotypic evaluations were similar to the F2 analysis in Punnuri et al. (Reference Punnuri, Huang, Steets and Wu2013). Greenbug damage scores were recorded at 7, 10, 14 and 21 days post-infestation. The 0–6 scale of Starks & Burton (Reference Starks and Burton1977) was used, where 0 indicated no damage and 6 indicated a completely dead plant, with intermediate scores of 1–5 indicating a 20% increase in damage for each respective increase in the scale. Phenotypic data were analysed using SAS 9·2 (SAS Institute 2008). Parental scorings for greenbug resistance were subjected to analysis of variance (ANOVA) using the PROC GLM procedure. Scores from progeny lines were used in PROC MIXED and PROC CORR to estimate significant response and extent of correlation among the four different traits. Variance components and heritability values were determined using SAS code provided by Holland et al. (Reference Holland, Nyquist and Cervantes-Martinex2003).
RESULTS
Phenotypic analyses
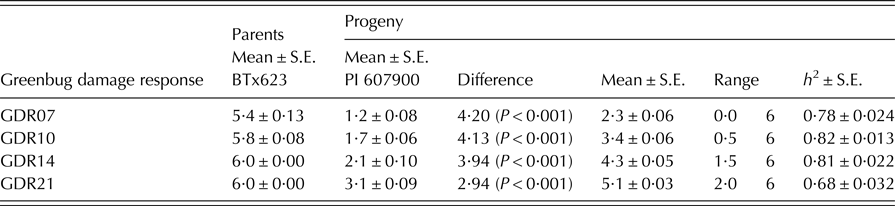
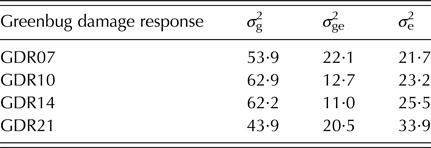
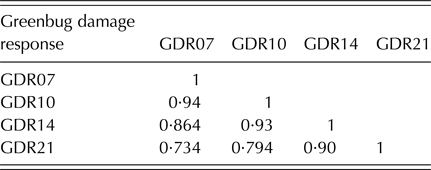
The results from ANOVA using the PROC GLM analysis showed that the responses of the two parents followed expectations with the resistant parent PI 607900 having very high resistance response to greenbug damage compared with BTx623 (Table 2). PI 607900 performed better when exposed to greenbugs, with mean damage scores ranging from 1·2 ± 0·08 to 3·1 ± 0·09, while BTx623 was highly susceptible to greenbug damage, with mean damage scores from 5·4 ± 0·13 to 6·0 ± 0·00 across sampling times (Table 2). While the results from PROC MIXED analysis on progenies of the inter-cross population also showed significant difference in greenbug damage with mean values from 2·3 ± 0·06 to 5·1 ± 0·03 (P < 0·001) (Table 2). Resistance to greenbugs was a highly heritable trait among progenies: heritability values based on family mean basis ranged from 68 to 82% (Table 2). The associated variance components and phenotypic correlations for four traits are reported in Tables 3 and 4, respectively. Trait 1 (7 days) and trait 2 (10 days) were highly correlated, followed by trait 2 (10 days) and trait 3 (14 days).
Resistance response to greenbug damage among two parents and progenies from inter-cross population was measured at four different time points, 7 days (GDR07), 10 days (GDR10), 14 days (GDR14) and 21 days (GDR21) post-infestation using a 1–6 scale to estimate damage
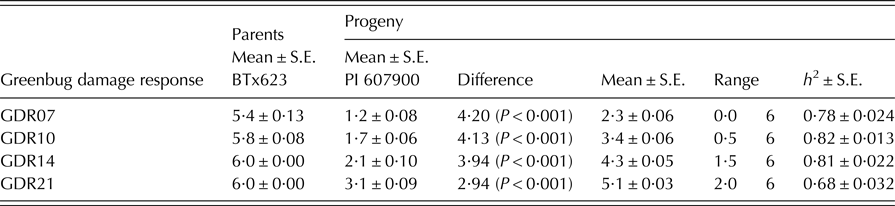
h 2 – heritability on family mean basis derived from means of progenies of the inter-cross population.
The variance components of greenbug resistance measured for sorghum inter-cross progenies at four different time points, 7 days (GDR07), 10 days (GDR10), 14 days (GDR14) and 21 days (GDR21) post-infestation (variance components expressed in percentage)

σ 2 g Variance associated with genotypes.
σ 2 ge Variance associated with genotype × environment.
σ 2 e Residual variance.
Phenotypic correlation coefficients observed for greenbug resistance measured at four different time points, P < 0·001

Linkage mapping in the inter-cross population
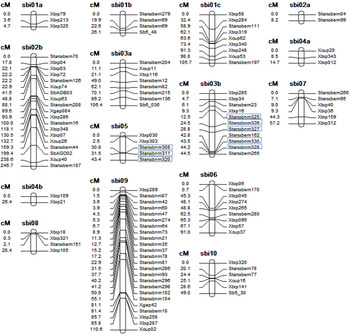
Eight new polymorphic microsatellite markers were developed (Table 1) and six more polymorphic microsatellite markers were added from the publicly available resources. The total number of polymorphic markers in the present study was 121 polymorphic SSR markers, which included an addition of 14 markers to the F2 analysis. However, only 115 markers out of 121 polymorphic markers could be mapped (Fig. 1). The six markers that were unlinked are as follows: Xcup24 on sbi01, Xtxp80 on sbi02, Xcup 23 on sbi04a, Xtxp299 on sbi05, Xtxp224 on sbi07 and Starssbem 94 on sbi09. Overall, the order of markers on the map remained the same and was compared to established consensus maps (Mace et al. Reference Mace, Rami, Bouchet, Klein, Klein, Kilian, Wenzl, Xia, Halloran and Jordan2009). It is expected that because of random inter-crossing in the mapping population, segregation distortion increases among alleles; segregation distortion was found for 63 markers, most of which deviated towards PI 607900. The total length of the linkage map covered 963·0 cM of the total genome, encompassing ten sorghum chromosomes split into 15 linkage groups. However, there were enough markers on chromosome 5 to make a linkage group. The present map (963·0 cM) was expanded by 32% compared with the map from the F2 population (729·5 cM). The present map covered all ten chromosomes with addition of markers on chromosomes 3, 4, 5 and 6. Some of the markers came very close, while others expanded drastically on the linkage map. All the chromosomes had increased map length except SBI07, which had reduced length. The rest of the chromosomes showed an increase in genetic length in comparison to the previous study of Punnuri et al. (Reference Punnuri, Huang, Steets and Wu2013). It is obvious that recombination between closely linked loci increased the genetic distance in this case. Moreover, the map was expanded in the identified QTL region. It was particularly interesting to see the region between Starssbnm 78 and Starssbnm 102 on chromosome 9, where the QTLs for greenbug resistance were previously observed in the F2 mapping study. In the current study, this region was covered by 32·8 cM distance, an increase of two-fold over 15·7 cM observed in the F2 study. This would reduce the confidence interval associated with the QTL region.
Linkage map constructed in an inter-cross population of sorghum developed using F3 progenies of BTx623 X PI 607900 and eight newly synthesized markers in the current study are shown in boxes.

Quantitative trait loci analysis
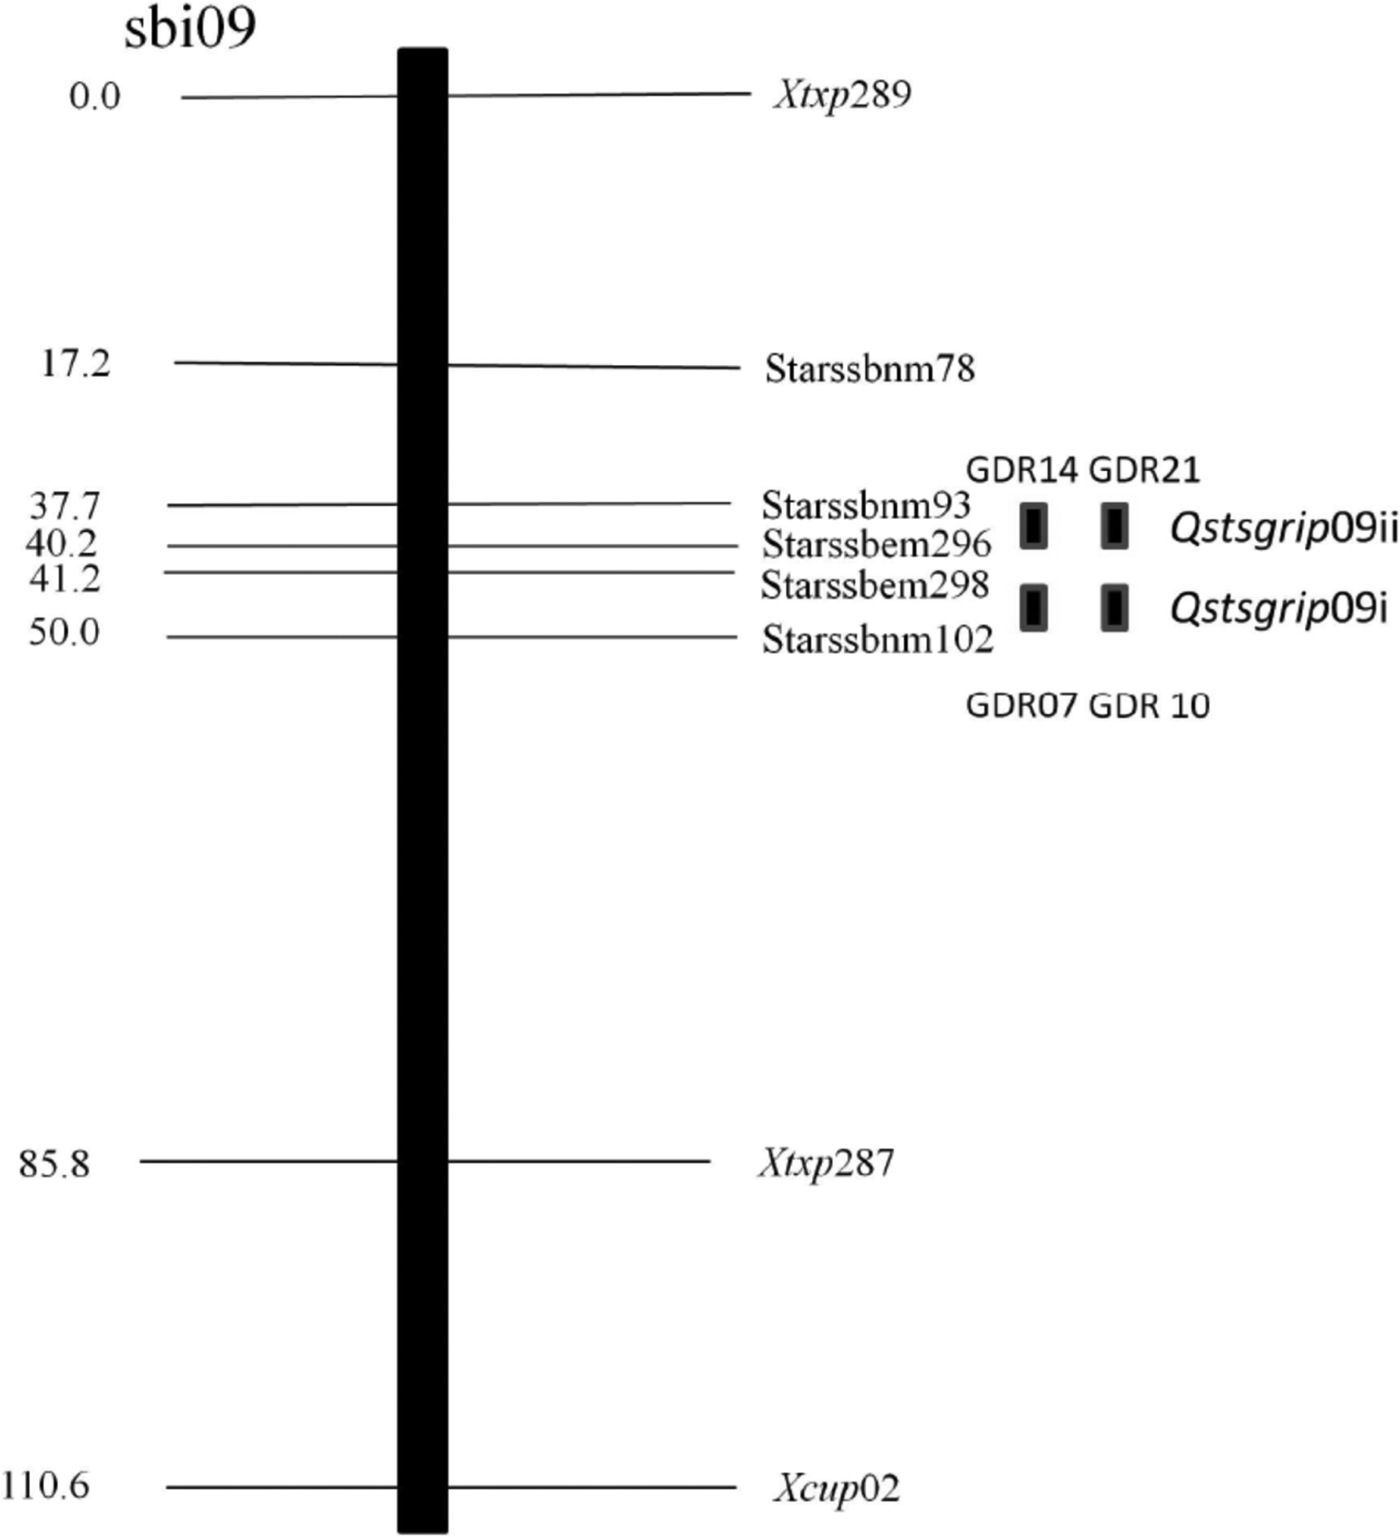
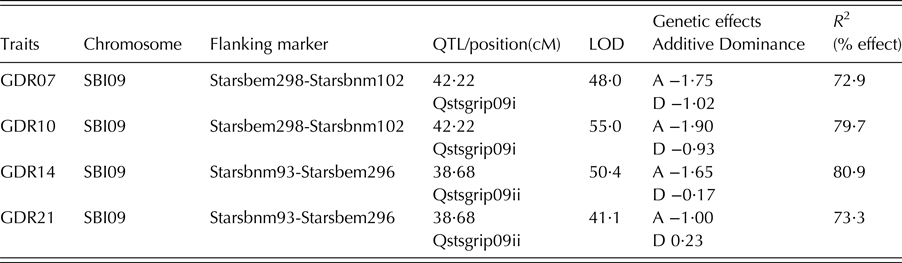
The results from single-marker analysis explained all markers present on chromosome 9 as significant markers for four traits. The MIM results revealed two regions between Starssbnm 93 and Starssbem 296 and between Starssbem 298 and Starssbnm 102 as QTL harbouring regions (Table 5). The two regions identified on chromosome 9 were supported by similar results in the F2 QTL analysis (Fig. 2). Despite the addition of markers on chromosomes 3, 4, 5 and 6, greenbug resistance loci were found in the same regions as earlier but with better resolution and higher confidence interval. The region between Starssbem 298 and Starssbnm 102 accounted for 72·9–79·7% of variation for greenbug resistance observed at days 7 and 10 with associated LOD values ranging from 47·98 to 54·99. The highest phenotypic variation of 73·3–80·9% for greenbug resistance was identified from the region of Starssbnm 93 and Starssbem 296 with associated LOD values of 41·05–50·36. The markers were also specifically designed on chromosome 3 to identify the minor QTLs observed in the F2 studies. These minor QTLs remained undetected in the current investigations. These two regions were designated Qstsgrip09i (Starssbem 298-Starssbnm 102) and Qstsgrip09ii (Starssbnm 93-Starssbem 296), which showed an increased allelic effect for greenbug resistance originating from PI 607900 in the range of 1·00–1·95 units. The QTL identified for trait 3 (day 14) and trait 4 (day 21), Qstsgrip09ii, flanked by Starssbnm 93 and Starssbem 296 was 1 cM away from Starssbnm 93 and was also found consistently in the F2 analysis. The QTL, Qstsgrip09i, was flanked by Starssbem 298 and Starssbnm 102 for trait 1 (day 07) and trait 2 (day 10) and was also located at 1 cM away from Starssbem 298. The QTL location was always either upstream or downstream of the markers, Starssbem 296 and Starssbem 298, which were developed for a gene sequence similar to receptor-like Xa21-binding protein 3.
Quantitative trait loci identified on sorghum chromosome 9 for four greenbug resistance traits measured at day 07 (GDR07), day 10 (GDR10), day 14 (GDR14) and day 21 (GDR21) in an inter-cross mapping population.

Quantitative trait loci (QTLs) for greenbug resistance identified in the inter-cross population along with their genetic effects and phenotypic variation (R2)

DISCUSSION
Greenbugs have the ability to express biotypes virulent on previously resistant plants. In less than three decades since the discovery of biotype C in 1968, sorghum growers have been affected by four major biotypes, C, E, I and K, and these have shifted from C to E and E to I in the southern Great Plains. These biotypes differed in their virulence to overcome host-plant resistance, deployed by few effective resistance genes (Puterka & Peters Reference Puterka and Peters1989). Although not much has been deciphered about virulence of biotype I on sorghum, the genetics and virulence of three other biotypes have shown that genetic recombination during sexual reproduction leads to different biotypic variations and a gene-for-gene relationship has been shown in such aphid virulence-host resistance viz., greenbug–sorghum interactions (Puterka & Peters Reference Puterka and Peters1995). Greenbug virulence is positively associated with increased fitness on most sorghum genotypes depending on the host quality and suggests that virulent biotypes may have a fitness advantage over avirulent ones: these biotypes performed best on more susceptible and worst on more resistant sorghum genotypes (Gorena Reference Gorena2004). There was a great degree of physiological and genetic variation found among the Krasnodar European greenbug population using five sorghum differentials harbouring resistance genes Sgr1–Sgr6, where 11 aphid phenotypes were identified (Radchenko & Lychagina Reference Radchenko and Lychagina2003). Moreover, the gene-for-gene model was argued to prove that there was tremendous diversity of greenbug biotypes which occurred on other non-cultivated hosts much before the resistant cultivars were developed (Porter et al. Reference Porter, Burd, Shufran, Webster and Teetes1997; Burd & Porter Reference Burd and Porter2006). Therefore, these studies highlight that there is a greater variation among greenbug biotypes, and on the plant side, there are many resistant sources which are yet to be exploited from the sorghum repository.
The cross-tolerance mechanism to abiotic stress influences the plant's responses to phloem-feeding aphids through a cascade of events (Foyer et al. Reference Foyer, Rasool, Davey and Hancock2016). Over time, strategic deployment of greenbug-resistant sorghum cultivars has helped to overcome the newly emerged biotypes. The breeding efforts have yielded new sources of resistance to biotype I (Andrews et al. Reference Andrews, Bramel-Cox and Wilde1993; Kofoid et al. Reference Kofoid, Perumal, Reese and Campbell2012). Breeding for insect-resistant crops will further enhance mechanistic understanding of plant–insect interactions (Harris et al. Reference Harris, Friesen, Xu, Chen, Giron and Stuart2015). Use of resistant cultivars as a core component of IPM has shown promising, environmentally safe and amiable results (Sharma & Ortiz Reference Sharma and Ortiz2002; Rooney Reference Rooney2004; Kofoid et al. Reference Kofoid, Perumal, Reese and Campbell2012; Royer et al. Reference Royer, Pendleton, Elliott and Giles2015). However, a vast number of potentially resistant lines need to be screened to be adopted into greenbug management programmes, which can be efficiently managed through marker-assisted selection (Huang Reference Huang2011).
Several molecular mapping studies have been performed in the last 15 years to identify QTLs for greenbug resistance in sorghum. Agrama et al. (Reference Agrama, Wilde, Reese, Campbell and Tuinstra2002) identified nine QTLs located on six sorghum linkage groups SBI02, SBI03, SBI04, SBI05, SBI09 and SBI10. Of the nine loci found to be linked to both biotype-specific and biotype non-specific resistance or tolerance, four markers were linked with biotype-specific traits; and of these four linked with biotype-specific traits, three markers from chromosomes SBI02(B), SBI05(J) and SBI09(F) were associated with biotype I resistance or tolerance. These results suggest that some host-plant resistance and tolerance genes are not biotype-specific and may have functions across developmental stages. Katsar et al. (Reference Katsar, Paterson, Teetes and Peterson2002) identified one to five resistance loci segregating in the individual populations (F3 families) of four different crosses to four different biotypes. Out of the nine sorghum loci detected for all four biotypes (C, E, I and K), three loci conferred resistance for biotype I. These loci were located on SBI05(LGH), SBI06(LG D), SBI07(LGJ) for biotype I and one loci on SBI09(LG G) accounted for resistance to biotypes C and E. Nagaraj et al. (Reference Nagaraj, Reese, Tuinstra, Smith, Amand, Kirkham, Kofoid, Campbell and Wilde2005) identified three QTLs for biotype I resistance and five QTLs for biotype K resistance. For the biotype I, there were two QTLs present on chromosomes SBI01(LG5) and one on SBI04 (LG 3). Wu et al. (Reference Wu, Huang, Porter, Tauer and Hollaway2007) identified a major QTL on chromosome SBI09 linked with biotype E resistance originating from the PI550610 source which also revealed the same region as that of Katsar et al. (Reference Katsar, Paterson, Teetes and Peterson2002). Using their same previous linkage map they also identified two major QTLs on chromosome 9 for biotype I resistance in the same resistance source (Wu & Huang Reference Wu and Huang2008). The previously published QTL map of Punnuri et al. (Reference Punnuri, Huang, Steets and Wu2013) also showed up major QTLs on chromosome 9 in a slightly different region than previous studies. These resistance QTLs had additive and partially dominant effects. Therefore, these studies show that resistance loci to biotypes C, E and I were located on chromosome SBI09.
The resistant plant used in the current mapping experiments is PI 607900. The classical experiments on PI 607900 showed this accession to be a promising resistant line with a possible role of two dominant genes acting through complimentary gene action (Wilde & Tuinstra Reference Wilde and Tuinstra2000; Tuinstra et al. Reference Tuinstra, Wilde and Kriegshauser2001). A worldwide collection of 40 000 sorghum germplasm accessions was evaluated for greenbug resistance, which resulted in identifying 21 resistant sources. Among these 21 lines, PI 607900 outperformed other lines with a damage rating of 1·1 (Huang Reference Huang2011). Another study using AFLP diversity analysis showed that PI 607900 was genetically distant from other sources of resistance (Wu et al. Reference Wu, Huang, Tauer and Porter2006). Those preliminary works suggested the use of PI 607900 as a resistant source in the current work to identify the potential alleles conferring resistance to greenbug biotype I because of its superior genetic and phenotypic performance compared with other sources.
Genetic mapping aims to focus on markers in close proximity to genetic loci affecting quantitative traits such as insect resistance. Mapping results using a F2 population proved promising (Punnuri et al. Reference Punnuri, Huang, Steets and Wu2013), since it harboured several candidate genes including a sequence similar to receptor-like Xa21-binding protein 3 (Song et al. Reference Song, Want, Chen, Kim, Pi, Holsten, Gardner, Wang, Zhai, Zhu, Fauquet and Ronald1995). However, F2 populations carry few meiosis and hamper precise location of QTLs associated with a trait due to long distances between the two. A better way to address this is to expand a genetic map by creating more recombinations in the population. The aim of the current study was to identify genetic factors that influence greenbug resistance in an advanced mapping population that had more genome coverage and influenced by meiotic events. In the present advanced mapping population, terms such as immortalized F2 population (Gardiner et al. Reference Gardiner, Coe, Melia-Hancock, Hoisington and Chao1993; Hua et al. Reference Hua, Xing, Wu, Xu, Sun, Yu and Zhang2003) or advanced inter-crossed lines (Darvasi & Soller Reference Darvasi and Soller1995) were avoided, as the procedure used in the current study for developing the mapping population differed slightly. A comparative QTL mapping approach was employed to identify and locate QTLs for greenbug resistance between a F2 population and a F3 inter-cross population using genomic resources from Phytozome, a sorghum database. The present investigation involved an inter-cross mapping population derived from an earlier used F2 mapping population. As the investigation from the F2 study identified very closely linked markers to major loci for greenbug resistance on chromosome nine, which had a high density of markers, it was interesting to see if the same region confirms greenbug-resistant alleles. Hence interest was basically focused on the detection of QTLs and their effects in an advanced mapping population rather than comparing the maps between two populations.
The concept of increasing recombination events by creating multiple meiosis in populations after F2 by inter-crossing for many generations was realized and utilized for QTL mapping in the last two decades (Darvasi & Soller Reference Darvasi and Soller1995; Liu et al. Reference Liu, Kowalski, Lan, Feldmann and Paterson1996; Hua et al. Reference Hua, Xing, Wu, Xu, Sun, Yu and Zhang2003; Winkler et al. Reference Winkler, Jensen, Cooper, Podlich and Smith2003). The idea of increasing recombination events was implemented in developing an inter-cross population using random matings in F3 lines. The present map had covered all the chromosomes with the addition of 14 microsatellites to the previous study (Punnuri et al. Reference Punnuri, Huang, Steets and Wu2013). The increase in genetic length was not much of enhancement over the previous study (Punnuri et al. Reference Punnuri, Huang, Steets and Wu2013), but a marginal enhancement on chromosome 9 within the QTL region was seen. This may be due to the limited number of individuals taken for inter-crosses and one generation of random mating. Moreover, this confirms that the population size sampled for estimated gene effects has more impact than the number of markers and spacing between markers for increasing the resolving power of marker-QTL in a saturated map (Darvasi et al. Reference Darvasi, Weinreb, Minke, Weller and Soller1993; Darvasi & Soller Reference Darvasi and Soller1994). Furthermore, crossing was taken in F3 lines which have reduced heterozygosity compared to the previous generation. The study by Falke et al. (Reference Falke, Melchinger, Flachenecker, Kusterer and Frisch2006) showed that inter-mated populations do not always exhibit an expansion in map length. The current results include both expansion and shrinkage of distances between markers. Minor QTLs were not identified in the current study, but were otherwise detected in the earlier analysis (Punnuri et al. Reference Punnuri, Huang, Steets and Wu2013). It was found that major QTLs for greenbug resistance were consistent with respect to their map location on chromosome 9, which were attributable for a high phenotypic variation. This region, flanked by Starssbnm 93 and Starssbem 296, probably harbours a candidate gene for greenbug resistance. These markers were specifically developed from Xa21-binding protein 3 gene sequence. Previous expression studies to greenbug attack showed several transcripts among which LRR-containing glycoprotein sequence and Xa1 genes were upregulated (Zhu-Salzman et al. Reference Zhu-Salzman, Salzman, Ahn and Koiwa2004; Park et al. Reference Park, Huang and Ayoubi2006). Identification of two loci on chromosome 9 for four different traits was also reflected by their phenotypic correlations and it is likely that the same gene is regulated throughout the infestation. Only those significant QTLs that explained a high phenotypic variation were included in the final model and it was found that the QTL region was mapped to the same location as the previous study (Punnuri et al. Reference Punnuri, Huang, Steets and Wu2013) with less confidence interval for all traits measured. Moreover, in this investigation, QTLs for all four traits for insect/greenbug resistance were found in the same cluster, which is corroborated by other studies on insect resistance loci, shedding light on the concept of tight linkage and pleiotropy between correlated traits (Cai & Morishima Reference Cai and Morishima2002; Wu et al. Reference Wu, Huang, Porter, Tauer and Hollaway2007; Wu & Huang Reference Wu and Huang2008; Satish et al. Reference Satish, Srinivas, Madhusudhana, Padmaja, Reddy, Mohan and Seetharama2009). The expression analysis would reveal differential regulation of these candidate genes in response to greenbug attack on sorghum plants. Further investigations are underway to study the expression pattern of candidate genes in this region. However, further genetic analyses are required to confirm the precise role of these genes for greenbug resistance response in sorghum. The availability of the complete sorghum genome sequence along with transcriptomic sequences coupled with previous QTL studies has made it easy to harness likely candidate genes in the QTL regions (Paterson et al. Reference Paterson, Bowers, Bruggmann, Dubchak, Grimwood, Gundlach, Haberer, Hellsten, Mitros, Poliakov, Schmutz, Spannagl, Tang, Wang, Wicker, Bharti, Chapman, Feltus, Gowik, Grigoriev, Lyons, Maher, Martis, Narechania, Otillar, Penning, Salamov, Wang, Zhang, Carpita, Freeling, Gingle, Hash, Keller, Klein, Kresovich, McCann, Ming, Peterson, Mehboob-ur-Rahman, Ware, Westhoff, Mayer, Messing and Rokhsar2009; Punnuri et al. Reference Punnuri, Huang, Steets and Wu2013).
CONCLUSION
The current study identified a consistent region of the sorghum genome in two mapping studies. This region was located on chromosome 9 flanked by markers Starssbnm93 and Starssbnm102. This region contained several candidate genes including receptor-like Xa21-binding protein 3 (XB3), which is known to increase R gene-mediated disease resistance (Wang et al. Reference Wang, Pi, Chen, Chakrabarty, Jiang, De Leon, Liu, Li, Benny, Oard, Ronald and Song2006). The markers/QTLs identified in the study will have applications in fine mapping, MAS and map-based cloning experiments for the improvement of greenbug resistance in sorghum.
SUPPLEMENTARY MATERIAL
The supplementary material for this article can be found at https://doi.org/10.1017/S0021859617000685.
The authors thank Angela Phillips for her excellent technical support in this study. This work was partly supported by the Oklahoma Sorghum Commission, and additional funding from USDA-ARS, CRIS project, Grant Number: 3072-21000-007-00D (YH). The US Department of Agriculture, Agricultural Research Service, is an equal opportunity/affirmative action employer and all agency services are available without discrimination. Mention of a trademark or proprietary product does not constitute a guarantee or warranty of a product by the US Department of Agriculture and does not imply its approval to the exclusion of other products that may also be suitable.