Introduction
Nitrogen is a vital constituent of all living matter, without which life as we know it would not exist. It is highly abundant on the surface of the earth in the form of the di-nitrogen molecule (N2). Although unusable by living beings, it is available to certain micro-organisms such as Rhizobium, involved in symbiotic nitrogen fixation by legumes. All forms of chemically and biologically active nitrogen are what we call reactive nitrogen. It can undergo a wide variety of transformations in air, water and soil, as well as in living beings, all the way to restoration of the di-nitrogen molecule by denitrification.
Contribution of livestock farming systems to the nitrogen cascade
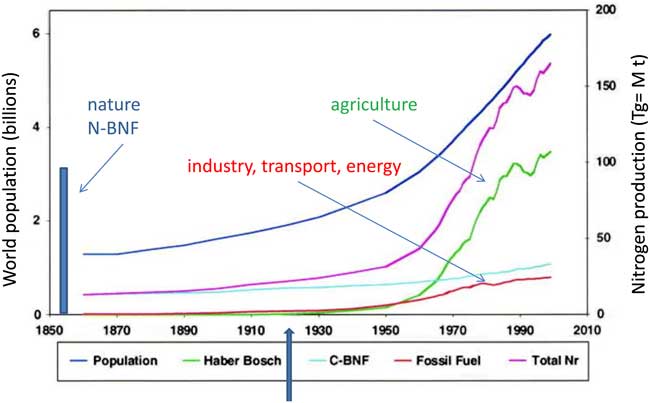
Until the early 20th century, symbiotic nitrogen fixation was the primary source of nitrogen for crops. The secondary source was based on recycling organic nitrogen into crop production: animal excretions provided organic soil improvement required to maintain fertility. Livestock farming systems have long been used – and still are in many countries – to convert symbiotically fixed nitrogen from pastures into nitrogen easily available to crops. The development of the Haber-Bosch process in the early 20th century led to the industrial synthesis of ammonia from nitrogen (N2) and natural gas (CH4) and made it possible to fertilise soils without mixed farming systems (Erisman et al., Reference Erisman, Sutton, Galloway, Klimont and Winiwarter2008). The widespread use of chemical fertilisers starting in the 1950s (see Figure 1) largely explains the very rapid growth of global agricultural production. This in fact led some scientists to state that chemical nitrogen fertilisation became one of the factors leading to the world’s population growth. During the 2000s, industrial nitrogen fixation (about 100 million tonnes (Mt) of reactive nitrogen produced/year in the world) was more than three times the total fixation by cultivated legumes. In 2009, more than 2 Mt of nitrogen as industrial fertilisers were used in France (Galloway et al., Reference Galloway, Aber, Erisman, Seitzinger, Howarth, Cowling and Cosby2004).
Changes in the production of reactive nitrogen and the world’s population since the mid-19th century. The N-BNF curve represents symbiotic nitrogen fixation by natural ecosystems, and C-BNF is that by agricultural systems (after Galloway et al., Reference Galloway, Aber, Erisman, Seitzinger, Howarth, Cowling and Cosby2003).

Transformations of nitrogen in the biosphere, the notion of the nitrogen cascade
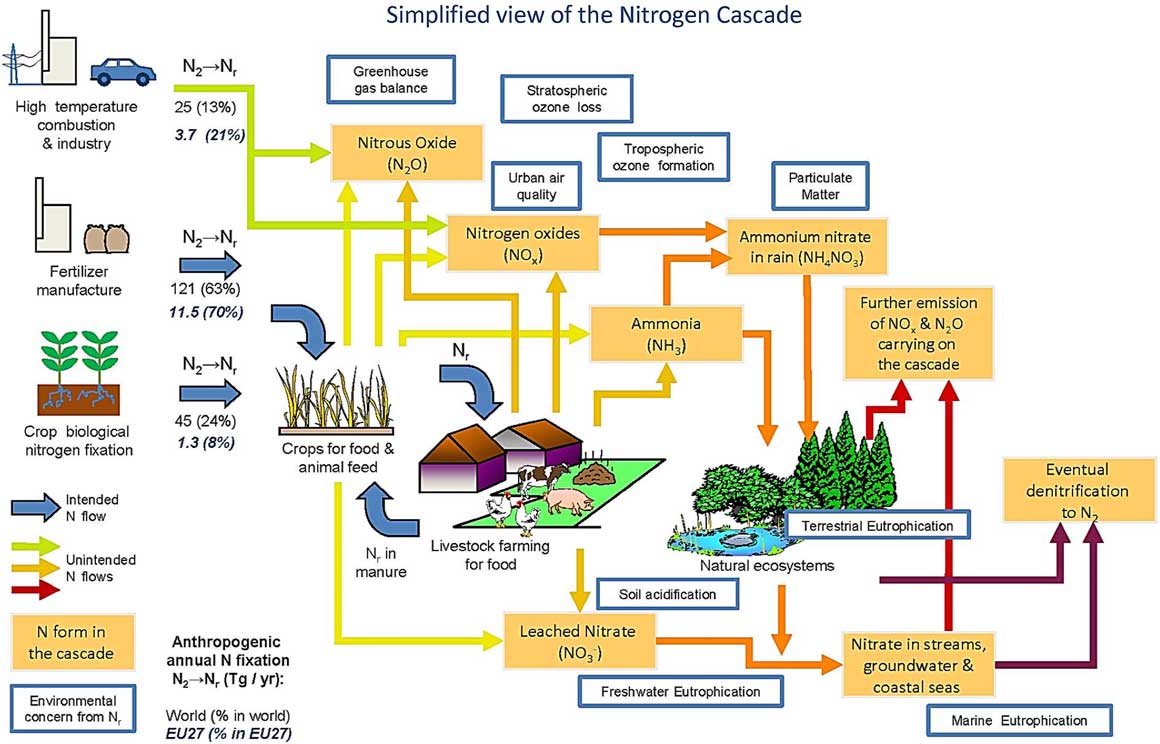
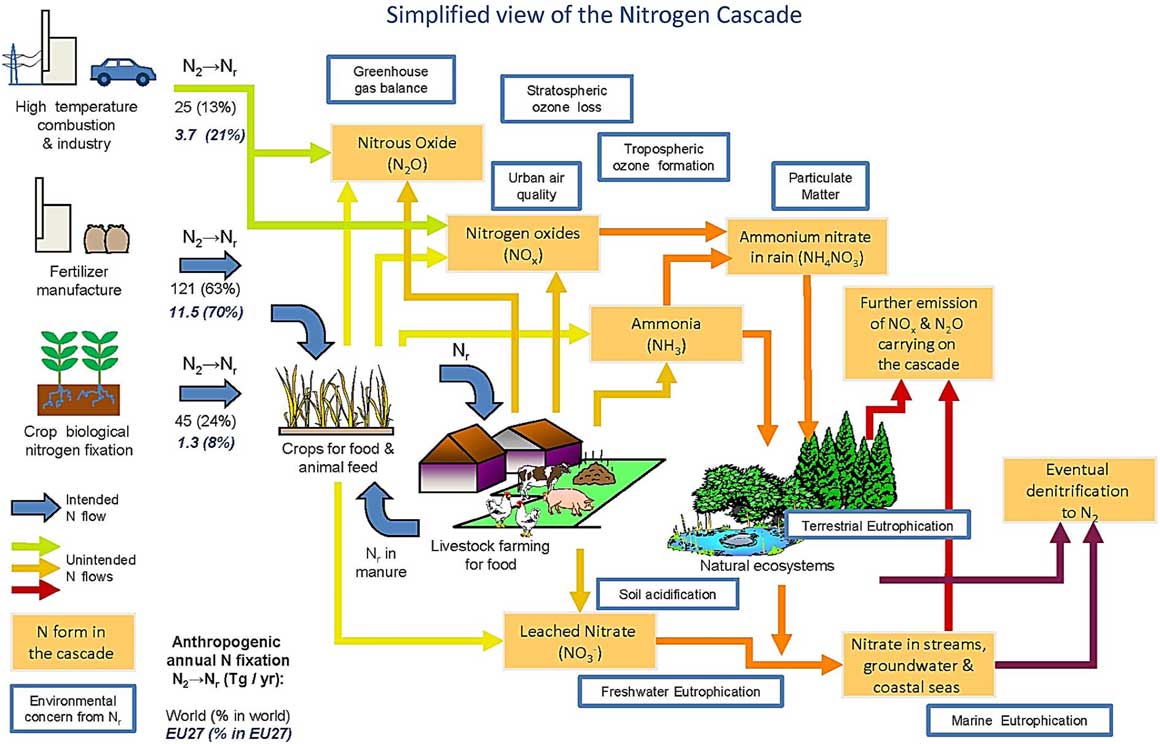
From a situation in which reactive nitrogen was the ‘weak link’ with respect to the food needs of the world’s population, we have come to a situation where nitrogen is highly available and inexpensive for agricultural production. Excessive use of reactive nitrogen, combined with a profound change of cropping systems, including regional specialisations and partial soil coverage in winter, does not enable cultures to uptake all available nitrogen. It therefore contributes to losses into the environment in the form of nitrate or dissolved organic nitrogen to surface or underground water and as emissions of NH3, NOx, N2O or N2 into the atmosphere. All these transfers and transformations of reactive nitrogen in ecosystems constitute the ‘nitrogen cascade’. The notion of cascade illustrates the production of excess reactive nitrogen emitted into environmental compartments with cascade-like consequences. Figure 2 shows the nitrogen cascade, indicating the large number of transfers, transformations and impacts in different environments (ecosystems, atmosphere and hydrosphere) and on humans. As an example, when a molecule of atmospheric di-nitrogen (N2) is converted to ammonia (NH3) with the Haber-Bosch process to produce industrial fertiliser, half of this nitrogen provided to crops is found in harvested food for man or livestock; the other half escapes into the atmosphere (NH3, NOx, N2O, N2) or water (NO3−, dissolved organic nitrogen) or is stored in the soil as organic matter of varying stability. Ammonia emissions can contribute to atmospheric pollution by enhancing the formation of fine particles that are harmful to human health, or can be deposited by precipitation onto the ground, resulting in its acidification and/or eutrophication. This soil enriched in nitrogen, such as a field, also produces NO that is emitted into the tropo-atmosphere where it contributes to the formation of ozone, adversely affecting public health and the delicate equilibrium of ecosystems. Micro-organisms present in the soil can also transform nitrogen deposited into nitrate that can then migrate to aquatic ecosystems, once again producing trophic imbalances or toxicities. This nitrate can also be denitrified to N2O (a major contributor to global climate change and degradation of the stratospheric ozone layer) or N2 (complete denitrification), thereby closing the loop of the cycle. The nitrogen cascade is thus a dynamic vision of nitrogen fate and adverse impacts it causes in various compartments of the environment (Billen et al., Reference Billen, Thieu, Garnier and Silvestre2009 and Reference Billen, Beusen, Bouwman and Garnier2010; Bobbink et al., Reference Bobbink, Hicks, Galloway, Spranger, Alkemade, Ashmore, Bustamante, Cinderby, Davidson, Dentener, Emmett, Erisman, Fenn, Gilliam, Nordin, Pardo and de Vries2010).
Simplified view of nitrogen cascade, highlighting the major anthropogenic sources of reactive nitrogen (Nr) from atmospheric di-nitrogen (N2), the main pollutant forms of Nr (orange boxes) and the nine main environmental concerns (blue boxes). Estimates of anthropogenic N fixation for the world (Tg/yr for 2005, in black, Galloway et al., Reference Galloway, Townsend, Erisman, Bekunda, Cai, Freney, Martinelli, Seitzinger and Sutton2008) are compared with estimates for Europe (Tg/yr for 2000, in blue italic, Leip et al., Reference Leip, Achermann, Billen, Bleeker, Bouwman, Achermann, de Vries, Dragosits, Doring, Fernall, Geupel, Herolstab, Johnes, Le Gall, Monni, Neveceral, Orlandini, Prud’homme, Reuter, Simpson, Seufert, Spranger, Sutton, van Aardenne, Vos and Winiwarter2011a). Energy is needed to fix N2 to Nr which is gradually dissipated through the cascade with eventual denitrification back to N2; Blue arrows represent intended anthropogenic N, flows; all other arrows are unintended flows (Sutton et al., ENA Reference Sutton, Howard, Erisman, Billen, Bleeker, Grennfelt, van Grinsven and Grizzetti2011).
Specificity of agriculture and livestock farming systems towards the nitrogen cascade
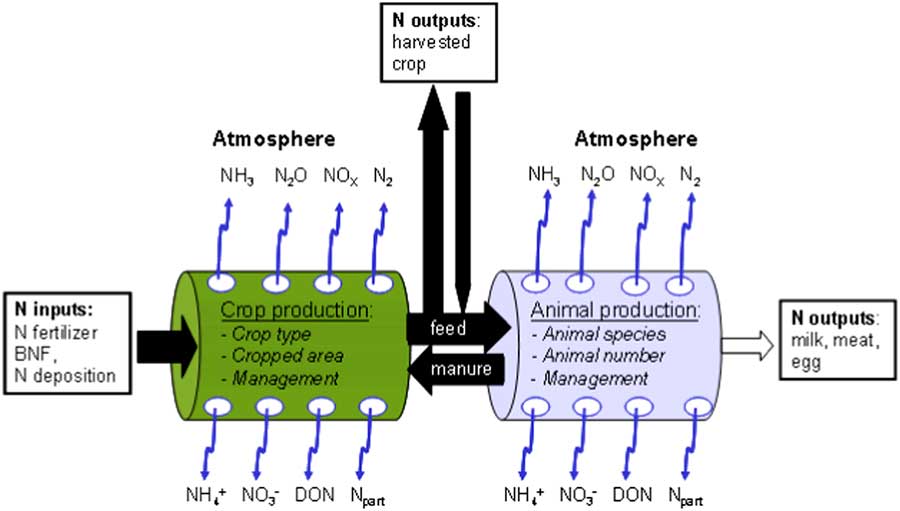
At the present time, the European agriculture (crop and livestock farming systems) consumes around 80 Mt of nitrogen, but not even 50% of this quantity ends up in the harvested parts of crops, the rest remaining in the soil or dispersed into the environment. Similarly, less than half the quantity of nitrogen excreted by livestock is reused by cultures, the rest entering the environment (Figure 3).
Circulation of nitrogen in the agricultural production system (Oenema et al., Reference Raison, Chambaut, Le Gall and Pflimlin2009). BNF=symbiotic nitrogen fixation by natural ecosystems; DON=dissolved organic nitrogen.

Agriculture is a major source of nitrogen compounds entering the air, soil and water
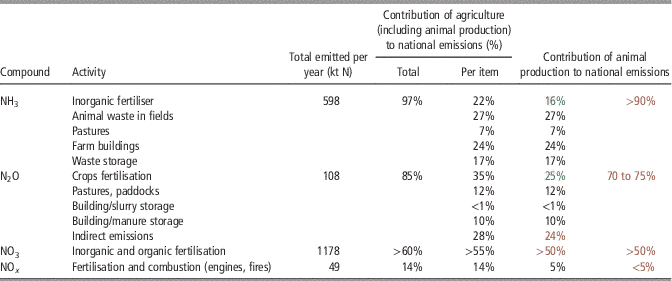
In livestock farming systems, nitrogen is lost from farm livestock housing, animal waste storage areas, grazed and fertilised fields. The risks of leaching nitrate and emissions of NH3, N2, N2O and NO in fields are related to the quantities provided, the nitrogen use by plants, properties of the soil and climatic conditions. According to the assessment procedures proposed in the context of the Gothenburg Protocol, French or European agriculture would be responsible for more than 95% of NH3 emissions, more than 80% of N2O emissions and 5% to 10% of NO emissions. In addition, according to the European Environmental Agency and the European Nitrogen Assessment (ENA), the contribution of agriculture to nitrogen losses to water exceeds 60%. Simulations using the Miterra-Europe model created by a Dutch research team show that nitrogen from animal waste accounts for about 80% of total NH3 and 50% of N2O emissions in the 27-Member European Union (EU) (Lesschen et al., Reference Lesschen, van den Berg, Westhoek, Witzke and Oenema2011). These data are consistent with other meta-analyses, in particular, national estimations and those of the ENA.
• Table 1 summarises data and estimations for French agriculture, highlighting the contributions of livestock farming systems to emissions of various forms of nitrogen. It is seen that agriculture is responsible for a substantial part of nitrate emissions, and that contribution to atmospheric emissions (NH3 and N2O) is even greater. Livestock farming systems are especially concerned by NH3 emissions as it has been estimated that they are responsible for more than 80% of agricultural emissions in the EU, undoubtedly even more than 90% if we consider emissions from crops grown as livestock feed. According to the same method of estimation, they are responsible for almost three-fourth of emissions of N2O. The bovine sector bears most responsibility for emissions of NH3 as it accounts for almost half the total of European emissions, the pig sector accounting for 25%. In France, respective figures for cattle, swine and poultry are 46%, 12% and 15% (Citepa, 2011). More precisely, emissions of NH3 are intimately related to animal excretions of urea or uric acid (above all poultry), to the type of animal housing and stabling and how animal waste is stored. About half the nitrogen excreted is lost from livestock housing and during storage phases and land application; this value is evidently highly variable, depending on farm conditions. The 30% losses occurring in livestock housing is partitioned into volatilisation (19%), denitrification and nitrification (7%), and leaching (4%). Another fraction of nitrogen (about 20% on average) is then lost as NH3 following land application of manure. These values are examined in detail in Langlais et al. (Reference Langlais, Nicourt, Bourblanc and Gaigné2014, in this issue). Even though these are approximate values, they point out the extent of losses that could lead to low nitrogen recovery from animal effluents.
Contribution of crops and livestock farming systems to emissions of reactive nitrogen

The first 3 columns are the total of crops and livestock farming systems and the last is livestock farming systems alone. In the column ‘Contribution of livestock farming systems’, numbers in green were determined by considering the part of nitrogen used for the production of forage and other feeds and those in red are the relative proportions between the quantities of nitrogen in waste and in inorganic fertilisers (calculation by the authors based on published data).
Environmental impacts of reactive nitrogen entering the environment
In the cascade of transfers and transformations of nitrogen, environmental impacts are primarily the result of reactive nitrogen entering environmental compartments: the atmosphere, hydrosphere and ecosystems. Pioneer work in the field coordinated by Galloway et al. (2003), followed by the ENA (2011), has resulted in an exhaustive panorama of negative impacts that could be caused by the presence of excessive quantities of reactive nitrogen in the environment, whether or not of agricultural origin, with respect to the extent that these environmental compartments can absorb, recycle or purify nitrogen compounds. These impacts are characterised by a wide diversity of spatial scales, from the very local to worldwide, and temporal scales, as well as by the fact that the same atom of nitrogen can contribute to several impacts via transformations and transfers. In addition, the same nitrogen compound can contribute to several impacts. Thus, ammonia was first studied for its role in acidification and eutrophication of the environment in the framework of air pollution by long distance transfers. At the present time, attention is being focused on its role in the formation of atmospheric particles. Nitrous oxide, produced predominantly by soil and to a lesser extent by litter, is a powerful greenhouse gas that also contributes to the destruction of stratospheric ozone. Part of N2O emissions could originate from nitrate, in addition to its role in water quality degradation, in particular eutrophication.
It is difficult to assess the net costs or benefits of nitrogen because of the wide range of its impacts and estimation challenges. For example, atmospheric particles have a negative effect on health but reduce the greenhouse effect, and some direct and indirect costs are difficult to quantify. A recent analysis by the ENA shows that the greatest costs involve public health, primarily as a result of the degradation of air quality (ozone and particles). Costs related to the impact on climate are much lower, in particular because of compensations between positive and negative effects. This assessment enables priorities to be ranked for society, in particular for guiding public policies, but there are considerable uncertainties in this area.
Concerning the management of these multiple flows, situations can be distinguished depending on whether spatial relationships between polluting emissions and damage are strong or weak. This distinction is often used by economists when pondering ways to reduce environmental negative impact:
• the emission of nitrous oxide, a greenhouse gas whose geographic distribution of damage is independent of the location of the source;
• the emission of ammonia whose damage is related to the location of the source, with impacts both in proximity and at greater distances at the regional to continental scales with pollution across borders;
• the emission of nitrate whose damage depends on the location of the source and that is geographically distributed depending on transfer process in each catchment area.
This diversity of spatial relations between nitrogen flows and impacts within a region shows that measures taken to limit the damage by reactive nitrogen enrichment are difficult to consider on the same bases, depending on which of its forms is assessed. In addition, measures taken to reduce impacts concerning one environmental compartment or one form of reactive nitrogen may be in opposition to another objective. For example: controlling ammonia emissions may be in opposition to measures aimed at reducing nitrate leaching or climate change (N2O emission). Similarly, promoting denitrification (down to N2) to reduce nitrate leaching (principle of biological treatment systems) may be a problem if denitrification is not complete and releases N2O, and in any case leads to a ‘loss’ of reactive nitrogen previously produced by consuming energy.
Impacts of nitrogen flows on regions and contribution from livestock farming systems
Work aimed at quantifying nitrogen flows at the scale of regions began in the early 1980s, related to the ‘acid rain’ issue, which means acidification of atmospheric precipitation by sulphur or nitrogen compounds, and the pollution of aquatic environments by nitrate. International task forces were created to support public policies in order to evaluate transfers and impacts, and continually update knowledge and understanding, particularly regarding transfers of air pollution over large distances. For issues of water or air quality, work at these scales attempts to pinpoint the vulnerability of the receiving environments by linking impacts to a nitrogen load determined quantitatively and qualitatively. The majority of these studies involved Western Europe (Billen et al., Reference Billen, Silvestre, Grizzetti, Leip, Garnier, Voss, Howarth, Bouraoui, Lepisto, Kortelainen, Johnes, Curtis, Humborg, Smedberg, Kaste, Ganeshram, Beusen and Lancelot2011; de Vries et al., Reference de Vries, Leip, Reinds, Kros, Lesschen, Bouwman, Grizzetti, Bouraoui, Butterbach-Bahl, Bergamaschi and Winiwarter2011; Grizzetti et al., Reference Grizzetti, Bouraoui, Billen, van Grinsven, Cardoso, Thieu, Garnier, Curtis, Howarth and Johnes2011; Leip et al., Reference Leip, Britz, Weiss and de Vries2011b) and North America, with little representation from the southern hemisphere and Eastern Europe (Durand et al., Reference Durand, Breuer, Johnes, Billen, Butturini, Pinay, van Grinsven, Garnier, Rivett, Reay, Curtis, Siemens, Maberly, Kaste, Humborg, Loeb, de Klein, Hejzlar, Skoulikidis, Kortelainen, Lepsito and Wright2011). Source data were obtained from agricultural statistics, observation networks in situ or from satellite images and modelling work. The results are far from homogeneous and their interpretation remains difficult: comparisons between different studies are often not made nor are possible in many cases. The number of explanatory factors and indicators used is limited, which could bias the results. For example, dissolved organic nitrogen had long been neglected, whereas the rare measurements conducted showed that it could be an important factor. In spite of these limitations, mapping studies provided data on magnitudes and spatial variability of polluting nitrogen pressure or load (the quantity of nitrogen brought into a region) or of the nitrogen surplus (the balance between nitrogen imports and exports at a given scale). These maps have confirmed that differences between regions of livestock farming systems depended on their animal density. In France, this explains the status of the western part of the country and Brittany in particular, where high densities are closer to those of The Netherlands or Denmark than to the rest of France.
Substantial transfers at the global scale: Europe is currently an overall nitrogen importer
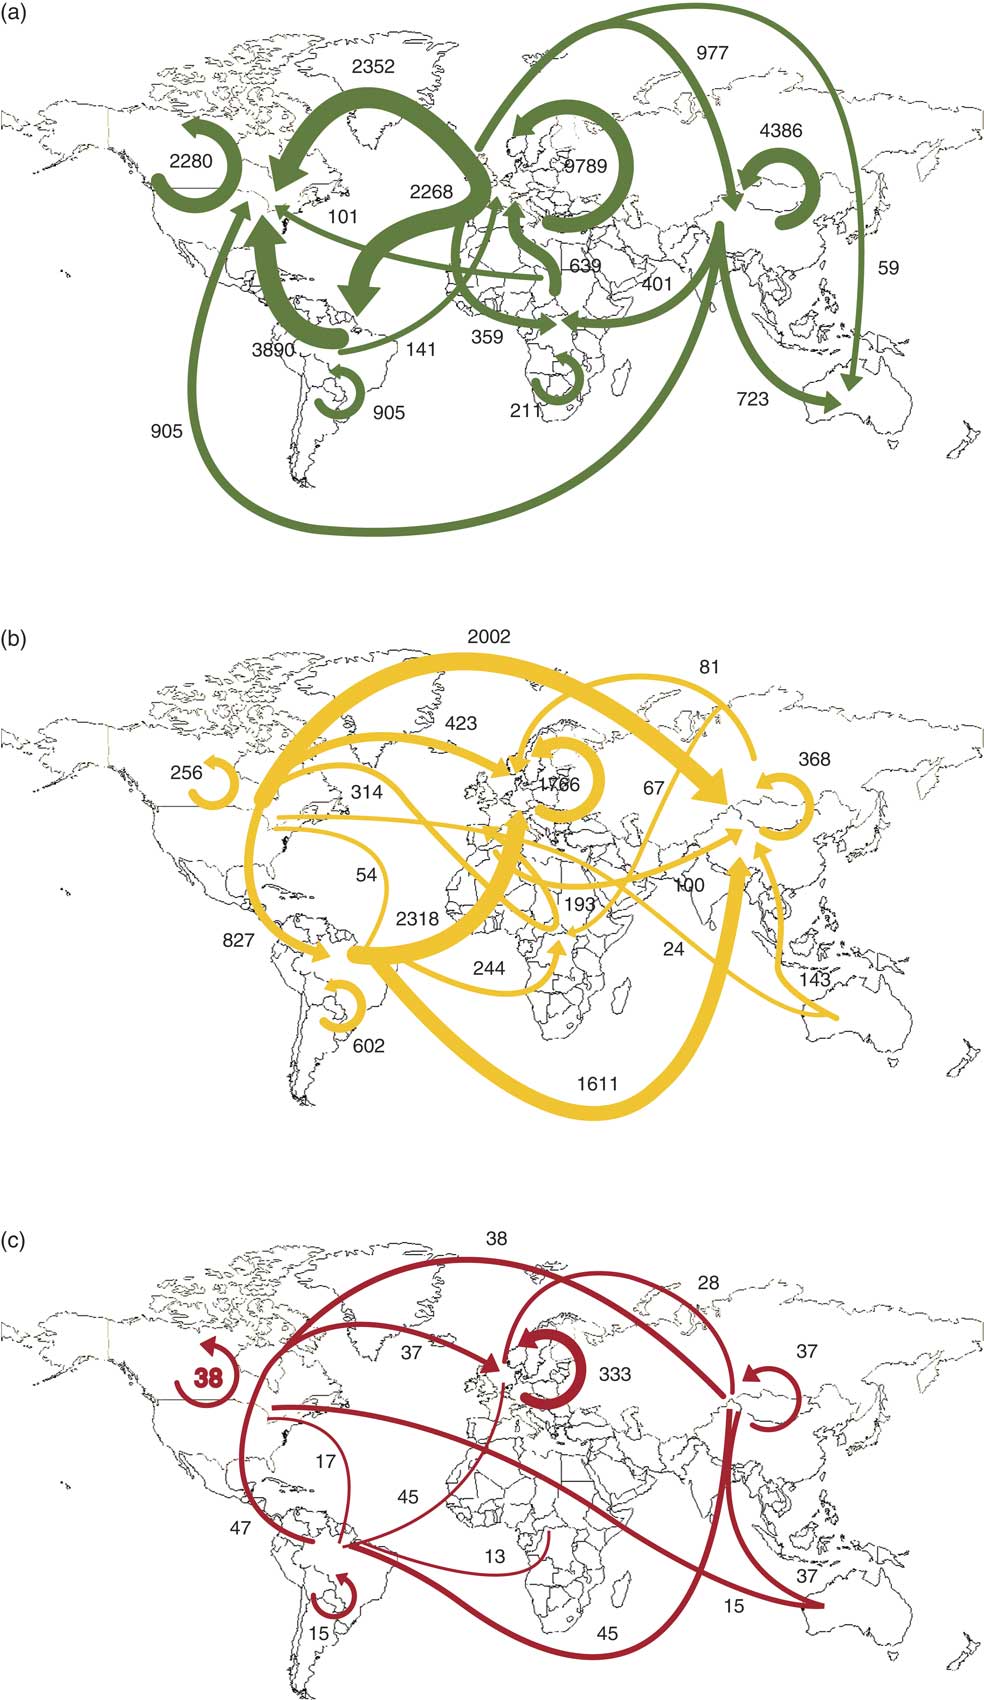
Nitrogen redistribution at the scale of the planet arises primarily from atmospheric transfers : 100 Mt at the end of the 20th century and possibly 200 Mt by the middle of the 21st century. International trade is also a major source of flows (Figure 4). Thus, Europe is a net importer of nitrogen as imports of grains and soybean cakes for livestock feed exceed exports of products and fertilisers (Mosier et al., Reference Mosier, Syers and Freney2004; Kuczynski et al., Reference Kuczynski, Dammgen, Webb and Myczko2005).
Flows and quantities of nitrogen (in kt) involved in international exchanges of fertilisers (a: 31 Mt), grains (b: 12 Mt) and meat (c: 0.8 Mt) in 2008 (from Galloway et al., Reference Galloway, Townsend, Erisman, Bekunda, Cai, Freney, Martinelli, Seitzinger and Sutton2008: 889–892).

Nitrogen exchanges raise the question of imputing costs for damage between regions of production and final consumers (end users). It was pointed out that in the 1990s, The Netherlands consumed 400 kt of nitrogen for growing food products equivalent to twice the needs of its population; and that if a portion of the production is exported as proteins, the totality of nitrogen losses and impacts on the environment remain imputable to the producing country (Erisman et al., Reference Erisman and Domburg2005 and Reference Erisman, Domburg, de Vries, Kros, de Haan and Sanders2011). The same is true for large areas of South America that bear the environmental cost of transforming land for soybean production to feed animals in Europe and Asia (Galloway, Townsend et al., Reference Galloway, Townsend, Erisman, Bekunda, Cai, Freney, Martinelli, Seitzinger and Sutton2008). This is also an issue when attempting to impute the responsibility of losses and impacts between regions of the same country or even between players in the same sector.
The global dimension of the nitrogen cascade and its geographic variability according to climates, soils, landscape infrastructures and agricultural driving forces have created the need for international scientific initiatives posing the stakes of the nitrogen cascade at different scales, for example, the International Nitrogen Initiative (http://initrogen.org/).
Distribution of nitrogen impacts in Europe
The consumption of nitrogen fertilisers increased considerably in the 27-Member States of the EU, from about 4 Mt of nitrogen in the early 1960s to more than 12 Mt in the late 1980s, before decreasing to around 10.5 Mt in 2002 (FAO, 2009). During the same period, total quantities of nitrogen excreted by herds in the EU increased from 7 to 8 Mt in the early 1960s to 11 Mt in the late 1980s, before decreasing to 10.3 Mt after 2000. These data illustrate the substantial increase in the nitrogen load into agrarian regions in Europe during the past 50 years. There are also other nitrogen inputs to consider (symbiotic nitrogen fixation: about 2.2 Mt; atmospheric deposits about 4 Mt; and food imports about 3.5 Mt). Miterra-Europe modelling has shown that on average in the EU, nitrogen inputs to the soil in 2000 were practically equally divided between synthetic nitrogen fertilisers (66 kg N/ha) and livestock farm waste (61 kg N/ha); symbiotic nitrogen fixation played a relatively minor role (5 kg N/ha), smaller than that of atmospheric deposits (12 kg N/ha). Crops export only 62 kg N/ha, that is, 43% of the total inputs (Velthof et al., Reference Velthof, Oudendag, Witzke, Asman, Klimont and Oenema2009 and Reference Velthof, Lesschen, Webb, Pietrzak, Miatkowski, Pinto, Kros and Oenema2014).
Information on the distribution of nitrogen losses can be contradictory because of divergent hypotheses in models used to estimate losses. The ranking of losses that resulted from the Miterra-Europe project were nitrate (45%), N2 (36%), NH3 (13%) and N2O (3%). In the ENA estimation, denitrification (N2 and N2O) was by far the principal pathway of nitrogen losses (44 kg N/ha UAS), followed by the volatilisation of NH3 (17 kg/ha UAAFootnote 1), leaching (16 kg/ha UAA) and emissions of NOx (2 kg/ha UAA) (Oenema et al., Reference Oenema, Oudendag and Velthof2007).
There are also considerable regional differences: nitrogen surpluses per unit of area are much higher in regions of intensive agriculture like northwest Europe than in more extensive regions such as mountains or southern Europe (Bouraoui et al., Reference Bouraoui, Grizzetti and Aloe2009). The orders of magnitude of estimations from European modelling are consistent with international data of the OECD and Eurostat, but occasionally with different values depending on the sources. For example, the estimate for France was 90 kg/ha per year of excess nitrogen by Miterra-Europe model but only 50 kg N/ha per year in French databases. These differences can be explained by differences in the databases used, as well as by the calculation methods (Sutton et al., Reference Sutton, Howard, Erisman, Billen, Bleeker, Grennfelt, van Grinsven and Grizzetti2011).
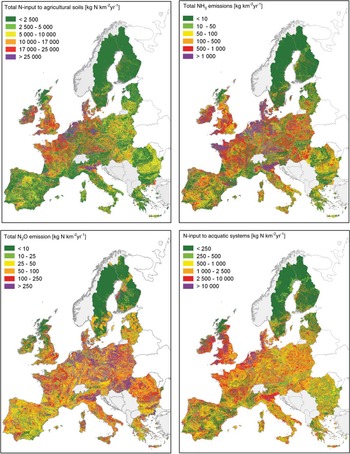
Comparing Figures 5 and 6 reveals the correspondence between nitrogen pressure and highly concentrated areas of livestock farming systems, that is, Ireland, western Brittany and western France in general, the region comprising Belgium, The Netherlands, Denmark and western Germany, and finally southern Germany and the Po plain in Italy. It is difficult to refine the analysis for several reasons. In particular, it could be expected to find spatial structures for the distribution of the fate of nitrogen surpluses between leaching and gas emissions, as the split between forms of nitrogen and animal production systems in a region is climate dependent. However, no clear pattern emerges at the French or European scales. These results obtained from modelling thus require validation by measurement networks covering contrasting agronomy/soil/climatic situations before being able to be used in more detail.
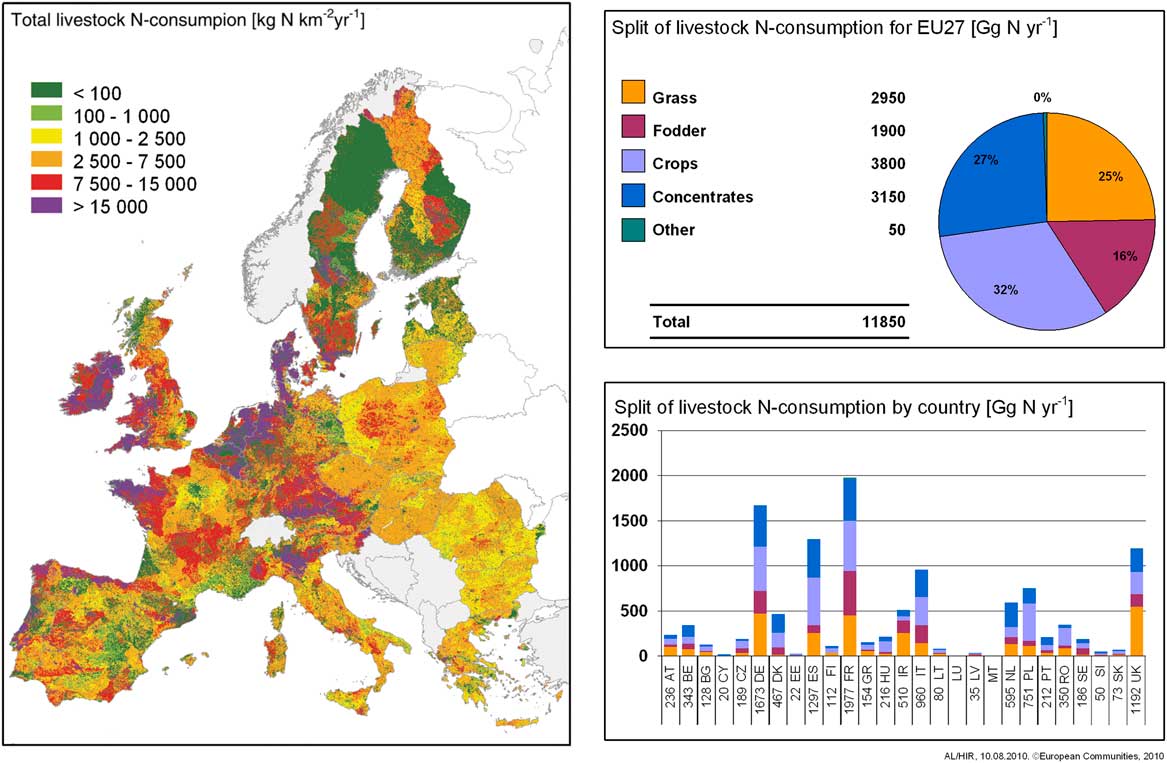
Total nitrogen consumption by livestock farming systems in Europe in 2002. The map shows consumption. The pie chart gives distributions between sources: grass (pastures and cut fodder), unprocessed food from cultivated land (maize, beets and others), grains (cereals, protein seeds and oil seeds), concentrates (concentrates rich in energy and/or proteins, meal cakes, etc.) and others (straw, animal products). The histogram gives distribution per country. Source: Leip et al. (Reference Leip, Achermann, Billen, Bleeker, Bouwman, Achermann, de Vries, Dragosits, Doring, Fernall, Geupel, Herolstab, Johnes, Le Gall, Monni, Neveceral, Orlandini, Prud’homme, Reuter, Simpson, Seufert, Spranger, Sutton, van Aardenne, Vos and Winiwarter2011a), ENA chapter 16 from figures in the Indicator Database for European Agriculture V1, 2009. Projection LAEA (Central meridian-10; Latitude of origin: 52); resolution 1km2. Legal notice: Neither the European commission nor any person acting on behalf of the commission is responsible for the use which might be made of this publication.

Distribution of nitrogen inputs in agricultural regions and emissions of reactive nitrogen into the air (NH3 and N2O) and into aquatic systems (mostly NO3) (Reference Leip, Achermann, Billen, Bleeker, Bouwman, Achermann, de Vries, Dragosits, Doring, Fernall, Geupel, Herolstab, Johnes, Le Gall, Monni, Neveceral, Orlandini, Prud’homme, Reuter, Simpson, Seufert, Spranger, Sutton, van Aardenne, Vos and Winiwarter2011a). Source: adapted from Leip et al., Reference Leip, Achermann, Billen, Bleeker, Bouwman, Achermann, de Vries, Dragosits, Doring, Fernall, Geupel, Herolstab, Johnes, Le Gall, Monni, Neveceral, Orlandini, Prud’homme, Reuter, Simpson, Seufert, Spranger, Sutton, van Aardenne, Vos and Winiwarter2011a; projection LAEA (Central meridian-10; Lattitude of origin: 52); resolution 1km2; Basis: database for European Agriculture IDEAgV1_20090415, 2009 (top left), Integrator, and EDGAR-CIRCE (top right and bottom left); INTEGRATOR and EMEP MSAC-Wmodel (bottom right). Methods used are described in the source. Legal notice: Neither the European commission nor any person acting on behalf of the commission is responsible for the use which might be made of this publication.

Modelling work has been done on the major European hydrographic basins: Seine, Moselle, Escaut and Danube (Billen et al., Reference Billen, Thieu, Garnier and Silvestre2009 and Reference Billen, Silvestre, Grizzetti, Leip, Garnier, Voss, Howarth, Bouraoui, Lepisto, Kortelainen, Johnes, Curtis, Humborg, Smedberg, Kaste, Ganeshram, Beusen and Lancelot2011; Schoumans et al., Reference Schoumans, Silgram, Walvoort, Groenendijk, Bouraoui, Andersen, Porto, Reisser, Le Gall, Anthony, Arheimer, Johnsson, Panagopoulos, Mimikou, Zweynert, Behrendt and Barr2009). It has shown that balances can be compartmentalised in accordance with hydrological losses and storage in the region in question. This work concluded that on average 20% of nitrogen surpluses reach the ocean. The ‘apparent nitrogen retention’ gives an idea of the ‘cleansing’ capacities of land comprising various regions; this notion is a complement to that of NUE, the nitrogen use efficiency, that is the ratio between nitrogen exported by products (from field in crop product) to nitrogen inputs applied to production.
In all the above cases, it is seen that the figures resulting from various estimations at these scales can be relatively different, concerning both overall quantities and their distribution among the different forms of nitrogen. This is because of the use of different databases (agricultural statistics, soils, land use, etc.) and models, but the major aspects remain similar.
Published data at the scale of Europe contain few studies at scales smaller than 100 km2 to obtain a precise characterisation of agricultural systems and a spatial description of the nitrogen cascade. However, they enable us to determine if typical situations can be defined in terms of livestock farm systems, density, distribution in a region and soil-climatic context as a function of their sensitivity to impacts of nitrogen emissions on natural resources.
The role of landscape has been investigated for determining the potential to capture atmospheric emissions by forest cover, even tailoring areas around spot sources like livestock housing or to protect sensitive areas such as Natura 2000 zones. The few studies that combine airborne transfers, the landscaping approach and sometimes hydrological losses have highlighted transfers to semi-natural zones and the positive role of wetlands bordering watercourses on the retention of nitrogen: this retention can reach 30%. Modelling studies revealed interactions between different types of transfers and the importance of considering them for a better understanding of nitrogen dynamics at the scale of the landscape. Finally, extrapolating local studies to broader scale should be done with prudence because of the substantial variability of situations and results (Haag and Kaupenjohann, Reference Haag and Kaupenjohann2001; Durand, Reference Durand2004; Basset-Mens et al., Reference Basset-Mens, Anibar, Durand and van der Werf2006; Dragosits et al., Reference Dragosits, Theobald, Place, ApSimon and Sutton2006; Mayer et al., Reference Mayer, Reynolds, McCutchen and Canfield2007; Billy et al., Reference Billy, Billen, Sebilo, Birgand and Tournebize2010; Montreuil et al., Reference Montreuil, Mérot and Marmonier2010).
Regional distribution of losses as a function of the characteristics of agricultural production
All scientific studies concur on linking NH3 emissions directly to animal density. This is also the conclusion of the European Environment Agency as illustrated in Figures 5 and 6.
Nitrate leakages are predominantly related to the proportion of farmland in the region, the types of cropping systems present and the soil-climatic context (Johnson et al., Reference Johnson, Myers and Patil2001; Hayakawa et al., Reference Hayakawa, Shimizu, Woli, Kuramochi and Hatano2006; Lam et al., Reference Lam, Schmalz and Fohrer2010; Montreuil et al., Reference Montreuil, Mérot and Marmonier2010; Shimizu et al., Reference Shimizu, Marutani, Desyatkin, Jin, Nakano, Hata and Hatano2010; Durand et al., Reference Durand, Breuer, Johnes, Billen, Butturini, Pinay, van Grinsven, Garnier, Rivett, Reay, Curtis, Siemens, Maberly, Kaste, Humborg, Loeb, de Klein, Hejzlar, Skoulikidis, Kortelainen, Lepsito and Wright2011). Concentrations found in rivers and aquifers have confirmed that although the water quality in regions of intensive livestock farming systems is generally degraded, they are not the only ones as the intensive croplands are also major nitrogen emitters because of the use of great quantities of inorganic fertilisers. In particular, French data from the Ecology Ministry (SOES 2010) show that the nitrate content of surface water in livestock farming regions in the western part of the country is the highest, but that this content is currently increasing in intensive croplands.
N2O emissions are correlated primarily with supplies of inorganic and organic fertilisers and with the properties of soils related to the recurrence of anoxic states. Emissions from livestock housing and from the management of animal waste are much lower than those of NH3 according to GIEC calculations (implemented in France by the CITEPA).
The quantification of nitrogen emissions and/or losses at the scale of farms is available for both France and Europe, primarily in zones vulnerable to nitrate pollution. Most of these zones are in the northern European Atlantic arc, a region of high dairy cattle density, often combined with industrial swine and/or poultry production. This is also true in northern and western France, regions of intensive livestock and cropland farming. Very little scientific literature on agricultural nitrogen pollutions concerns regions of extensive livestock farming systems and regions in southern and eastern Europe (Durand et al., Reference Durand, Breuer, Johnes, Billen, Butturini, Pinay, van Grinsven, Garnier, Rivett, Reay, Curtis, Siemens, Maberly, Kaste, Humborg, Loeb, de Klein, Hejzlar, Skoulikidis, Kortelainen, Lepsito and Wright2011). Nevertheless, current understanding enables many livestock farm systems to be simulated (e.g. Figure 5).
Some case studies have identified livestock production practices as point sources of nitrogen losses: livestock pens, areas where animals eat and drink, pastures on steep slopes or impermeable soils, poorly managed pasture rotation, etc. These studies also enable quantification of possible savings by the adoption of ‘good practices’ like fertilisation adjustments or introduction of intercropping.
Contrasting situations in France
On average, in France and Europe, just over half of nitrogen inputs used to fertilise land is from synthetic fertilisers (2110 kt) and the rest is from livestock farm waste (1820 kt), waste water treatment sludge and composts (21 kt) (CITEPA statistics for 2009). Nitrogen inputs from symbiotic nitrogen fixation accounts for about 500 kt, of which about 80% arise from legumes in permanent pastures and 10% from alfalfa.
The largest excesses of the nitrogen balance are in western France (Table 2) linked with intensive livestock farming systems, when measured before application of liquid pig manure (Le Gall et al., Reference Le Gall, Vertès, Pflimlin, Chambaut, Delaby, Durand, van der Werf, Turpin and Bras2005).
Nitrogen loads in different regions according to farming systems (Le Gall et al., Reference Le Gall, Vertès, Pflimlin, Chambaut, Delaby, Durand, van der Werf, Turpin and Bras2005)

UAA=utilised agricultural area.
The surplus of the nitrogen budget (for the soil-plant system budget, see Bockstaller, Reference Bockstaller, Vertès, Fiorelli and Aarts2014, in this issue) was calculated before treatment of liquid swine manure.
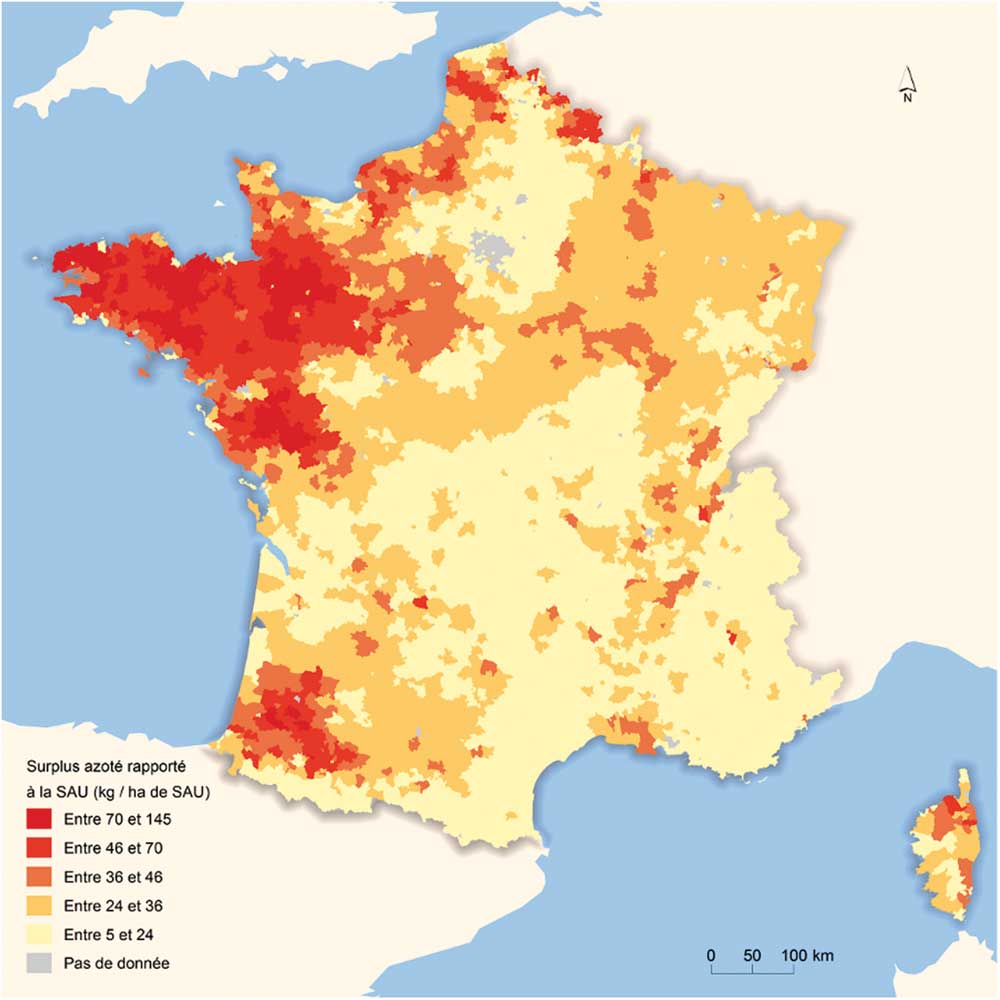
In 2007, the French Livestock-Breeders’ Institute (Bertrand et al., Reference Bertrand, Miramal, Pflimlin, Le Gall and Raison2007) prepared an ‘inventory’ based on agricultural survey data from 2000 provided from Statistics Department of the Agriculture Ministry, fertiliser industry and National Water Data Network. It was found that organic and inorganic nitrogen pressure varies considerably depending on the region (Figure 7). As expected, organic inputs are by far the highest in western France. Whereas the national average is 50 kg/ha, the balances exceed 130 kg N/ha in several areas with combined milk, pigs and poultry production (Brittany) or in areas producing beef and poultry (southern part of the Loire region) or also in those specialised in dairy production (southern Normandy, eastern Brittany). In the contrary, inorganic nitrogen pressure is concentrated primarily in croplands in the Paris basin and the southwest regions.
Nitrogen surplus in France (in kg N/ha). Source: Soes, website.

This work showed that surpluses of ‘soil-plant system’ N budget are 79 kg N/ha per year on average in Brittany compared with the national average of 29 kg N/ha per year and that the balances of several specialised regions in livestock farming (Grand Massif Central, Jura, Alps) are lower than 15 kg N/ha per year. Livestock farming systems in France are thus far from being homogeneous in terms of nitrogen balance and risks of nitrogen leakages. Nitrogen excesses harmful to water quality do not affect the vast majority of French regions of livestock production. Only a part of western France, including Brittany and the Loire region can be compared with regions of intensive livestock farming systems in northern Europe. It is to be noted that since the 2000 survey data, changes in practices have substantially reduced nitrogen excesses in some small watershed basins where action plans against marine algal blooms have been implemented (50 to 55 kg N/ha). Even though mentioned less often, excess nitrogen levels are also high in some areas of Poitou-Charentes.
Currently, Brittany hosts a very large number of animals, whereas it occupies only 6% of national agricultural land. The government statistics AGRESTE 2010 reports that 20% of the country’s dairy cows, 54% of the sows, 56% of the butcher pork and 41% of the laying hens are bred in Brittany. In order to feed this livestock population, the region imports large quantities of cereals, soybean cakes and nitrogen fertilisers. Estimations of these quantities of nitrogen vary with sources and years. According to the Brittany Economic Council (source: DRAAF/Regional Directorate of Agriculture and Forests), nitrogen supplies to soil from manure are about 206 000 t/year (2006 to 2008) of which half is from cattle, 28% from swine and 16% from poultry, to which are added about 100000 t/yr of synthetic N fertilisers. Nitrogen flows to the oceans have been estimated at 75 000 t/year with a range from 20 000 to 160 000 t depending on the year, that is, an order of magnitude equivalent to one quarter of nitrogen supplies to land. The resorption of nitrogen from liquid pig manure by land application accounts for about 10 000 t/year (Aurousseau, Reference Aurousseau2011).
Sensitivity of the local ecosystems
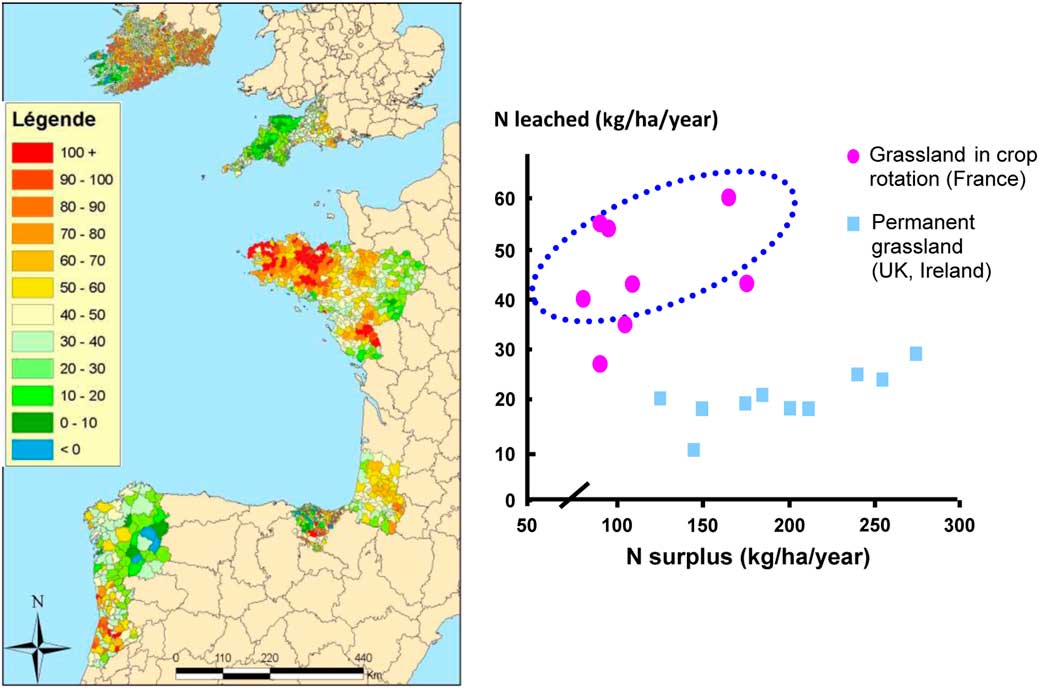
The same nitrogen balance can lead to different impacts depending on the sensitivity of the target environmental compartment. Denitrification and leaching also vary considerably depending on rainfall and temperature: the warmer and drier the climate, the lower the losses. Soil composition also plays a role: losses by denitrification are very high in peaty soils, moderate in silty and clayey soils and minimal in sandy soils. Inversely, the risk of leaching is highest in sandy soils and in systems not ensuring year-round ground cover or involving frequent pasture rotations (Gascuel-Odoux et al., Reference Gascuel-Odoux, Aurousseau, Durand, Ruiz and Molenat2010). Figure 8 shows that nitrate contents of water do not depend only on the extent of the surplus of nitrogen balance, but also on regional sensitivity. Aside from the fact that denitrification and leaching are not always in phase, this example opens the door for considering other sources of variations rarely quantified such as nitrogen storage in the soil, inhibition of nitrification, longer transit time in aquifers, etc. All these factors could explain why the average levels of leaching are higher in Brittany than in Ireland or the United Kingdom, although the surplus of the nitrogen balance is the same (Figure 8).
Relationship between nitrogen excesses and the nitrate content of surface waters (Greendairy project, Pflimlin et al., Reference Pflimlin, Irle and Mirabal2006). On the left: map of nitrate contents of water and budgets in the Greendairy regions. On the right: comparison of nitrate leakages between western France and Ireland and the United Kingdom as a function of the nitrogen balance surplus (from Raison et al., Reference Raison, Chambaut, Le Gall and Pflimlin2008).

Coastal algal blooms are one of the most visible consequences of this sensitivity of environmental compartments to N load. Published scientific results have clearly shown the role of nitrogen as a determining factor in the control of proliferation of marine green algae (Ulva sp.) whether in Brittany or at other sites of coastal blooms in the world (Piriou et al., Reference Piriou, Ménesguen and Salomon1991; Viaroli et al., Reference Viaroli, Giordani, Bartoli, Naldi, Nizzoli, Ferrari, Zaldìvar, Bencivelli, Castaldelli and Fano2006). In ‘green algae catchment areas’, where action plans have been implemented (Lieue de Grève, Saint-Brieuc bay, Concarneau and Douarnenez basins, all located in Brittany), nitrogen from agriculture accounts for practically the totality of nitrogen flows reaching the ocean, whereas treated waste water accounts for only about 5%, as most water waste treatment plants now include denitrifying treatments. In these catchment areas, the standard threshold of 50 mg NO3−/l for drinking water is much higher than the levels needed to further limit eutrophication (Billen et al., Reference Billen, Silvestre, Grizzetti, Leip, Garnier, Voss, Howarth, Bouraoui, Lepisto, Kortelainen, Johnes, Curtis, Humborg, Smedberg, Kaste, Ganeshram, Beusen and Lancelot2011; Durand et al., Reference Durand, Breuer, Johnes, Billen, Butturini, Pinay, van Grinsven, Garnier, Rivett, Reay, Curtis, Siemens, Maberly, Kaste, Humborg, Loeb, de Klein, Hejzlar, Skoulikidis, Kortelainen, Lepsito and Wright2011; Howarth et al., Reference Howarth, Chan, Conley, Garnier, Doney, Marino and Billen2011). Simulations conducted by the IFREMER (French Institute of Research for Exploitation of the Sea) show that during an average hydrological year, nitrate concentrations in rivers must decline below 15 even 10 mg/l in order to reduce significantly algal bloom in shallow and enclosed bays, particularly favourable to the proliferation of green algae (Ménesguen and Piriou, Reference Ménesguen and Piriou1995). Currently, average concentrations in Brittany are about 30 mg NO3−/l but vary considerably depending on the catchment areas. The biomass of algae produced by algal bloom in Brittany has been estimated on average to be 200 000 t annually, but only a fraction washes up on shores (109 sites inventoried) and this fraction is highly variable. Nearly all the algal biomass produced in the Côtes d’Armor region reaches the shore whereas more than 95% of the biomass does not reach the coastline in the south of the Finistère region where the phenomenon of green algae washed up is thus not very visible (Conseil économique social et environnemental de Bretagne, 2011).