Introduction
Neltuma pallida (Humb. and Bonpl. ex Willd.) C.E.Hughes and G.P.Lewis (hereafter referred to as algaroba) is an endemic species found in the dry coastal forests of Peru. Prior to 2022, algaroba was referred to as Prosopis pallida (Hughes et al. Reference Hughes, Ringelberg, Lewis and Catalano2022). Although algaroba is currently recognised as a key ecological and economic component of the dry forest landscape, its importance dates to pre-Inca times (McRostie et al. Reference McRostie, Gayo, Santoro, De Pol-Holz and Latorre2017). Consequently, archaeological remains of algaroba are found in the form of tools, pillars, roof beams, and furniture (Beresford-Jones and Whaley Reference Beresford-Jones and Whaley2021; Ruiz, et al. Reference Ruiz, Schimpf, Martínez, Puppo and Felker2022). The relatively high wood density of this species allowed these remains to be preserved over long periods and now enables researchers to better understand the history of ancient civilisations (Martínez-Cabrera et al. Reference Martínez-Cabrera, Jones, Espino and Jochen Schenk2009).
In the former genus Prosopis, the identification of annual growth rings has historically been challenging (Pacheco-Solana et al. Reference Pacheco-Solana, Oelkers, D’Arrigo, Santos, Rodriguez-Caton, Tejedor, Ferrero, Fuentes, Maldonado and Andreu-Hayles2023). This is partly due to the wide diversity in growth patterns among species within the genus, but also due to anatomical variability within the same species or even within the same specimen (Villalba et al. Reference Villalba, Villagra, Boninsegna, Morales and Moyano2000). In the last two decades, several studies have shown tropical species, generate annual growth rings. However, most of them have been found in high elevation areas, suggesting targeting specific species and regions is necessary to obtain reliable data (Groenendijk et al. Reference Groenendijk, Babst, Trouet, Fan, Granato-Souza, Locosselli, Mokria, Panthi, Pumijumnong, Abiyu and Acuña-Soto2025). Moreover, the combination of dendrochronology with radiocarbon dating methodologies have shown remarkable results in tree-ring identification of tropical species (Fontana et al. Reference Fontana, Godoy-Veiga, Lopez, Pessenda, Hornik, Assis-Pereira, Scipioni, da Cruz, Tamazello-Filho and Villalba2025). This could improve recent efforts, particularly on Neltuma species (Boninsegna et al. Reference Boninsegna, Argollo, Aravena, Barichivich, Christie, Ferrero, Lara, Le Quesne, Luckman, Masiokas, Morales, Oliveira, Roig, Srur and Villalba2009), to identify annual growth rings (Salazar et al. Reference Salazar, Navarro-Cerrillo, Ancajima, Lazo Duque, Rodrı́guez and Ghezzi2018).
Even without the use of radiocarbon dating methodologies, the potential of algaroba in the Peruvian coast has been recognised for dendrochronological studies (Groenendijk et al. Reference Groenendijk, Babst, Trouet, Fan, Granato-Souza, Locosselli, Mokria, Panthi, Pumijumnong, Abiyu and Acuña-Soto2025; Rodríguez et al. Reference Rodríguez, Mabres, Luckman, Evans, Masiokas and Ektvedt2005). Its growth is highly sensitive to summer precipitation and extreme climate events. Unlike most tropical areas, the climate of the west-Pacific coast of South America is controlled by the Humboldt current, a low-level jet, and sea temperature anomalies (Rollenbeck et al. Reference Rollenbeck, Bayer, Münchow, Richter, Rodriguez and Atarama2015). These components exert an environmental pressure that creates long dry winters and wet summers, limiting plant growth, species distribution and composition (Muenchow et al. Reference Muenchow, Dieker, Böttcher, Brock, Didenko, Fremout, Jakubka, Jentsch, Nüst, Richter, Rodríguez, Rodríguez, Rollenbeck, Salazar Zarsosa, Schratz and Brenning2020). As the most widespread and long-lived species in the area, Neltuma pallida represents a biological record of these annual environmental variations. Additionally, its use in recording events related to the El Niño Southern Oscillation (ENSO) provides important information for climatology, ecology, and dendroarchaeological research (Ghezzi et al. Reference Ghezzi, Towner, Winters and Rodríguez2002; López et al. Reference López, Rodriguez, Gracia and Sabate2006; Salazar et al. Reference Salazar, Navarro-Cerrillo, Ancajima, Lazo Duque, Rodrı́guez and Ghezzi2018). In Peru’s dry coastal forest, ENSO creates short wet periods (1–2 years) with significant changes in precipitation and temperature. ENSO events can increase rainfall up to tenfold compared to normal years and can influence plant productivity for multiple subsequent years (Herrera-Ramirez et al. Reference Herrera-Ramirez, Andreu-Hayles, Del Valle, Santos and Gonzalez2017; Holmgren et al. Reference Holmgren, Stapp, Dickman, Gracia, Graham, Gutiérrez, Hice, Jaksic, Kelt, Letnic, Lima, López, Meserve, Milstead, Polis, Previtali, Richter, Sabaté and Squeo2006). The frequency and intensity of ENSO events can be studied using tree-ring data from algaroba. However, as with other tropical species, careful adjustments are necessary to account for double and missing rings (Paredes-Villanueva et al. Reference Paredes-Villanueva, Sánchez-Salguero, Manzanedo, Quevedo Sopepi, Palacios and Navarro2013, Santos et al. Reference Santos, Rodriguez, Barreto, Assis-Pereira, Barbosa, Roig and Tomazello-Filho2021).
The aim of our study was to compile a floating chronology for algaroba from the Casma Region of Peru. Using the wiggle-matching method, we attempted to establish absolute dates from radiocarbon analyses of individual annual growth rings that had been relatively dated by dendrochronology. In doing so, we sought to create a chronological framework for the ancient civilisation that once colonised this area and inhabited the Cerro Laguna archaeological site. This study represents a preliminary step towards developing an absolute dendrochronological chronology. This would enable the preparation of data on radiocarbon concentration changes over the study period to refine the calibration curve for the Southern Hemisphere.
Materials and methods
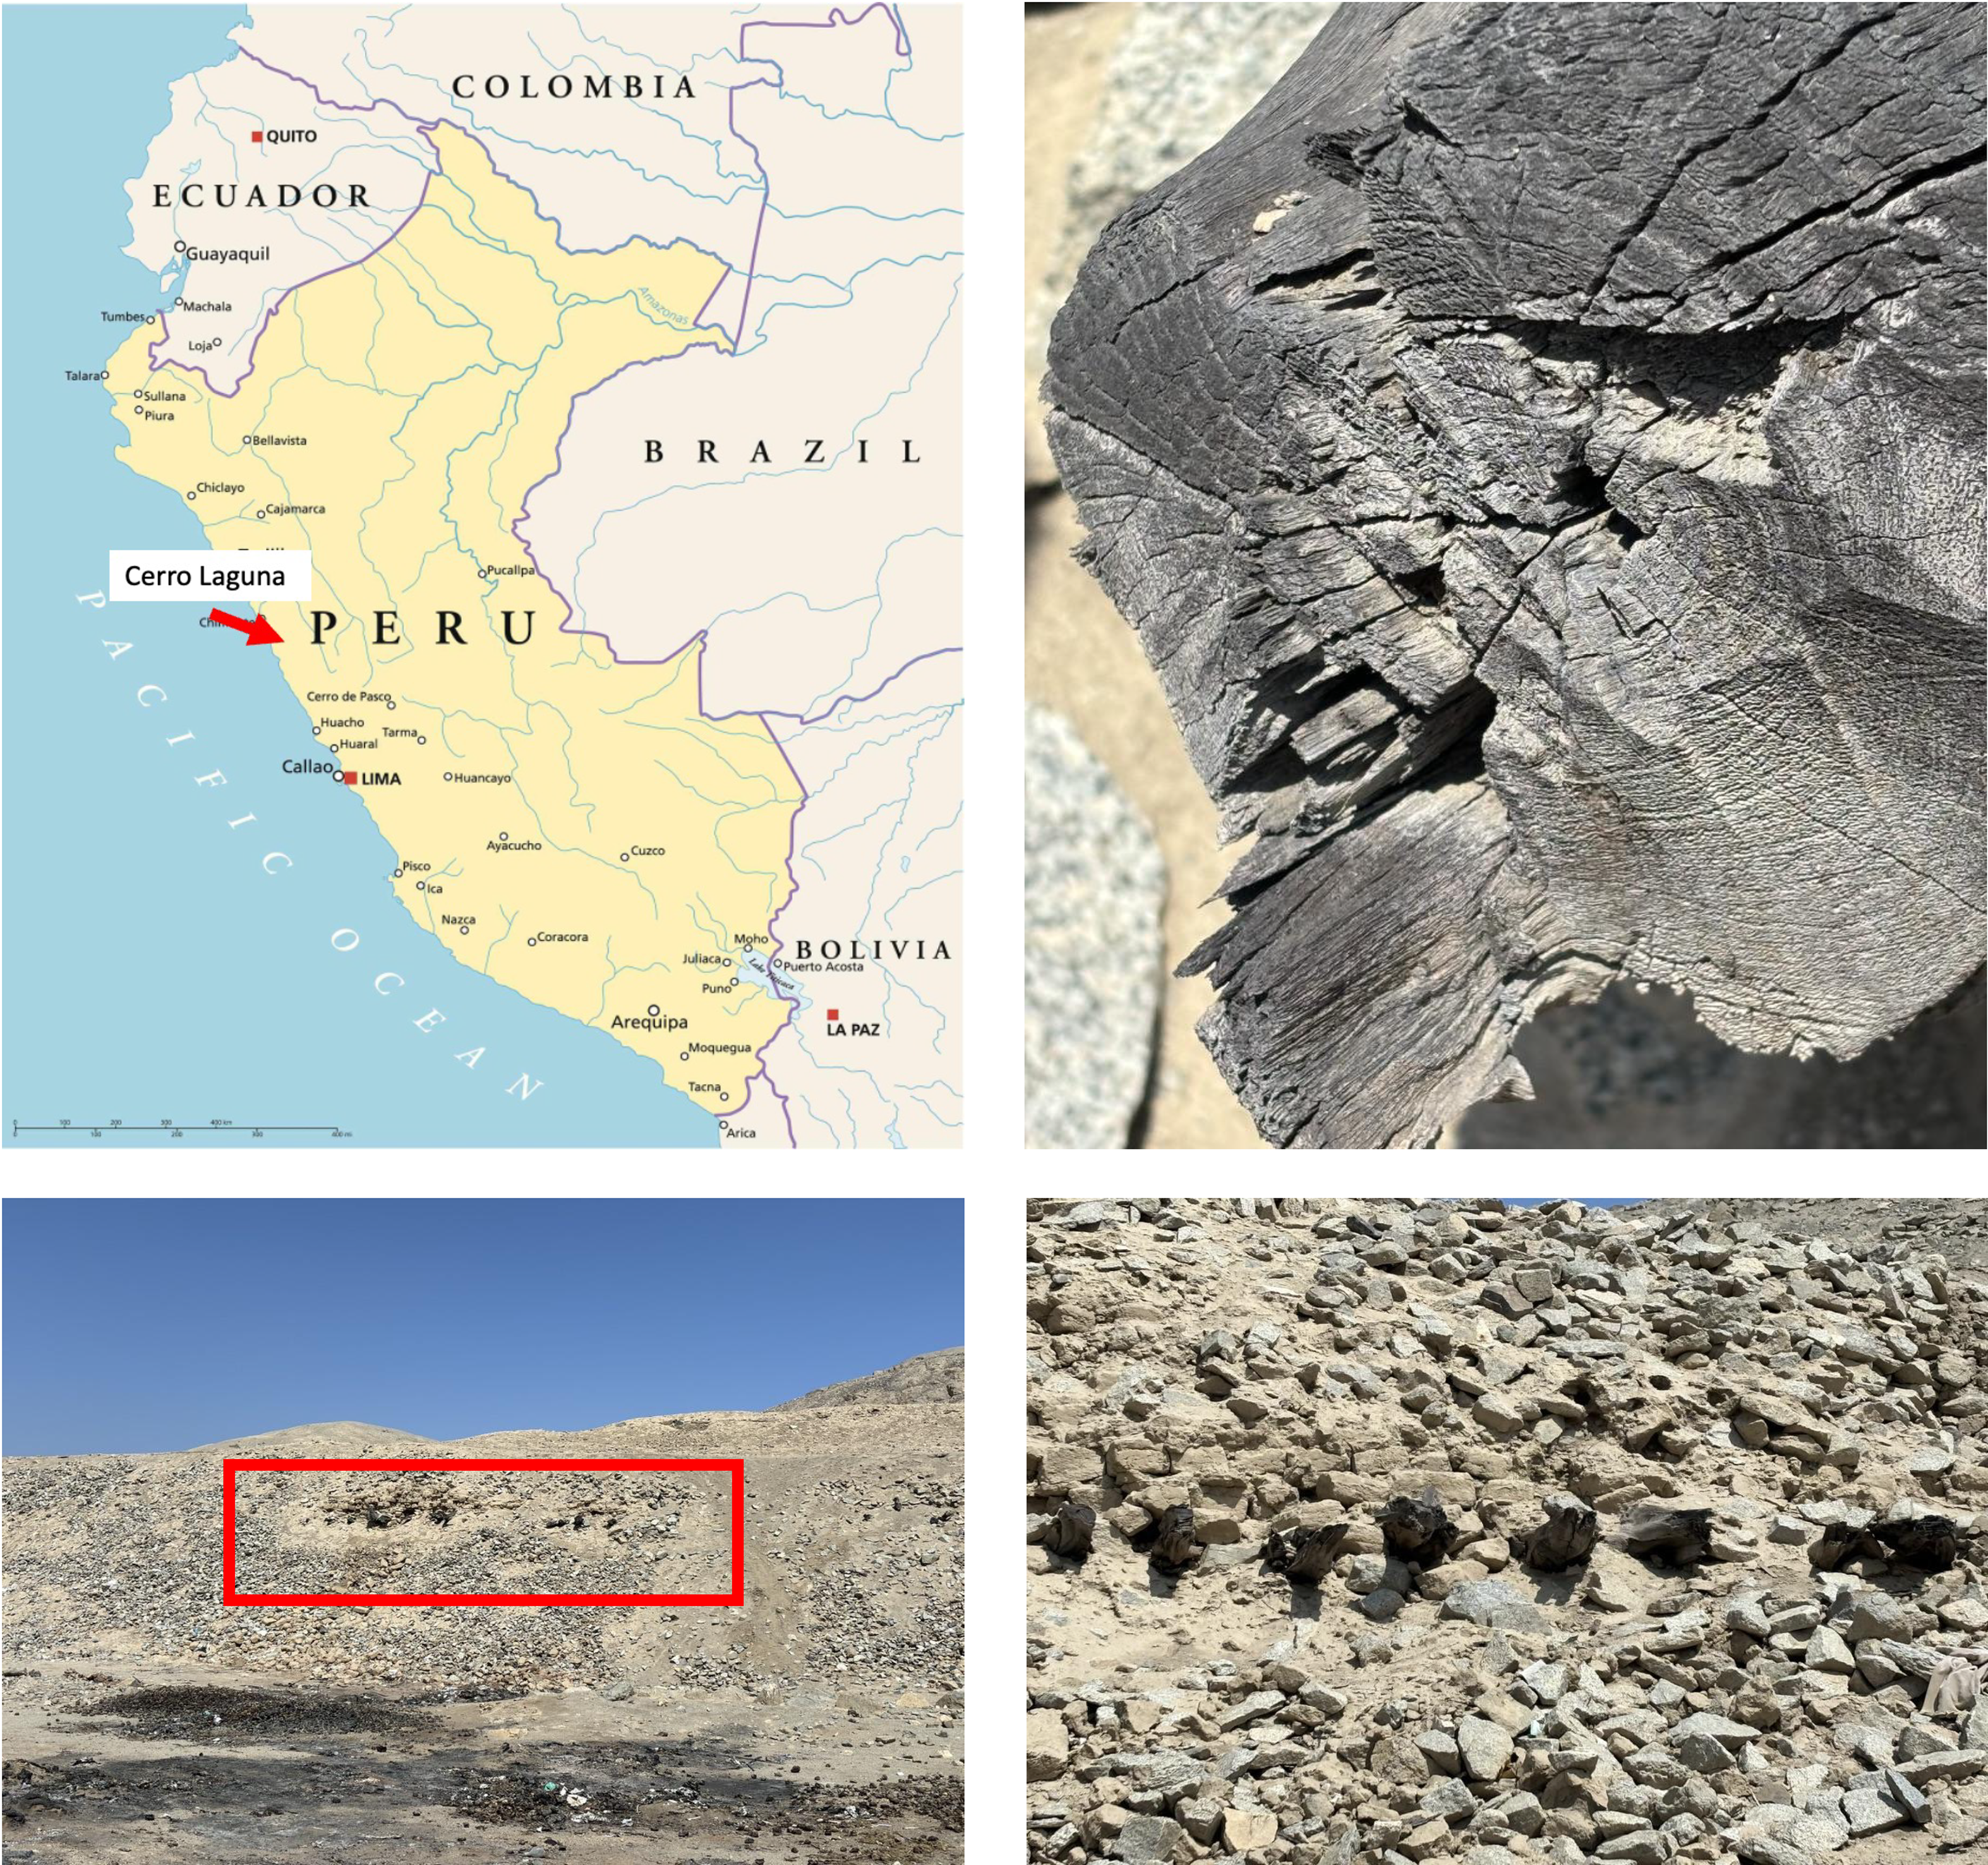
The Cerro Laguna archaeological complex is in the Ancash region of Peru, characterised by semiarid climatic conditions (Figure 1, Table 1). The maximum temperature reaches 34 °C in summer and 15°C in winter. Annual precipitation totals range from 48 to 208 mm, with rainfall concentrated in the summer months (January to April), followed by a long, cool, dry period for the remainder of the year. Preliminary archaeological studies suggest that Cerro Laguna dates to the Late Intermediate Period, ca. 600–1300 CE (Ghezzi, pers. comm.). Based on archaeological information and previous studies of the nearby Chankillo site, we can assume that all trees originated from this site (Ghezzi and Rodriguez Reference Ghezzi and Rodríguez2015).
Location of the Cerro Laguna site: (9°28′57.47″S, 78°15′10.86″E), map image PeterHermesFurian/Getty Images (2025). Photos of the archaeological site presenting the positions of the wooden logs.

Figure 1. Long description
The image consists of three elements: a map of Peru, a close-up of a wooden log, and a landscape photo of a desert area. The map highlights the location of Cerro Laguna in Peru, marked with a red arrow. The close-up shows a wooden log with visible cracks and weathering, indicating its age and exposure to the elements. The landscape photo depicts a desert area with a red rectangle marking a specific location, likely the archaeological site mentioned in the citation. The combination of these images provides context for the location and condition of the archaeological remains of algaroba wood.
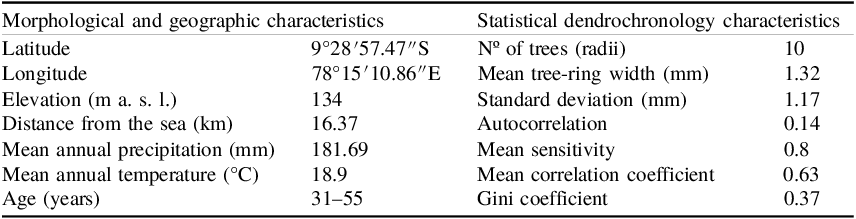
Environmental characteristics, location, and statistical characteristics of the Cerro Laguna dendrochronology sequence including 10 samples. Statistical measurements were made using the double-detrended dendrochronological series, except for the mean tree-ring width and the standard deviation, which were made using raw data to preserve the real units.

Table 1. Long description
The table presents a comparison of environmental, geographic, and statistical characteristics of the Cerro Laguna dendrochronology sequence. It includes data on latitude, longitude, elevation, distance from the sea, mean annual precipitation, mean annual temperature, and age of trees. The statistical dendrochronology characteristics include the number of trees, mean tree-ring width, standard deviation, autocorrelation, mean sensitivity, mean correlation coefficient, and Gini coefficient. The table has two main columns: Morphological and Geographic Characteristics, and Statistical Dendrochronology Characteristics. Each row provides specific measurements and values for these characteristics. For example, the latitude is 9 degrees 28 minutes 57.47 seconds, and the longitude is 78 degrees 15 minutes 10.86 seconds. The elevation is 134 meters above sea level, and the distance from the sea is 16.37 kilometers. The mean annual precipitation is 181.69 millimeters, and the mean annual temperature is 18.9 degrees Celsius. The age of the trees ranges from 31 to 55 years. The statistical characteristics include 10 trees with a mean tree-ring width of 1.32 millimeters and a standard deviation of 1.17 millimeters. The autocorrelation is 0.14, the mean sensitivity is 0.8, the mean correlation coefficient is 0.63, and the Gini coefficient is 0.37.
Ten cross-sections from different trunks, constituting the remains of the roof structure, were collected from the Cerro Laguna archaeological complex (Figure 1 and Figure S1). The relatively small number of samples analysed was due to conservation guidelines aimed at protecting the remains of historical settlements.
All cross-section samples were air-dried and polished using sandpaper of various grades (from P24 to P2500), following the grain standards of the Federation of European Producers of Abrasives (https://www.fepa-abrasives.com/). Once the terminal parenchyma was clearly visible under a binocular microscope, up to two radii were selected in each cross-section to measure tree-ring width digitally. Owing to the irregular radial growth of algaroba, tree rings were examined across the entire disc to detect false or double rings. The correlation coefficient between both radii from the same wood disc was also considered when identifying and correcting for double or missing rings following the methodology carried out by Salazar et al. (Reference Salazar, Navarro-Cerrillo, Ancajima, Lazo Duque, Rodrı́guez and Ghezzi2018). Data from radiis of the same sample were averaged to obtain only one time series per cross-section. Ring-width measurement and crossdating were performed using CooRecorder and CDendro 7.8 (2014 – Cybis Elektronik and Data AB). Unfortunately, in most cases, the wood represented trunks and branches of relatively young trees, often younger than 50 years.
All tree-ring series were pre-whitened and bi-weighted to remove variation not related to climatic factors during the standardisation process, to determine correlation between series. To build the site chronology, individual tree-ring width series were the double-detrended, first by fitting a negative exponential curve and then by applying a cubic smoothing spline with a 50% frequency response. The mean and standard deviation (SD) of the raw tree-ring width data were calculated to examine average growth and variability over time. First-order autocorrelation of the double detrended tree-ring width data was computed to determine the level of independence between successive rings. The mean sensitivity of the residual series was calculated to assess year-to-year variability in tree rings. The mean correlation of the common period was determined to demonstrate the consistency of the dendrochronological results. The Gini coefficient was calculated as a measure of variability in tree-ring growth between trees. All statistical analyses were performed using the “dplR” package of R software (Bunn Reference Bunn2008, Reference Bunn2010; R 4.3.2 Development Core Team 2021).
For absolute dating, five tree rings were selected from sample CL9. The samples were separated using a razor knife along the two terminal parenchima boundaries whose ring widths were measured. Alpha-cellulose was extracted from the wood following the protocol of Green (Reference Green and Whistler1963). This method was modified by employing an ultrasonic bath (Pazdur et al. Reference Pazdur, Korput, Fogtman, Szczepanek, Hałas, Krąpiec and Szychowska-Krąpiec2005) and using HCl instead of acetic acid to avoid any potential acetylation (Nemec et al. Reference Nemec, Wacker, Hajdas and Gäggeler2010). Initially, the wood samples were dried, cut into shavings, weighed, and placed into glass tubes. The samples were treated with deionized water, sodium chlorite, and 1% HCl, then subjected to ultrasonic baths at 70°C for one hour (see Figure S2). This procedure, designed to remove lignin, was repeated five times, followed by rinsing with hot deionized water to achieve a neutral pH. The remaining sample, primarily holocellulose, underwent further treatment:
-
1. 10% NaOH treatment: Samples were immersed in a 10% NaOH solution in an ultrasonic bath at 70°C for 45 minutes, followed by rinsing with cold deionized water.
-
2. 17% NaOH treatment: Samples were treated with a 17% NaOH solution at room temperature in an ultrasonic bath for 45 minutes, rinsed with hot deionized water, and adjusted to neutral pH.
After pretreatment, ca. 4 mg of alpha-cellulose extracted from each sample (one ring per trunk) was combusted to CO₂ and subsequently reduced using H₂ to obtain atomic carbon deposited on the surface of Fe powder (Krąpiec et al. Reference Krąpiec, Rakowski, Huels, Wiktorowski and Hamann2018; Wiktorowski et al. Reference Wiktorowski, Krąpiec, Rakowski and Cherkinsky2020). The resulting graphite–iron mixture was then pressed into a target holder for AMS 14C measurements. All prepared targets contained ca. 1 mg of carbon and were measured at the Center for Applied Isotope Studies at the University of Georgia, USA (laboratory code UGAMS; Cherkinsky et al. Reference Cherkinsky, Culp, Dvoracek and Noakes2010). Two different old wood laboratory background materials (Jędrzejowski et al. Reference Jędrzejowski, Michczyńska, Kłusek, Michczyński, Pawełczyk, Piotrowska, Heeb and Hajdas2024; Michczyńska et al. Reference Michczyńska, Krąpiec, Michczyński, Pawlyta, Goslar, Nawrocka, Piotrowska, Szychowska-Krąpiec, Waliszewska and Zborowska2018) and IAEA C3 were used to control the procedure of alpha-cellulose extraction and graphitisation. Additionally, coal (vitrinite – internal standard) samples were used as a radiocarbon blank to monitor the background of the graphitisation system.
Because the wood, initially dated using dendrochronological methods, needed an independent age verification, the wiggle-matching method was applied. Wiggle-matching, together with its underlying mathematical assumptions, is described by Bronk Ramsey et al. (Reference Bronk Ramsey, van der Plicht and Weninger2001). In this study, the wiggle-matching analysis was carried out using OxCal v4.4 (Bronk Ramsey Reference Bronk Ramsey2021) and the calibration curve SHCal20 (Hogg et al. Reference Hogg, Heaton, Hua, Palmer, Turney, Southon and Bayliss2020).
Results and discussion
Dendrochronology
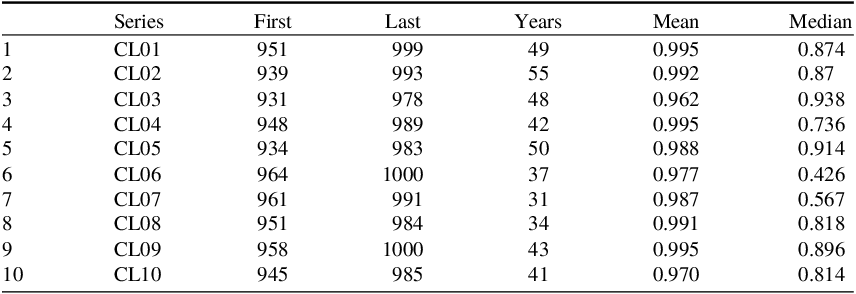
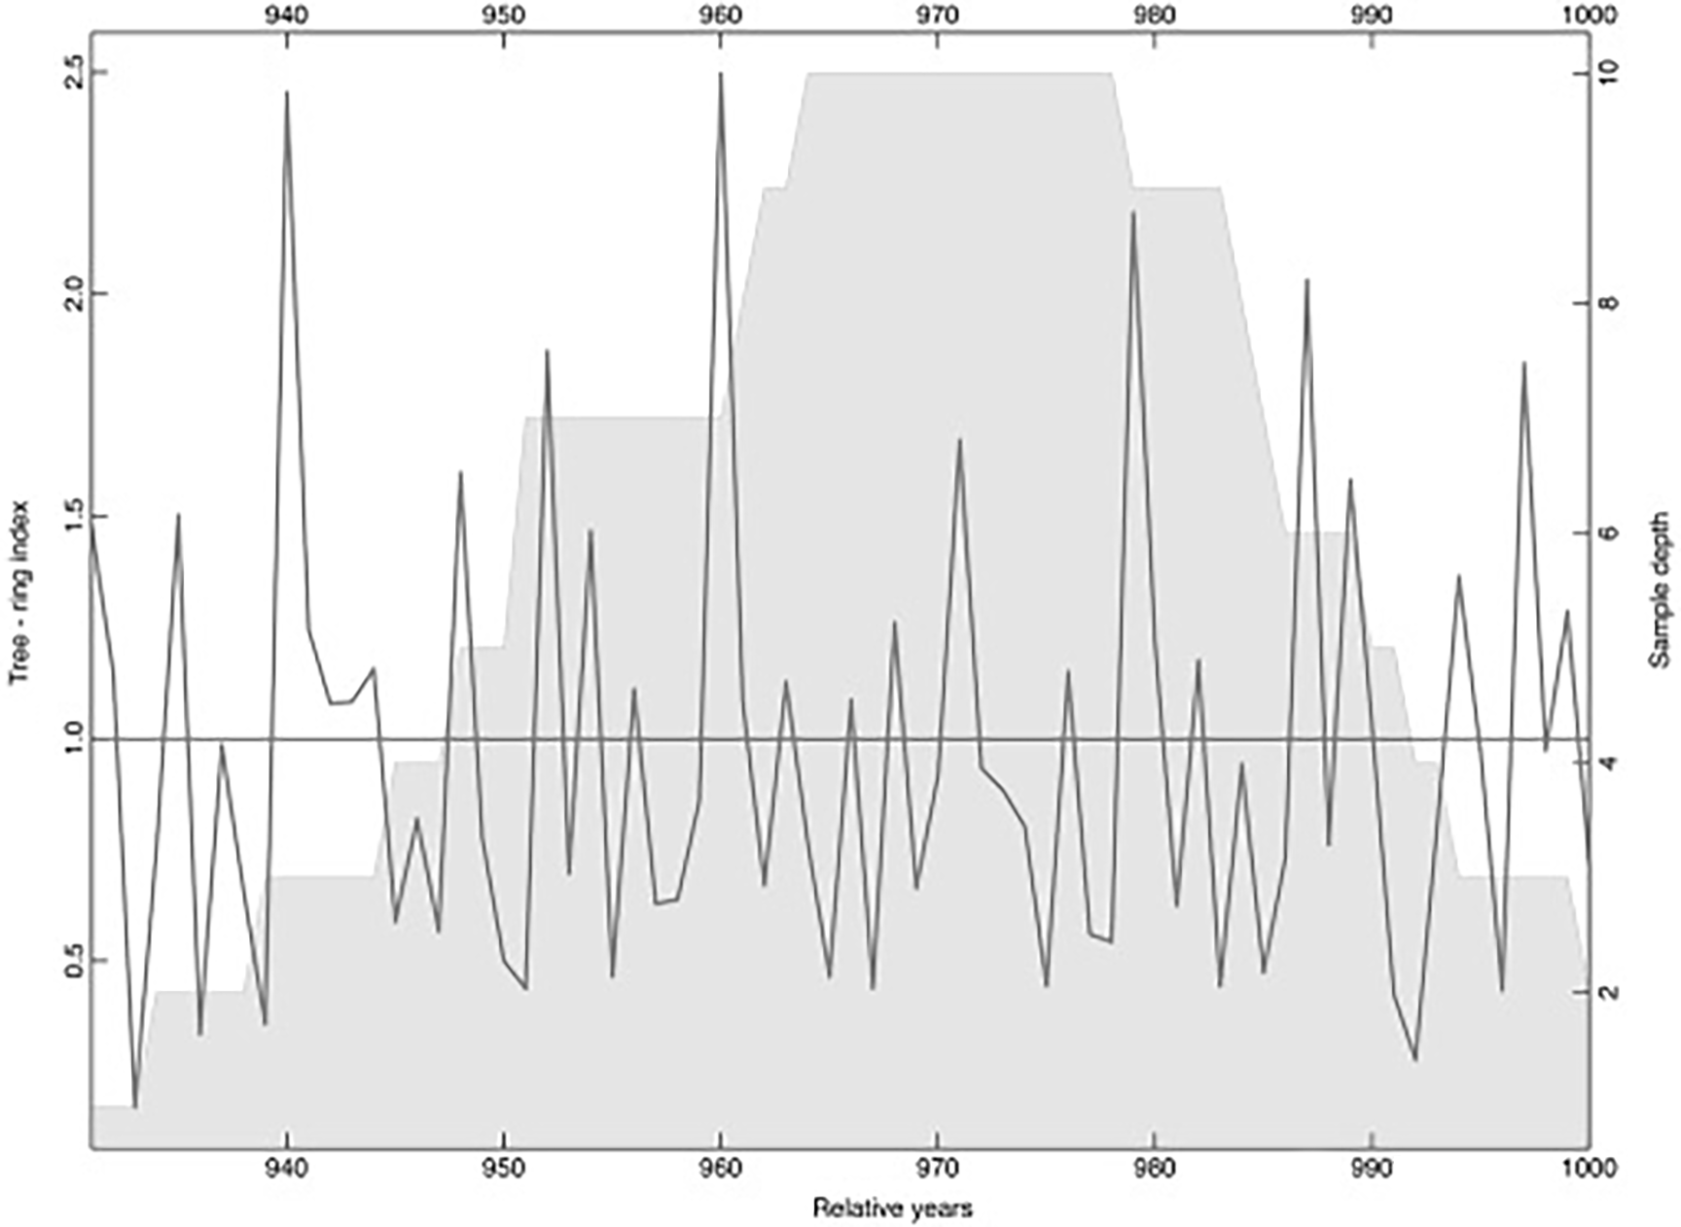
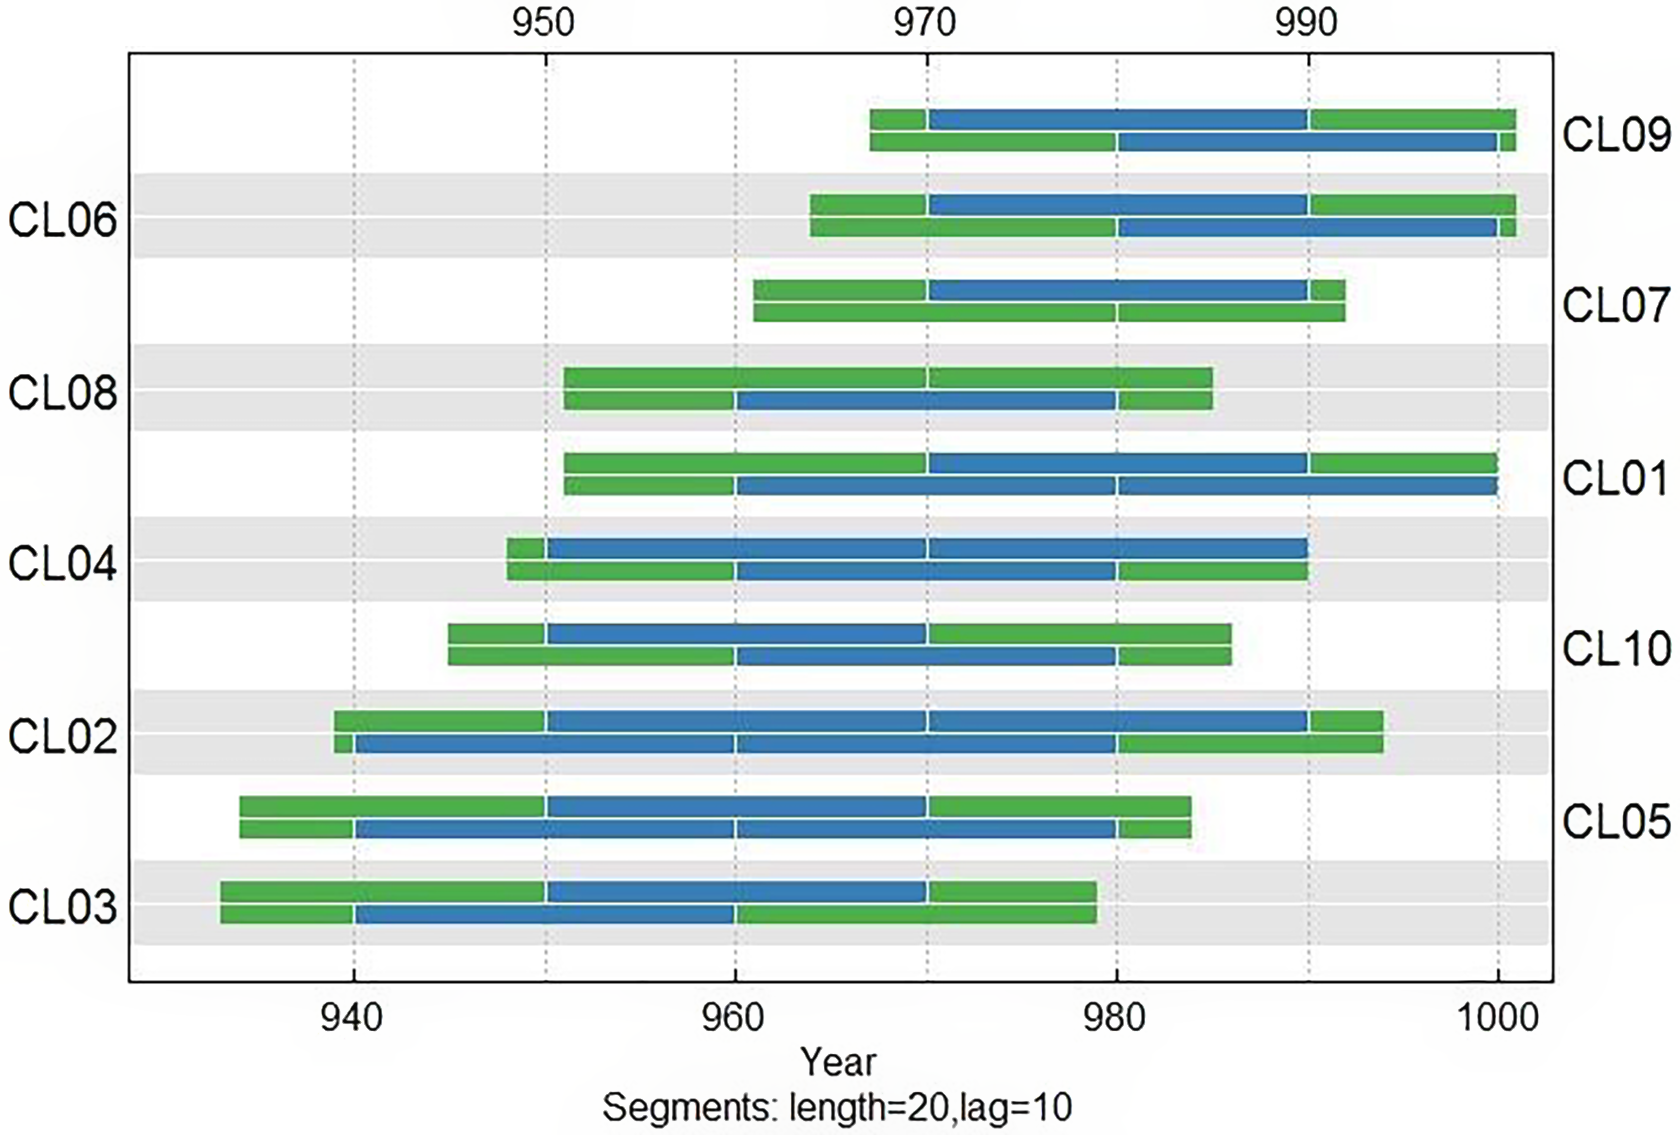
The 10 measured samples contained between 31 and 55 annual increments (Table 2). The mean tree-ring width was 1.32 mm, with a relatively high standard deviation of 1.17 mm. Autocorrelation was low (0.14), the Gini coefficient was 0.37, and the mean sensitivity was 0.8. The mean correlation coefficient between all sequences was 0.63 (Table 1). The chronology CLAA1, constructed from all 10 dendrochronological series, demonstrated a significant cross-correlation coefficient among the samples (Supplementary Material – Table S1). The combined floating chronology spans 70 years in total, with a 61-year section underpinned by at least three sequences (Figure 2). Each sample overlaps by at least 20 years with another sample, and all samples overlap over a common 14 years (Figure 3).
Summary of age ranges of each of the Cerro Laguna samples contributing to the floating chronology of CLAA1. First and last refer to relative years in floating CLAA1 chronology.

Table 2. Long description
The table presents data on 10 series of Cerro Laguna samples, detailing their age ranges within the floating chronology of CLAA1. Each row lists a series identifier, the first and last relative years in the chronology, the number of years measured, the mean tree-ring width, and the median value. The series range from CL01 to CL10, with varying spans of years, means, and medians. Notable observations include series CL02 with the highest number of years at 55 and series CL06 with the lowest at 37. The mean values range from 0.962 to 0.995, and the median values range from 0.426 to 0.938. This detailed data helps in understanding the tree-ring width variations and their statistical measures across different samples.
Mean tree-ring index (black curve) for the Cerro Laguna chronology, highlighting periodic episodes of enhanced tree growth occurring approximately every 5–10 years. The number of samples contributing to the average chronology (maximum of 10) is indicated by the grey-shaded area and the right-hand axis (see Figure 3 for details). The relative year 1000 is the youngest year and has been set as the starting point.

Figure 2. Long description
A line graph displays the mean tree-ring index for the Cerro Laguna chronology over relative years from 940 to 1000. The black curve represents the tree-ring index, which fluctuates between approximately 0.5 and 2.5. The grey-shaded area indicates the number of samples contributing to the average chronology, with a maximum of 10 samples. The right-hand axis shows the sample depth, ranging from 2 to 10. Periodic episodes of enhanced tree growth occur approximately every 5 to 10 years. The relative year 1000 is the youngest year and has been set as the starting point. All values are approximated.
Cross correlation between tree-ring raw data for Cerro Laguna (Casma, Peru) using Pearson coefficient in 20-year length segments starting each decade. Significant correlation (p<0.05) for each segment with the mean tree-ring index is shown in blue color. Green segments are too short (less than 20 years) to be correlated. The horizontal axis displays relative years based on the floating CLAA1 chronology.

Figure 3. Long description
The line graph illustrates the cross correlation between tree-ring raw data for Cerro Laguna in Casma, Peru, using the Pearson coefficient in 20-year length segments starting each decade. Significant correlation (p<0.05) for each segment with the mean tree-ring index is shown in blue color. Green segments are too short (less than 20 years) to be correlated. The horizontal axis displays relative years based on the floating CLAA1 chronology. The vertical axis represents the years ranging from 940 to 1000. The graph includes multiple segments labeled as CL03, CL02, CL05, CL10, CL04, CL01, CL08, CL07, and CL09, each showing varying lengths of correlation. All values are approximated.
Statistical dendrochronological analyses of the Neltuma spp. samples showed promising results for a tropical archaeological context, given their distinctly recognisable ring boundaries (Ferrero et al. Reference Ferrero, Villalba and Rivera2014). Mean tree-ring width was ca. half of other populations found in North Peru. Despite the relatively small number of samples (10 trees), the trees showed large temporal overlap, with the average correlation being higher than in previous studies (Salazar et al. Reference Salazar, Navarro-Cerrillo, Ancajima, Lazo Duque, Rodrı́guez and Ghezzi2018, Bonisegna et al. Reference Boninsegna, Argollo, Aravena, Barichivich, Christie, Ferrero, Lara, Le Quesne, Luckman, Masiokas, Morales, Oliveira, Roig, Srur and Villalba2009). This suggests they grew together in close proximity and were harvested for the construction of the archeological site, which is supported by the low Gini coefficient (Table 1). The high mean sensitivity and low autocorrelation indicate tree growth each year was independent of last year’s growth and was sensitive to environmental disturbance, which minimised the possibility of being irrigated. Our results align with earlier studies of modern populations, particularly in terms of mean sensitivity (0.62), autocorrelation (−0.13), and mean correlation (0.42) (López et al. Reference López, Rodriguez, Gracia and Sabate2006; Rodríguez et al. Reference Rodríguez, Mabres, Luckman, Evans, Masiokas and Ektvedt2005). All in all, the results suggest that even a limited archaeological dataset can capture a dendrochronological signal reflecting climatic information over a short period. The high standard deviation for the ring widths was expected and mirrors the findings of other algaroba studies, where growth is influenced by ENSO (López et al. Reference López, Rodriguez, Gracia and Sabate2006). Recording El Niño and La Niña events can help validate dates in dendrochronological sequences, especially those of shorter duration.
Radiocarbon analysis
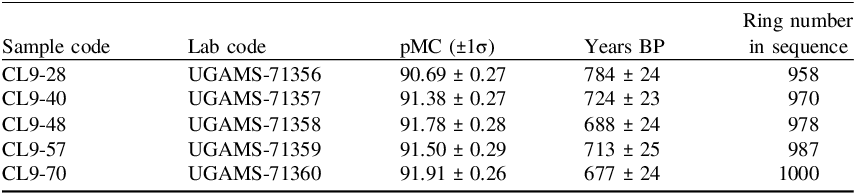
From the CL9 wood sample, five individual increments with suitable width (representing the 28th, 40th, 48th, 57th, and 70th years relative to the chronology) were selected for 14C dating.
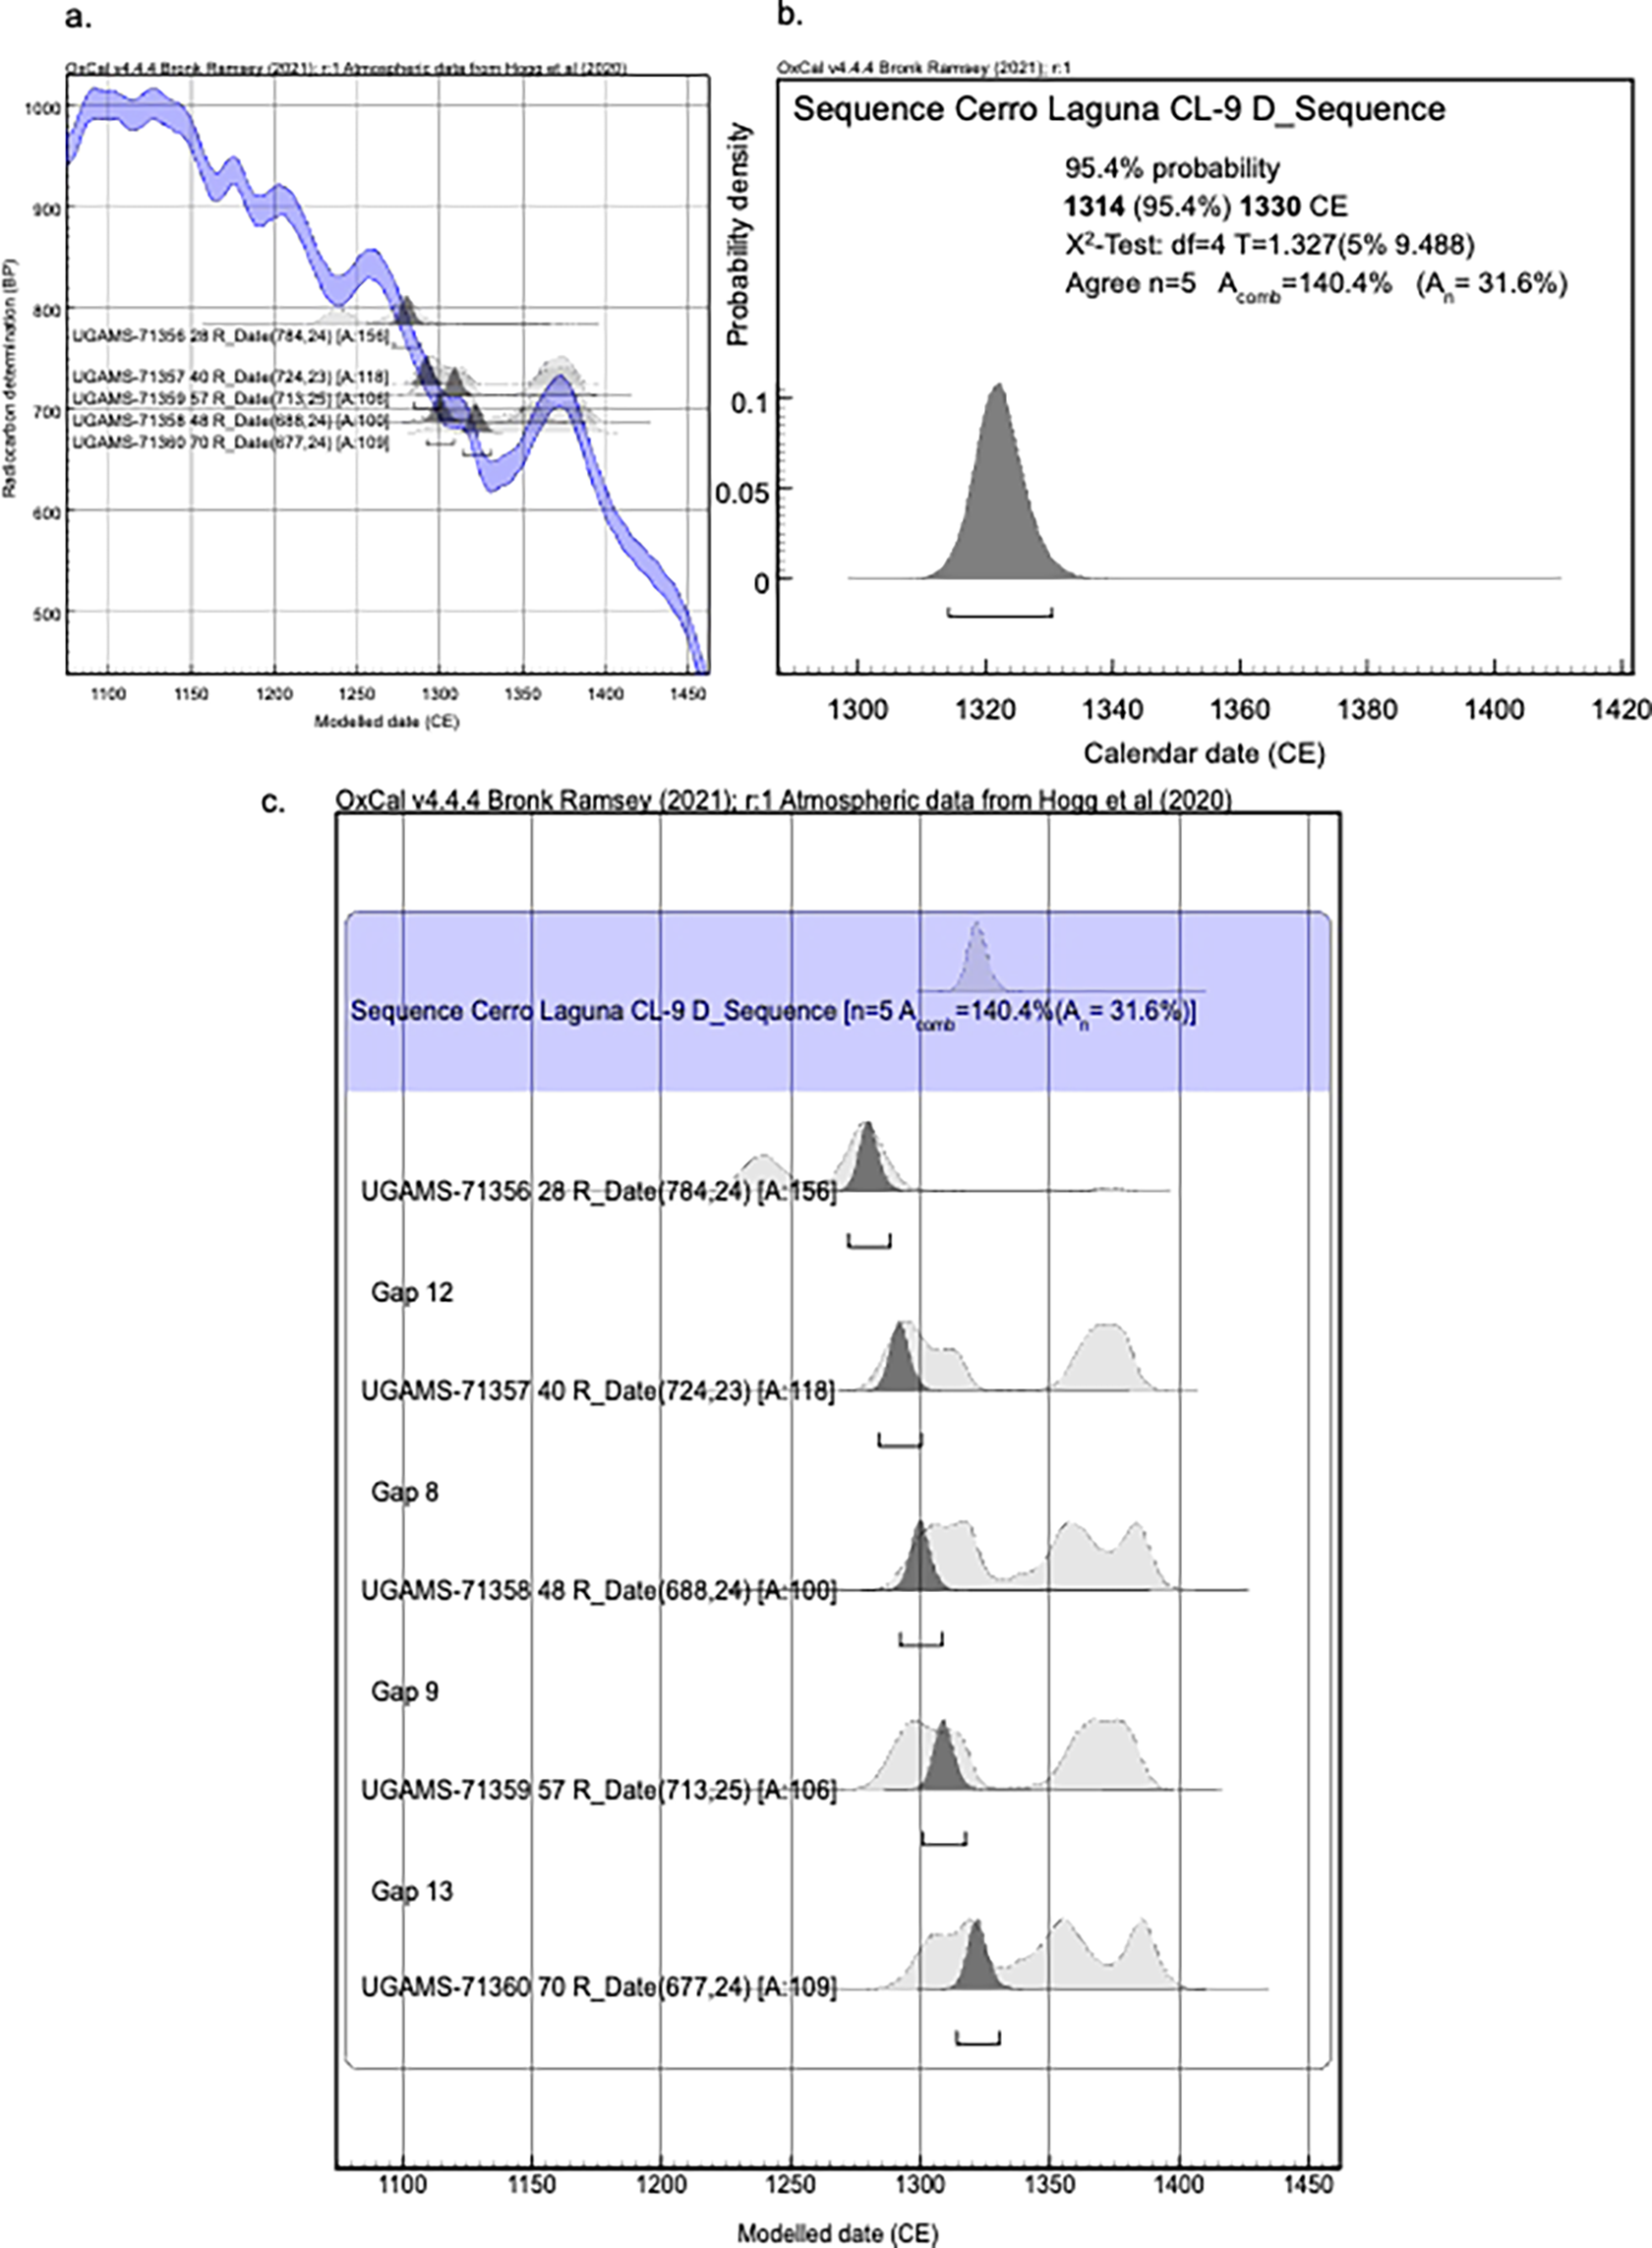
The age determination results, together with their respective uncertainty ranges, are shown in Table 3. The wiggle-matching fit gave an overall sequence agreement index (D_Sequence) of 140.4%, with An = 31.6% (n = 5). Following dependent calibration (Figure 4), 14C results for these five samples in the chronology indicate that the youngest preserved ring dates to 1314–1330 CE, at 95.4% probability.
The list of 24C dates for tree rings from sample CL9.

Table 3. Long description
The table presents radiocarbon dating results for tree rings from sample CL9. It contains five rows and six columns. The columns are labeled Sample code, Lab code, pMC, Years BP, and Ring number in sequence. Each row lists specific data for different samples. For instance, sample CL9-28 has a lab code UGAMS-71356, a pMC value of 90.69 plus or minus 0.27, dated to 784 plus or minus 24 years before present, and is the 958th ring in sequence. Similarly, sample CL9-40 has a lab code UGAMS-71357, a pMC value of 91.38 plus or minus 0.27, dated to 724 plus or minus 23 years before present, and is the 970th ring in sequence. The table provides detailed radiocarbon dating information for each sample, including the associated uncertainties.
Radiocarbon determination for the chronology CLAA1 (see Table 3). a. Wiggle-matching in OxCal v 4.4 (Bronk Ramsey, Reference Bronk Ramsey2021) using SHCal20 (Hogg et al. Reference Hogg, Heaton, Hua, Palmer, Turney, Southon and Bayliss2020) for five single growth rings from sample CL9. b. Probability Density Function (PDF) for the last ring of the sequence. Results place the youngest ring at 1314–1330 CE (95.4% probability), situating the full chronology CLAA1 in the period between 1253 and 1322 (±8) CE. c. Modeled calendar age of each of the annual rings from the sequence. Gap represents the number of annual rings between samples taken for radiocarbon analysis.

Figure 4. Long description
The image contains three graphs related to radiocarbon dating analysis. The first graph (a) is a line graph showing radiocarbon determination for five single growth rings from sample CL9, modeled against calendar dates from 1100 to 1450 CE. The x-axis represents the modeled date in CE, and the y-axis represents the radiocarbon determination in Bq. The second graph (b) is a probability density function (PDF) histogram for the last ring of the sequence, indicating a 95.4 percentage probability that the youngest ring dates to 1314 to 1330 CE. The x-axis shows the calendar date in CE, and the y-axis shows the probability density. The third graph (c) displays the modeled calendar age of each annual ring from the sequence, with gaps representing the number of annual rings between samples taken for radiocarbon analysis. The x-axis represents the modeled date in CE, and the y-axis shows the probability density. The combined analysis situates the full chronology CLAA1 between 1253 and 1322 CE, with an uncertainty of plus or minus 8 years. All values are approximated.
Implications
This finding suggests that the CLAA1 sequence covers the period 1253–1322 (±8) CE, thereby confirming Cerro Laguna’s designation within the Late Intermediate Period. Importantly, it may also facilitate the improvement of the radiocarbon calibration curve with annual resolution for this region. This is particularly relevant for the Southern Hemisphere, where calibration curves still contain uncertainties due to limited data, and the findings here could help refine those curves. The SH radiocarbon calibration curve (SHCal20) was constructed mainly based on data from Australia, New Zealand, and southern Chile (Hogg et al. Reference Hogg, Heaton, Hua, Palmer, Turney, Southon and Bayliss2020), which may not accurately represent atmospheric 14C in central South America.
The presence of pronounced El Niño events suggests that the Cerro Laguna site was established around 1300 CE, coinciding with climatic shifts in the Pacific region noted in the study of Delle Rose (Reference Delle Rose2022). At least four El Niño events are recognisable across the Cerro Laguna sequences due to a significant (2.5-fold) increase in tree-ring width relative to normal years. This points to a notably dry period, with low rainfall occurring between El Niño events, which may explain the relatively narrow mean tree-ring widths.
The successful anchoring of this tropical tree-ring floating chronology highlights the importance of employing a multi-step approach, integrating classic dendrochronology, statistical analysis, ENSO signature evaluation, and 14C data. Such a comprehensive methodology can significantly enhance the robustness of tropical dendrochronological reconstructions. Furthermore, as additional 14C analyses are still pending, verification of the correlation between all cross-sections remains essential before finalizing the chronology. It seems that a combination of all those methods should be adopted as the standard in such studies using a multidisciplinary strategy that ensures continuous verification to increase the reliability of tropical tree-ring chronologies for climate and environmental reconstruction.
Conclusions
Constructing the CLAA1 chronology for the Cerro Laguna site, spanning 1253–1322 CE, confirms its affiliation with the Late Intermediate Period, strengthening the historical narrative of the region. Despite a relatively small sample size (10 trees), Neltuma spp. provided robust dendrochronological signals, indicating that these trees can reliably reflect climatic variations. The identified ENSO events and associated climate conditions shed light on how ancient communities at Cerro Laguna may have responded to environmental stresses, highlighting the interplay between climate variability and human development. The findings encourage expanded dendrochronological studies using a wider array of species and sites in the region, enabling further exploration of past climate fluctuations and their implications for historical societies. These conclusions underscore the crucial importance of dendrochronological methods in reconstructing historical climatic conditions and explaining their influence on the development of civilizations. The mean sensitivity and autocorrelation values comparable to previous research underscore this method’s validity in tropical archaeological settings. Significant increases in tree-ring width may be related to strong El Niño events around 1300 CE. These results can be used to develop a dating method based on changes in tree-ring width during El Niño phenomenon. The radiocarbon results obtained point to the way to an improved radiocarbon calibration curve with annual and multi-decadal resolution for the Southern Hemisphere, filling the gap resulting from the lack of data from this region. This is particularly important for developing chronologies for pre-Columbian cultures using radiocarbon dating.
Supplementary material
To view supplementary material for this article, please visit https://doi.org/10.1017/RDC.2026.10231
Acknowledgments
This work was partly supported by the National Science Centre, Poland, grant UMO-2022/45/B/ST10/02095 and the Nagoya University ISEE – International Joint Research Program-20803. It was also partially funded by AGH University of Kraków through subsidy no. 16.16.140.315.