NOMENCLATURE
- a i, j
-
weighting factor of OF
- ETA
-
isentropic efficiency
- ETAa
-
elliptical coefficient for the semi-major axis
- ETAb
-
elliptical coefficient for the semi-minor axis
- ETAb1-3
-
efficiency sub-coefficients
- ff
-
engine fuel flow (kg/s)
- k
-
number of measureable parameters
- l
-
number of operating points
- N
-
compressor shaft speed
- OF
-
objective function
- p
-
performance parameter vector
- p M i, j
-
measurable parameters
- p i, j
-
predicted parameters
- P
-
total pressure (atm)
- PR
-
pressure ratio
- PR1-2
-
pressure ratio sub-coefficient
- PRb
-
elliptical coefficient for pressure ratio
- T
-
total temperature (K)
- u
-
ambient and operating condition vector
- UW
-
power output (W)
- x
-
independent component characteristics vector
- WAC
-
corrected mass flow rate
- W
-
mass flow rate (kg/s)/elliptical coefficient
- WAC a
-
mass flow rate
- W 1-2
-
mass flow sub-coefficient
- η
-
efficiency
- 1–8
-
engine stations (see Fig. 8),
- amb
-
ambient
- DP
-
design point
- g
-
exhaust gas
- s
-
surge
- SM
-
surge margin
- th
-
thermal
Greek
Subscripts
1.0 INTRODUCTION
The continuously stringent environmental regulations imposed on the gas turbines for propulsion and power applications, along with the competitive market environment, has triggered diverse challenges. One of these challenges is the development of multi-fidelity, accurate and reliable engine performance models which leads towards a better understanding of the behaviour of these highly non-linear and complex machines. A successful operation and maintenance strategy for gas turbine assets depends on the informed decisions that gas turbine operators make according to the available information from condition monitoring, diagnostic and prognostic tools. An example of the impact that the engine models may have on the implementation of these decision making tools can be found in the General Electric's latest Digital Twin technology(1). One of the engaging tasks of the gas turbine community is the continuous development of engine modelling techniques(Reference Volponi2-Reference Frederick, DeCastro and Litt6) for improving the accuracy of performance simulation(Reference Tsoutsanis, Meskin, Benammar and Khorasani7-Reference Stamatis, Mathioudakis and Papailiou9), diagnostics(Reference Li10,Reference Li and Singh11) and prognostics(Reference Li and Nilkitsaranont12-Reference Tsoutsanis and Meskin14).
Gas turbines have to operate at any point between idle and full power at various ambient, altitudes and/or flight conditions. The off-design performance behaviour of each gas turbine engine is determined by the behaviour of its key gas path components represented by their “characteristic maps”. These maps represent the interrelationships among the component performance parameters such as pressure ratio, air mass flow rate, isentropic efficiency and shaft rotational speed. The characteristic maps may be obtained from a long and expensive development effort by original equipment manufacturers and remain, apart from a few examples in the literature, proprietary information.
Given the proprietary nature of the compressor maps and their emphasised importance in engine performance estimation, the gas turbine research community has addressed this limitation by utilising generic component maps and then tuning and scaling the maps in order to match the actual engine performance obtained from engine tests. In recent years, the topic of inverse modelling with experimental data has generated much attention(Reference Hayes, Dwight and Marques15,Reference Kennedy and O'Hagan16) for several scientific disciplines because it enables a fast and accurate representation of a system's behaviour for a wide range of operating conditions and applications.
One of the most common inverse mathematical modelling processes for estimating the gas turbine performance is the multiple point performance adaptation. This process may involve adaptation of an engine model in order to match simultaneously a set of measurements taken from a service engine at off-design conditions. Stamatis et al(Reference Stamatis, Mathioudakis and Papailiou9) introduced such a method of adapting an engine model through an optimal set of scaling factors applied to the compressor map after an optimisation process. The work of Kong and Ki(Reference Kong, Ki and Kang17) suggested a scaling method based on system identification and later on a compressor map generation method through a Genetic Algorithm (GA)(Reference Kong, Kho and Ki18). Lo Gatto et al(Reference Lo Gatto, Li and Pilidis19) used a GA method to search for an optimal set of scaling factors based on rig test data at a single off-design point. This method was further developed by Wang et al(Reference Wang, Li, Huang and Feng20) and Li et al(Reference Li, Marinai, Lo Gatto, Pachidis and Pilidis21) by seeking an optimal set of scaling factors to compromise the accuracy of multiple off-design point test data. Recently, Li et al(Reference Li, Abdul Ghafir, Wang, Singh, Huang and Feng22,Reference Li, Abdul Ghafir, Wang, Singh, Huang, Feng and Zhang23) proposed a variable scaling factors for multiple off-design operating points in order to perform a non-linear multiple point adaptation.
In contrast to the existing scaling techniques(Reference Stamatis, Mathioudakis and Papailiou9,Reference Kong, Ki and Kang17-Reference Yang, Li and Cao24) this paper proposes a non-linear compressor map modelling and generation method based on engine off-design test data. The compressor map generation procedure is analytical and can therefore capture non-linear distribution of speed lines and efficiency contours. This method is then integrated into an engine model and a GA-based performance adaptation system for multiple off-design performance simulation. It should be noted that both the compressor map generation method and the inverse modelling optimisation process have integrated into the PYTHIA gas turbine software platform, which has been utilised by Manx Utilities for improved condition-based maintenance of a combined cycle power plant. Two test cases are conducted for an aero derivative industrial gas turbine engine to demonstrate the capability of the proposed method, in comparison with an earlier adaptation approach(Reference Lo Gatto, Li and Pilidis19), in the estimation of off-design performance of the engine.
2.0 METHODOLOGY
2.1 Map representation
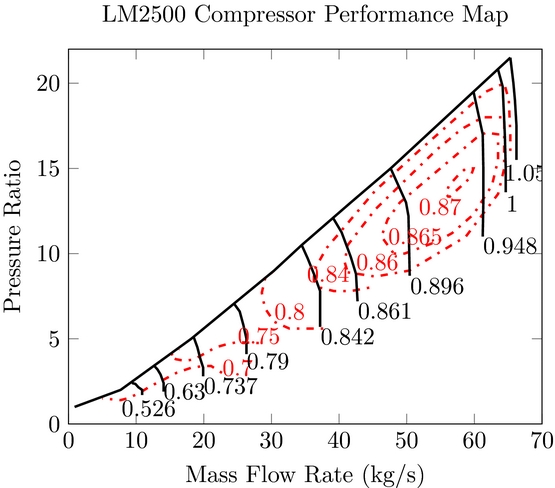
The first step of the methodology involves the development of a mathematical model to present a compressor characteristic map. Among a limited number of compressor maps available in the literature, the characteristic map of GE's LM2500 gas turbine(Reference Klapproth, Miller and Parker25) is taken as an example for this analysis. This map has been digitised and reproduced as seen in Fig. 1. The input ambient operating conditions of this compressor map refer to ISA conditions of T a = 288.15 K and P a = 101.325 kPa.
Compressor Map of GE LM2500 as reproduced from Ref. Reference Klapproth, Miller and Parker25.

The form of the compressor map shown in Fig. 1 graphically represents the interrelationships of all component characteristic parameters, namely mass flow rate WAC, pressure ratio PR, isentropic efficiency ETA and referred shaft rotational speed N. In order to facilitate the interpretation of such compressor characteristics by an engine simulation program, two separate maps may be presented: one for PR-WAC relationship and the other for ETA-WAC relationship. Normally, such compressor characteristics may be represented in either a graph or a table. To represent compressor maps in a more generic form for the purpose of performance adaptation, a new method is introduced as follows.
It is assumed that the compressor map speed lines are segments of a set of ellipses
 $$\begin{equation}
{\left( {\frac{{x - {x_c}}}{a}} \right)^2} + {\left( {\frac{{y - {y_c}}}{b}} \right)^2} = 1,
\end{equation}$$
where (xc , yc ) are the coordinates of the centre of the ellipse. In case of the PR-WAC map it may be assumed that the centre of the ellipse is fixed at the origin (0, 0). Therefore, Equation (1) becomes
 $$\begin{equation}
{\left( {\frac{{WAC}}{{WA{C_a}}}} \right)^2} + {\left( {\frac{{PR}}{{P{R_b}}}} \right)^2} = 1,
\end{equation}$$
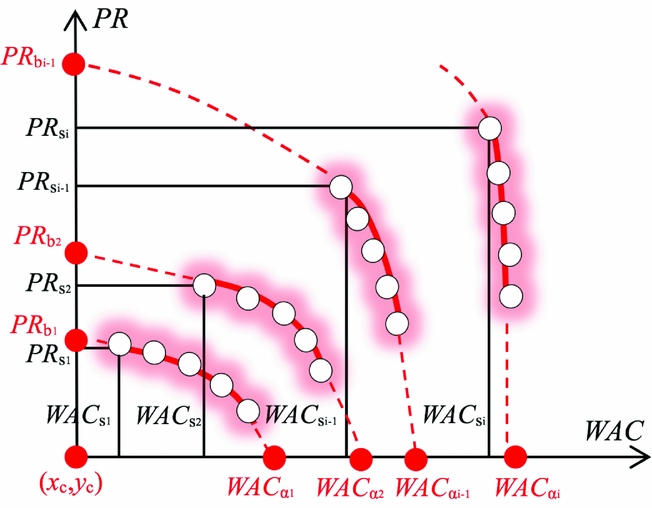
where WACa and PRb denote the semi-major and semi-minor axes of the ellipse. These coefficients correspond to the points at which each curve meets the x and y axis when PR = 0 and WAC = 0, respectively.
A similar fitting approach has been employed for the second form of the compressor map, which represents the relationship between mass flow and isentropic efficiency. As before, it is assumed that each efficiency line belongs to an elliptic curve, with its centre fixed at (x c, 0), which is given by
 $$\begin{equation}
{\left( {\frac{{WAC - {x_c}}}{{ET{A_a}}}} \right)^2} + {\left( {\frac{{ETA}}{{ET{A_b}}}} \right)^2} = 1
\end{equation}$$
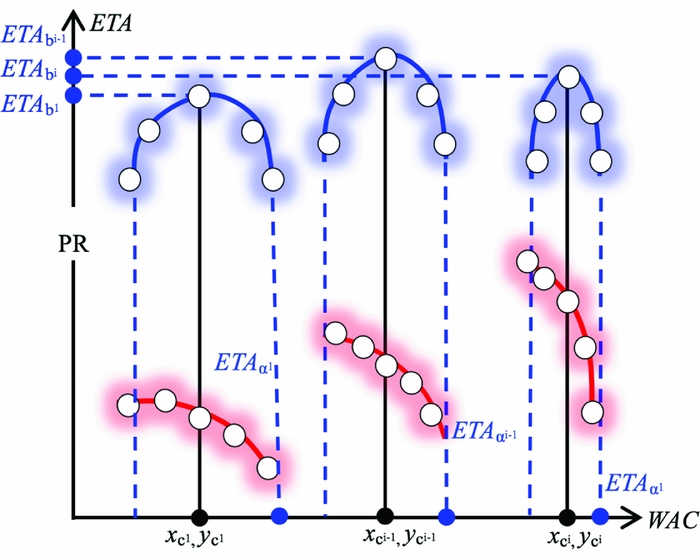
The only difference in our approach for this form of the map is the fact that the coordinate of the ellipse's centre in x axis (x c) is assumed to coincide with the mid-point of air mass flow range for each line of constant speed, as shown in Fig. 3. The range of the mass flow rate is known from the PR-WAC map; hence, the only unknown parameter that needs to be determined is the coefficient ETA b.
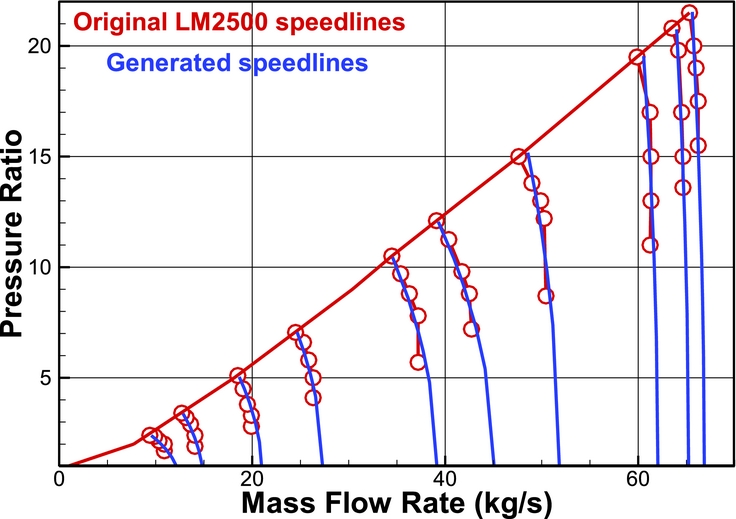
The proposed mathematical representation method has been tested for fitting the characteristic map of GE's LM2500, and the resulted map for the PR-WAC relationship is shown in Fig. 4. Taking into account that 50 operating points have been selected for fitting each map the mean prediction error for the PR-WAC and the ETA-WAC maps is 0.2% and 0.1%, respectively.
2.2 Map generation
The second step of the methodology deals with the mathematical analysis of the proposed elliptical coefficients and more specifically their variation with respect to the rotational speed N. This analysis is carried out in order to establish the mathematical relationships for controlling and generating the compressor map shape. Starting off with the PR-WAC map, the coefficient WAC a may be expressed as an exponential function of relative shaft speed
 $$\begin{equation}
WA{C_a} = WA{C_{DP}} \cdot {W_1} \cdot {N^{{W_2}}},
\end{equation}$$
where W 1 and W 2 are the sub-coefficients of this exponential function and WAC DP denotes the mass flow rate at design point conditions.
The elliptical coefficient PR b may be similarly expressed by an exponential function of relative shaft speed
 $$\begin{equation}
P{R_b} = P{R_{DP}} \cdot P{R_1} \cdot {N^{P{R_2}}},
\end{equation}$$
where PR 1 and PR 2 are the sub-coefficients of the equation and PR DP denotes the design point pressure ratio.
The parameter PR s, schematically illustrated in Fig. 2, denotes the pressure ratio at the surge point of a speed line. Assuming a reasonable surge margin (SM) of 20% (i.e., SM = 0.2), then PR s can be determined as
 $$\begin{equation}
P{R_s} = P{R_{DP}}\left( {SM + 1} \right)
\end{equation}$$
Schematic representation of the speed lines using elliptic curves.

The mass flow rate corresponding to the surge point of the same speed line can be determined by the elliptical equation
 $$\begin{equation}
WA{C_s} = \sqrt {WAC{a^2} \cdot \left[ {1 - {{\left( {P{R_s}/PRb} \right)}^2}} \right]}
\end{equation}$$
The sub-coefficients W 1, W 2, PR 1 and PR 2 determine the pressure ratio and mass flow rate within the specified range of 50% up to 115% of compressor relative shaft speed N. A similar procedure has been followed for the map that represents the ETA-WAC relationship. For this form of the map, it was assumed that the isentropic efficiency can be accurately approximated by a quadratic function as
 $$\begin{equation}
ETAb = ET{A_{DP}}\left( {ET{A_{{b_1}}} \cdot {N^2} + ET{A_{{b_2}}} \cdot N + ET{A_{{b_3}}}} \right),
\end{equation}$$
where ETAb 1, ETAb 2 and ETAb 3 are the sub-coefficients of the equation and ETA DP denotes the design point isentropic efficiency. This is because the contour of ETA b represents the peak efficiency of different speed lines on the ETA-WAC graph shown in Fig. 3 and the distribution of the peak efficiency curve is close to a quadratic curve.
Schematic representation of the efficiency map generation by elliptic function.

Original speed lines of LM2500 compressor map vs. generated speed lines.

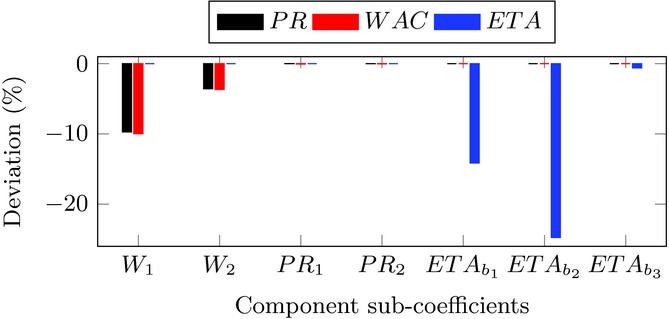
To evaluate the impact of each sub-coefficient, a sensitivity analysis is performed. This sensitivity analysis examines the effect that a –10% drop of each sub-coefficient has on the pressure ratio, the mass flow rate and the isentropic efficiency of the compressor. As shown in Fig. 5, the pressure ratio has an increased sensitivity to sub-coefficients PR 1 and PR 2. A sensitivity of similar magnitude is also noticed for the mass flow rate to the sub-coefficients W 1, W 2. Finally, the isentropic efficiency is solely affected by the sub-coefficients ETAb 1, ETAb 2 and ETAb 3. It is also worth noting that a 10% drop in ETAb 2 leads to –25% deviation in efficiency, a fact that emphasises the amplified influence that this sub-coefficient has. It follows that the efficiency depends very much on ETAb 2 which shows that the relationship is mainly linear and to a second degree non-linear (ETAb 2). The sensitivity analysis can serve as a guide for setting the upper and lower bounds of these sub-coefficients when these are used for a constrained optimal coefficient searching process.
The deviation of component map parameters PR, WAC and ETA corresponding to a –10% drop of each sub-coefficient.

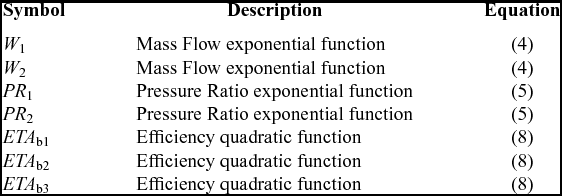
The total number of sub-coefficients for this analysis is seven, as summarised in Table 1. Tuning these sub-coefficients through an optimisation algorithm allows the modification of the generated compressor map in a non-linear fashion. As a result, an engine model could be adapted to real engine off-design performance by modifying the compressor maps using engine test data.
Compressor map sub-coefficients

2.3 Performance adaptation
Performance adaptation is an inverse mathematical process with the objective of tuning/adapting an engine model so as to match the observable measurements of an engine. Generally, the measurable engine performance parameters are gas path measurements such as temperatures and pressures represented by a vector p. The measurable engine performance parameters are a function of ambient and operating condition parameters represented by a vector u (P amb, T amb, “handle”) and the component characteristics represented by a vector x as follows:
 $$\begin{equation}
{{\bf p}} = f\left( {{{\bf x}},{{\bf u}}} \right)
\end{equation}$$
Note that the “handle” parameter refers to the control parameter of the engine which might be shaft rotational speed, shaft power output, turbine entry temperature or any other quantity. The “handle” is an input to the engine model and determines the power level of the engine.
Now the objective of the performance adaptation is to modify the component characteristics vector x in order to match the measurable gas path parameters vector p at off-design operating conditions. To assess the accuracy of the adaptation, the difference between the predicted measurements p by the engine model, and the observed measurements of the engine pm is evaluated by an Objective Function (OF)
 $$\begin{equation}
OF = \mathop \sum \limits_{j = 1}^l \mathop \sum \limits_{i = 1}^k \left| {\frac{{{p_{i,j}} - {p_{{M_{i,j}}}}}}{{{p_{{M_{i,j}}}}}}} \right| \cdot 100,
\end{equation}$$
where p M i, j are the values of the observed measurements, and p i, j are the corresponding predicted measurements. The parameter k denotes the total number of measurable parameters, and l the number of off-design operating points used in the adaptation process.
2.4 GA optimisation
For the minimisation problem of the objective function a GA optimiser is developed and implemented. GA is an adaptive heuristic search algorithm based on the evolutionary needs of natural selection and genetics(Reference Li, Marinai, Lo Gatto, Pachidis and Pilidis21,Reference Goldberg26) . The GA initially generates a population of a large number of possible solutions, called strings, of the compressor map's sub-coefficients over a specified range. It then calls the performance simulation module in PYTHIA software to predict the off-design performance in order to calculate the fitness of the strings within the population.
 $$\begin{equation}
GA{\rm{\ Fitness}} = \frac{1}{{1 + OF}}
\end{equation}$$
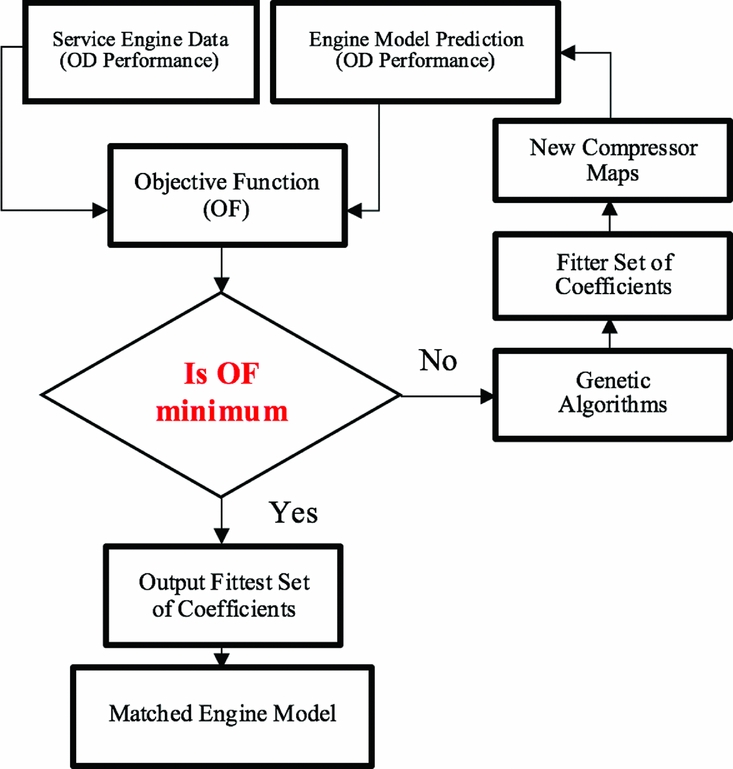
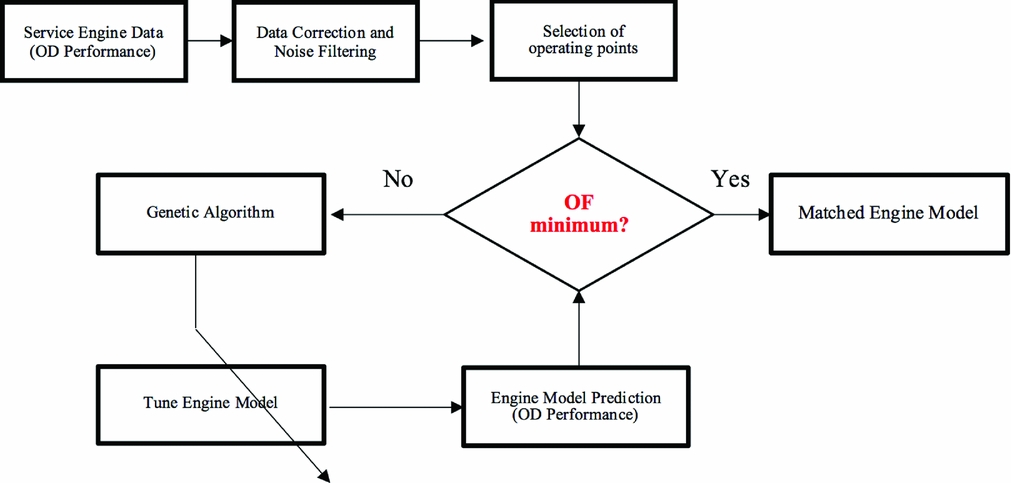
Crossovers and mutations may be used to generate extra strings to replace worse strings in the population in order to improve the average fitness of the whole population. Such a process of GA search is repeated until the specified maximum number of generations has been reached. Then the best string of the whole population, i.e. the best set of compressor map sub-coefficients with the highest fitness is selected as the solution of the performance adaptation. The quality of each set of sub-coefficients within the population is assessed by the fitness criterion of Equation (11). A value of fitness approaching 1 indicates a good set while a value approaching 0 represents a poor set. The flow chart of such an adaptation process is shown in Fig. 6. The result of this process is an updated and more accurate engine model that can be used for future diagnostic analysis of the engine. It should be noted that the turbine map has not been utilised for this adaptation process due to the fact that the turbine is operating at choking conditions for a wide operating range. Moreover, the variation of turbine pressure ratio with respect to the corrected mass flow rate can be approximated by a horizontal line.
The flow chart of the proposed adaptation method.

3.0 APPLICATION, RESULTS AND DISCUSSIONS
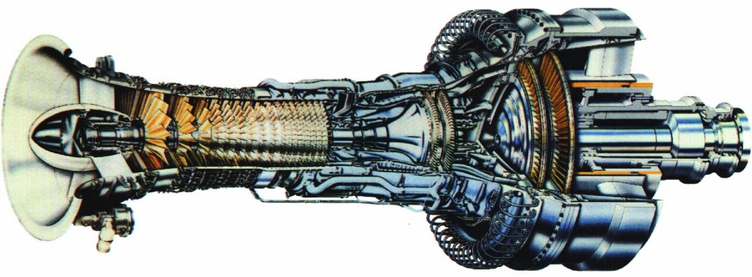
The accuracy of the proposed method has been tested for a GE LM2500+ aero derivative gas turbine engine, shown in Fig. 7, that operates in Manx Utilities’ (MU) combined cycle power plant in the Isle of Man, UK.
LM2500+gas turbine, courtesy of GE ©.

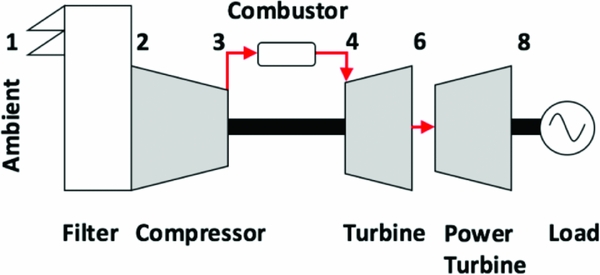
The GE LM2500+ engine, which is a derivative of GE's CF6 jet engine core, is used for land and marine power applications. It has a 17-stage compressor(Reference Wadia, Wolf and Haaser27), with the first seven stages having variable stator vanes. The engine is also configured with a single annular combustor, a two-stage high-pressure turbine and a two-stage free-power turbine of Nuovo Pignone. The layout of the developed engine model is shown in Fig. 8. The bleed flow at the discharge of the compressor is used for cooling the high-pressure turbine.
Engine model layout configuration.

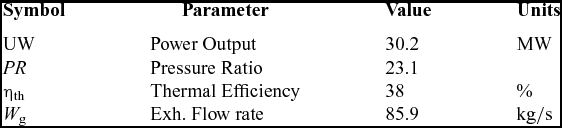
The design point performance specification of the GE LM2500+ engine is summarised in Table 2 (28).
LM2500+ISA performance specification(28)

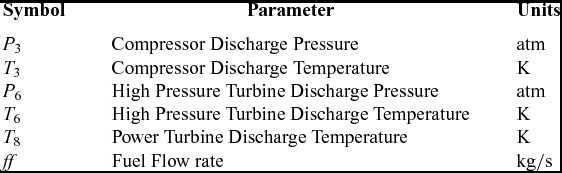
The engine model input and the measurable parameters for the off-design performance adaptation are summarised in Tables 3 and 4, respectively. The power output is set as the handle/control parameter of the engine.
Engine model input parameters

Engine measurable performance parameters

A design point performance adaptation(Reference Li, Pilidis and Newby29) for the model at 30 MW is carried out in order to match the available design point performance of the engine. Once the engine model has been properly updated for the selected design point, an initial compressor map is generated. Then the off-design performance adaptation as described in the following test cases is applied to modify the initial compressor map in a non-linear way so as to match multiple off-design measurable parameters while keeping the same design point.
Two test cases have been carried out to test the effectiveness of the developed methods and system. The objective of the first test case is to match a set of “deck data” that are measurements generated by an engine model, which uses a default compressor map shape. The power output is reduced from 30 MW to 27 MW at incremental steps of –0.5 to –1.0 MW. The accuracy of the proposed adaptation is tested by generating and tuning a compressor map through the GA optimiser in order to match the “deck data”.
The objective of the second test case is to examine the performance of the proposed method for real service engine measurements that are designated as “test data” and obtained from the LM2500+ engine operating in the MU's combined cycle power plant. The earlier linear scaling adaptation technique developed by Li(Reference Lo Gatto, Li and Pilidis19) and the proposed map generation adaptation are employed for this test case and are going to be referred to as “earlier” and “new” adaptation methods, respectively. For both methods the engine model configuration was the same. A summary of the adaptation test cases is presented in the Table 5.
Adaptation test case parameters

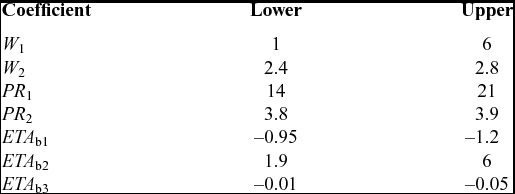
Initially the upper and lower bounds for the sub-coefficients W 1, W 2, PR 1, PR 2, ETA b1, ETA b2 and ETA b3 were adjusted several times during the trial adaptation process to find appropriate searching domains for the sub-coefficients. During this initial phase, a default map shape available from PYTHIA software has been used for testing the validity of the proposed method. This testing phase enabled the selection of the upper and lower bounds of the sub-coefficients, which were identical for both test cases. The final bounds used for the adaptation are shown in Table 6.
Upper and lower bounds for sub-coefficients

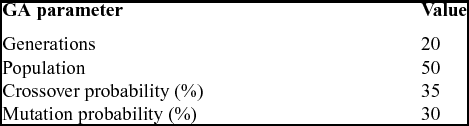
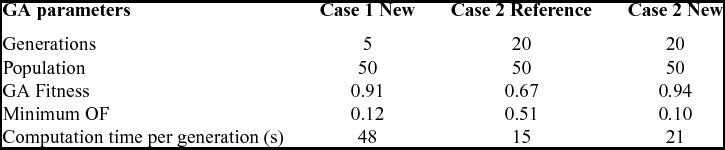
The GA parameters for this study are shown in Table 7, where 20 GA generations with a population size of 50 were used. The probabilities of crossover and mutation are 0.35 and 0.3, respectively. Normally the mutation rate ranges from 10% to 20% for providing a good balance between the searching space and the convergence of the optimiser. However, in this study the mutation rate selected is intentionally higher at 30% in order to provide additional searching space to the algorithm since the upper and lower bounds for W 1, PR 1 and ETA b2 is wide. Once convergence is accomplished, one may reduce the mutation probability, limit the range of the two sub-coefficients and rerun the optimiser in order to improve the prediction accuracy of the engine model.
GA parameters

3.1 Test Case 1
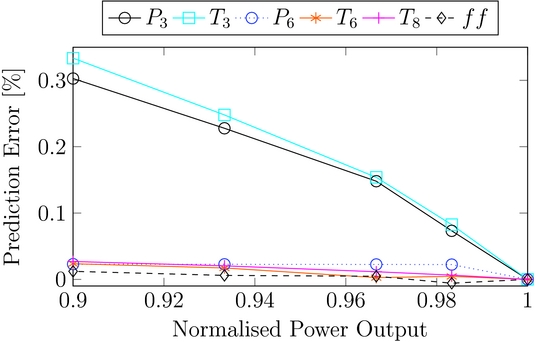
The results of the off-design performance adaptation in this test case are shown in Fig. 9, illustrating that all the selected gas path measurements are matched very well with an accuracy spanning from –0.01 % up to 0.33 for the entire range of power output in concern. The measurements corresponding to the compressor exit namely P 3 and T 3 are the ones that present the lowest prediction accuracy compared to the other measurements. The reason for this is due to the fact that both computed measurements rely heavily on the generated shape of the compressor map. For high-pressure ratio compressors, the curves in the high-speed region of the map (i.e., close to 100% referred speed N) are quite steep and almost vertical. This characteristic limits the searching space of the GA optimiser and, therefore, the interpolation capability of the proposed elliptical method. However, it should be noted that the general trend of the adaptation process is characterised by prediction of high accuracy.
Prediction error for the selected parameters at different power output.

3.2 Test Case 2
In the second test case, a set of “test data” from MU's power plant is used. A series of tests have been performed in MU's power plant to obtain off-design steady-state data for one of the gas turbines.
One of these tests involved the shutdown of the engine for a prolonged period of 3 hours at specified power increments. For this test, the engine was allowed sufficient time to stabilise at each power setting in order to examine its steady-state behaviour at off-design conditions.
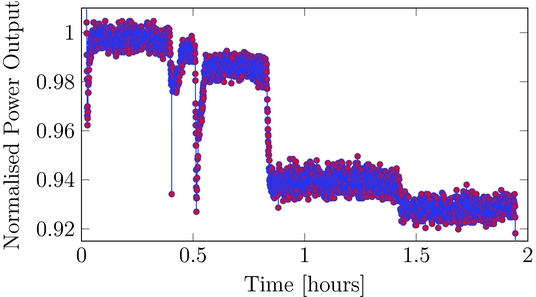
A sample of this “test data” selected for the adaptation can be seen in Fig. 10. Data correction and reduction techniques have been employed in order to select the appropriate set of operating points for this multiple-point adaptation application, which is schematically represented in Fig. 11. The above process has been facilitated by the large amount of data available from the engine test. Specifically, since the engine had sufficient time to stabilise at each power setting the operating points corresponding to the final stages of each setting have been selected. It follows that the operating points of the engine before changing the power demand represent the most suitable and representative samples of data for steady-state off-design performance.
Data samples representing the MU's LM2500+off-design performance for test case 2.

Schematic representation of the proposed adaptation process for test case 2.

Averaged measurement samples at several stabilised power levels are used for the off-design performance adaptation.
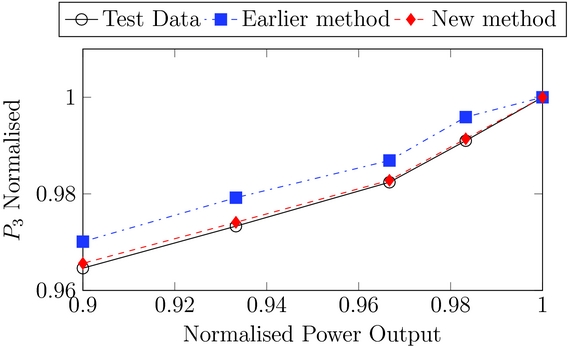
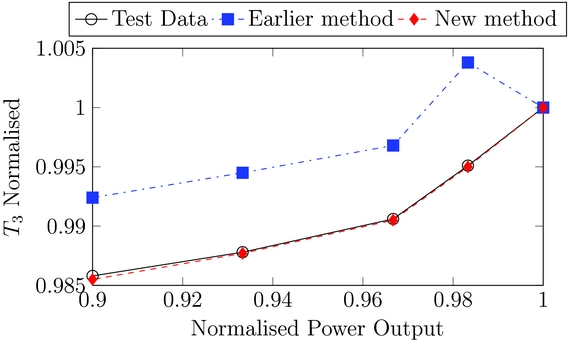
The results for both the new and earlier(Reference Lo Gatto, Li and Pilidis19) adaptation methods can be viewed from Figs 12 and 13, where the predicted off-design measurable parameters P 3 and T 3 are plotted against the engine power output. The same level of accuracy has been achieved for all the selected measurements, but only P 3 and T 3 are presented here because they had the lower prediction accuracy in Test Case 1. It is evident from Figs 12 and 13 that the new adaptation method is superior compared with the earlier method(Reference Lo Gatto, Li and Pilidis19) in terms of prediction accuracy.
Prediction of P 3 from new and earlier adaptation.

Prediction of T 3 from new and earlier adaptation.

The earlier adaptation method has a maximum error in temperatures equivalent to 8K to 10K and is characterised by an over prediction of the measurable parameters. The error distributions from the new adaptation method follow the same trend where its maximum prediction error occurs at the lowest power setting of 0.9.
Typically for a single point adaptation with a population size of 50 it takes around 12 seconds per generation. The multi-point adaptation with the same size of population takes slightly longer time to get a solution as shown in Table 8. In other words, it takes around 48 seconds per generation in Case 1 and 21 seconds per generation in Case 2. The maximum fitness achieved using the new adaptation method is 0.91 in Test Case 1 and 0.94 in Test Case 2.
Simulation parameters of test cases

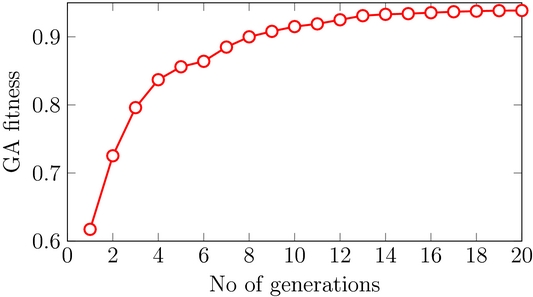
The convergence plot of the GA fitness is shown in Fig. 14. It is evident from Fig. 14 that the initial fitness of the GA is 0.6, and it takes about 8 generations to reach a fitness value of 0.9. Given that the computation time per generation is 21 seconds, the optimiser needs 168 seconds to reach the aforementioned level of fitness.
Converge plot of the GA fitness for the test case 2 of the proposed method.

The prediction accuracy of the proposed adaptation is superior to the reference method as seen from the fitness of the genetic algorithm which is 27% more accurate. The time taken for the developed adaptation to converge is greater than that of the earlier adaptation. The reason for this is that there are seven sub-coefficients controlling the compressor map generation, opposed to only three for the earlier adaptation, which in turn increases the searching space of the optimiser.
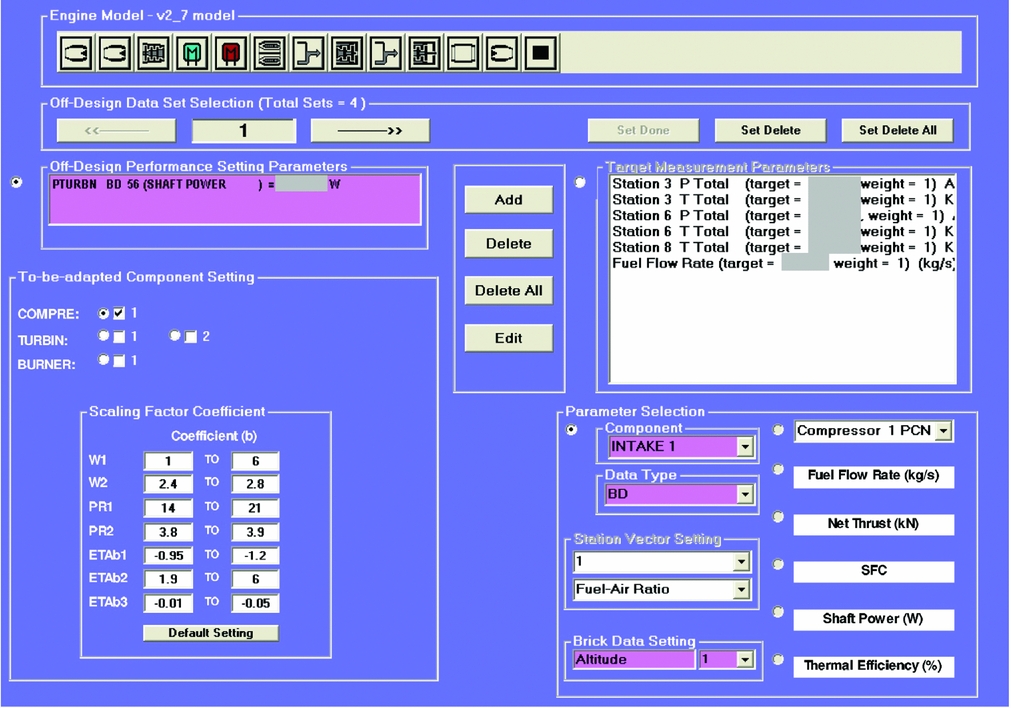
The setting window of PYTHIA's new adaptation method and the adaptation results window for such a test case are shown in Figs 15 and 16, respectively. The user has to set the handle of the gas turbine, which is the power output for this engine model and then the target measurements should be selected.
Adaptation setting window of PYTHIA.

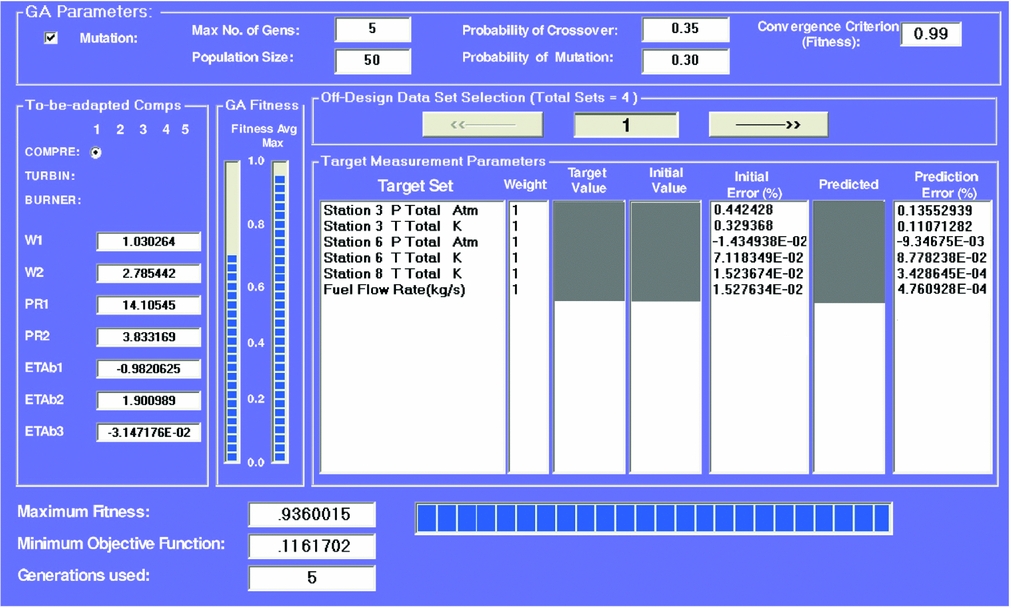
Adaptation results window of PYTHIA.

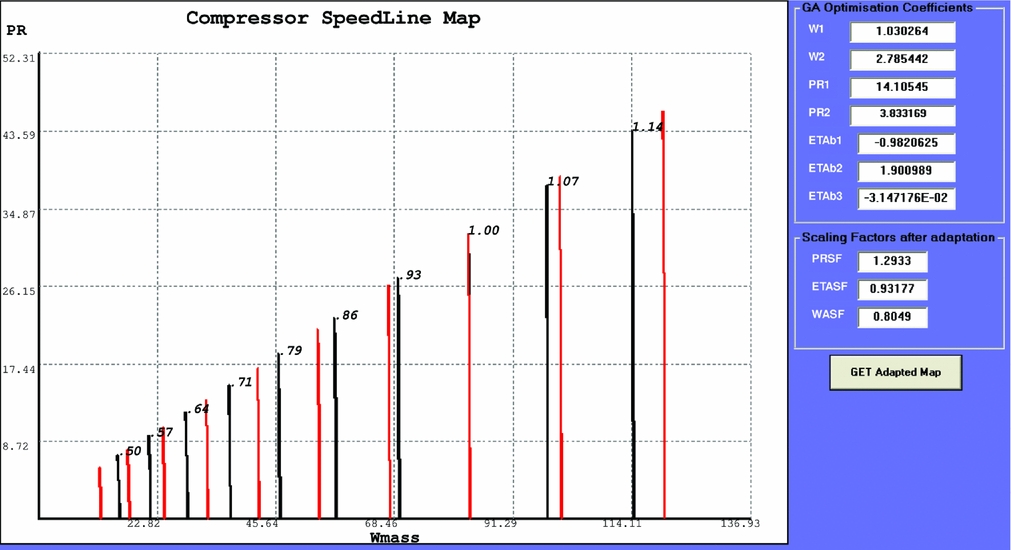
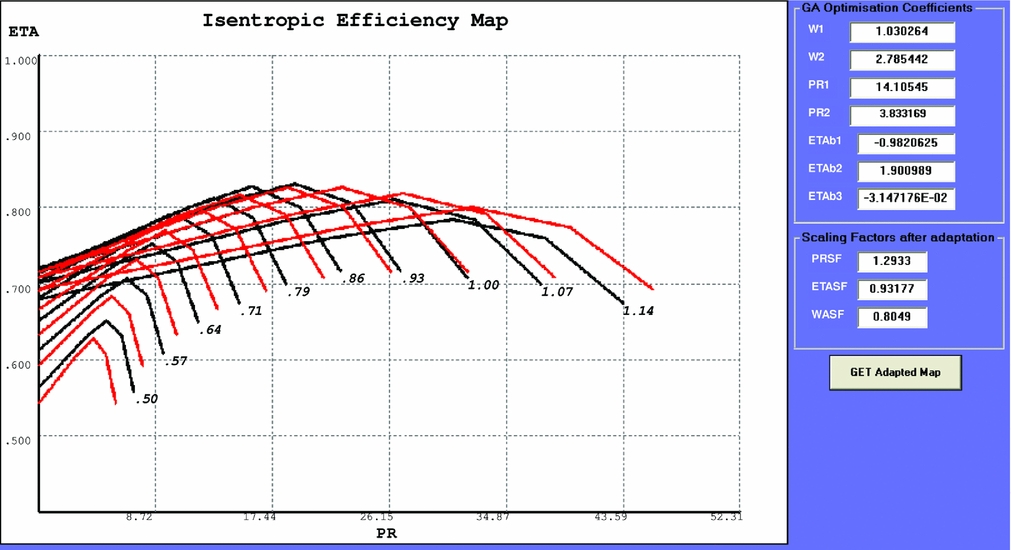
The results window provides the GA parameters and the simulated measurements results with their corresponding errors as shown in Fig. 16. Once the adaptation is completed, a comparison of the initial and final compressor map shape generated after design-point and off-design adaptation, respectively, are shown in Figs 17 and 18. The graphical representation of the generated compressor map can serve as a tool for ‘on the spot’ judgments of the engine's performance.
Compressor map in PR-WAC plane. The black and red lines correspond to the generated maps before and after off-design adaptation.

Compressor performance map in ETA-PR plane. The black and red lines correspond to the generated maps before and after off-design adaptation.

The shape of the compressor maps generated depend firstly on the set of the sub-coefficients optimised through GA and secondly on the number of computed points that each curve has. The proposed adaptation method has an improved accuracy. Another advantage of this method is its unique feature of the compressor map generation that has the potential for a wide range of applications.
4.0 CONCLUSIONS
In this paper, an advanced performance adaptation system is introduced that aims to improve the accuracy of gas turbine performance models at off-design conditions. This is achieved by introducing a new compressor map generation method, which introduces a set of parameters to control the shape of the characteristic maps in a non-linear way. The set of parameters that control the shape of the map are optimised by a genetic algorithm in order to match as accurate as possible the gas path measurements of an engine at off-design conditions.
Application of the developed approach to a model aero derivative gas turbine has proved the following.
-
• Its comparison to a reference adaptation method demonstrates that it offers around 27% improved prediction accuracy for the engine model.
-
• The computational time for a typical multiple operating point adaptation case with a population size of 50 is slightly higher than the reference adaptation method. In other words, it takes around 21 seconds per generation for the new method compared with 15 seconds per generation for the reference method.
The proposed non-linear adaptation method is capable of generating and tuning compressor maps of an engine performance model through implementation of available engine test data. It is a very useful tool for supporting model-based gas path diagnostics and prognostics applications that rely on accurate gas turbine performance models.
ACKNOWLEDGEMENTS
The financial support provided by Manx Utilities and the Engineering and Physical Sciences Research Council (EPSRC) is greatly acknowledged.