

Introduction
This article addresses a simple but fundamental question: do women political candidates get fewer votes than their male counterparts? The answer to this question matters a great deal because women are underrepresented in both legislatures and in the pool of candidates who run for office. If women receive fewer votes than men, political parties may be reluctant to recruit and promote the former.
The electoral fortunes of women are especially important given all that we know about the effect of gender representation in legislatures. Indeed, research suggests that women legislators have different values, policy preferences and priorities (Ford and Dolan Reference Ford and Dolan1995; Lovenduski and Norris Reference Lovenduski and Norris2003; Saint-Germain Reference Saint-Germain1989; Swers, Reference Swers1998; Taylor-Robinson and Heath, Reference Taylor-Robinson and Heath2003; Welch, Reference Welch1985). As a result, legislatures with more women are more likely to adopt policies that are consistent with such values and priorities (Berkman and O'Connor, Reference Berkman and O'Connor1993; Swers, Reference Swers2001; Thomas, Reference Thomas1991). Furthermore, the underrepresentation of women has long-term consequences for the persistent gender gap in political knowledge (Dassonneville and McAllister, Reference Dassonneville and McAllister2018).
What does prior research tell us about the effect of gender on electoral performance? As far as we can tell, only two previous studies have addressed this question in the Canadian context. The first was conducted by Hunter and Denton (Reference Hunter and Denton1984), who compared the electoral performance of men and women candidates in the 1979 and 1980 Canadian general elections. They report that “female candidates received about 53 per cent as many votes as did males in 1979, and approximately 44 per cent as many votes in 1980” (Reference Hunter and Denton1984: 399). But those differences disappeared when they controlled for incumbency, competitiveness and the party of the candidate. Hunter and Denton thus conclude that there is no evidence that female candidates do worse than men.
Twenty years later, Black and Erickson (Reference Black and Erickson2003) examined the same question in the case of the 1993 Canadian federal election. When data for this election were analyzed without statistical controls, women received fewer votes. However, the gap disappeared when incumbency, competitiveness and party were considered. Black and Erickson even find a small positive effect, with women candidates receiving 1 percentage point more votes. The authors thus conclude that “no evidence was found to support the hypothesis of voter bias against women” (Reference Black and Erickson2003: 96) and even argue “for more in-depth investigations into the basis of the female vote advantage” (Reference Black and Erickson2003: 96).Footnote 1
In this article, we improve upon prior efforts by considerably expanding the scope of investigation: we study data on the gender of over 21,000 candidates in all Canadian general elections since 1921, when women first ran for seats in Parliament. This large data set allows us to compute precise estimates (that is, with small standard errors) of the difference in the electoral fortunes of men and women candidates. When accounting for party effects and time trends, the difference between the vote shares of men and women is substantively negligible (±0.5 percentage point).
The broad coverage of our data set also allows us to assess how the electoral fortunes of men and women change over time. We find that the gender gap in vote share was larger in the 1920s (±2.5 percentage points), but it has now become statistically indistinguishable from zero.
Our results have important normative implications: political parties should recruit and promote more women candidates because they remain underrepresented in Canadian politics and because they do not suffer from a substantial electoral penalty.
Women Are Underrepresented in Canadian Politics
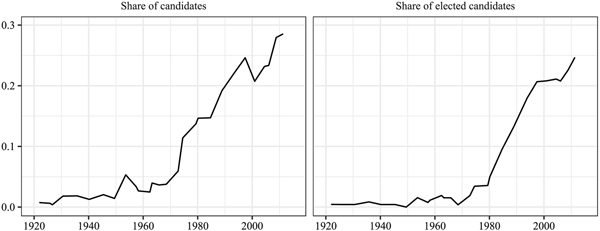
Our comprehensive data on the gender of all candidates for office in Canadian federal elections allows an unparalleled look at the representation of women over time. Figure 1 shows that despite progress in recent decades, the problem of underrepresentation persists. In the latest general elections, approximately 30 per cent of candidates were women and approximately 25 per cent of elected representatives were women.
Women are underrepresented in Canadian general elections.

Some (cynical) election-focused party organizers might ask: would increasing the share of women candidates be electorally costly? To answer this question, we estimate the relationship between the gender of candidates and the vote share that they received since 1921, when the first five women candidates ran in Canadian general elections: Harriet S. Dick, Rose Mary Louise Henderson, Elizabeth Bethune Kiely, Agnes Campbell Macphail and Harriet Dunlop Prenter.
The Gender Gap in Vote Share is Very Small
We use data on election results published by the Library of Parliament,Footnote 2 which cover all 29 Canadian general elections since 1921, when the first women ran for seats at the federal level. This data set includes observations for more than 21,000 unique individuals who contested a federal seat.Footnote 3 We coded the gender of each of those individuals manually.
Baseline estimate of the gender gap
To begin, we estimate the simplest possible regression model, focusing solely on the bivariate association between a candidate's vote share and her gender:
 $$\matrix{ \hfill {V_{\,pre} = \beta _1W_{\,pre} + \alpha + \epsilon _{\,pre}} \cr} $$
where V pre is the vote share of party p, in riding r, in election e; W pre is a binary variable that equals 1 if party p’s candidate is a woman and 0 otherwise; α is a constant; and ε pre is a disturbance term.Footnote 4
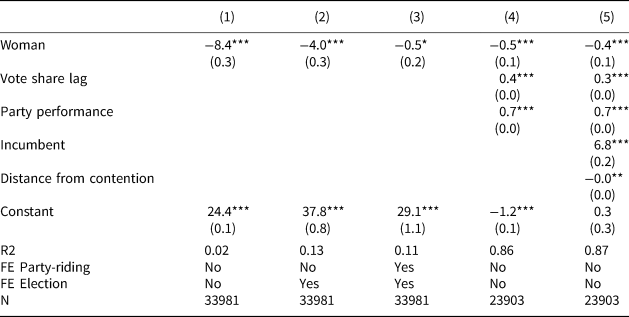
The first column of Table 1 shows that, on average, the vote share of women candidates is approximately 8 percentage points lower than the vote share of men candidates.
The gender gap in Canadian federal general elections. Ordinary least squares (OLS) regression models with party vote share as the dependent variable

Robust standard errors in parentheses
* p < 0.05, **p < 0.01, ***p < 0.001.
However, this should not lead us to conclude that there is a large electoral penalty for women. As we show below, this bivariate relationship is spurious because it is confounded by time, party and riding effects.
Time Trends
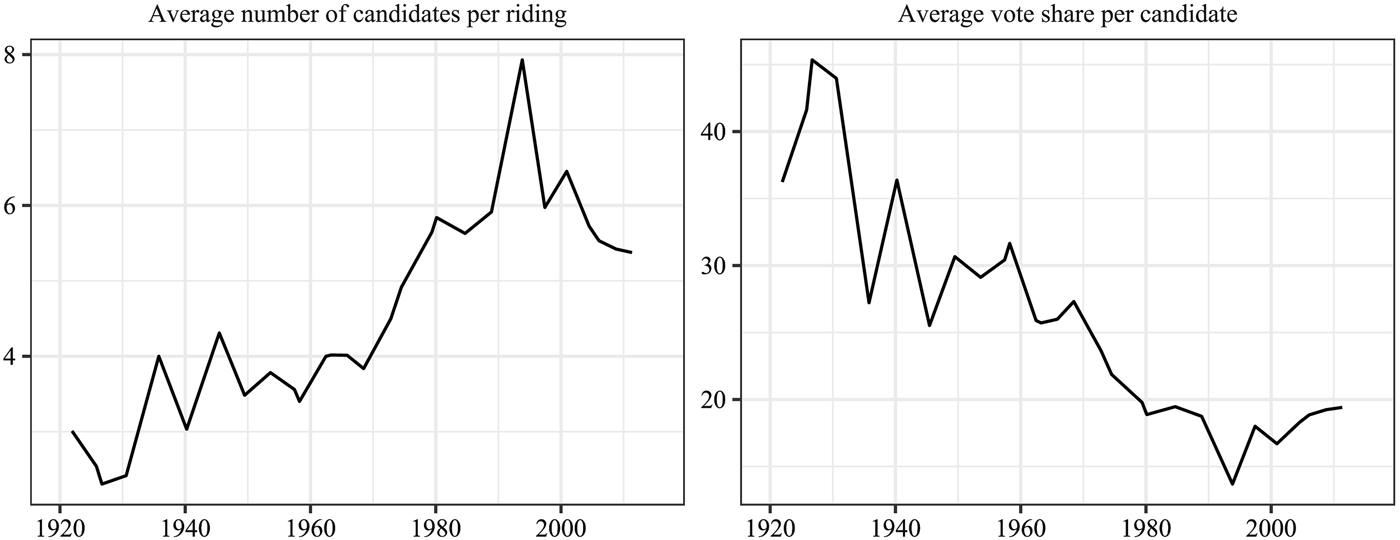
Figure 2 shows that the average number of candidates per riding has increased over time in Canadian elections. As a consequence, the average vote share has decreased. Since the number of women candidates follows a parallel time trend, the bivariate association between vote share and gender that we reported above is confounded.
In Canadian general elections, the average number of candidates increases and the average vote share decreases over time.

To control for time trends, we estimate a new model:
 $$\matrix{ \hfill {V_{\,pre} = \beta _1W_{\,pre} + \alpha _e + \epsilon _{\,pre}} \cr} $$
where α e represents time-varying intercepts (that is, election fixed effects). The α e dummy variables control for time trends that affect the country as a whole, as well as for any election-specific shock that affects every party in every riding in the same way throughout Canada.
Column 2 of Table 1 shows that this simple control for country-level time trends leads to a dramatic reduction in the size of the estimated gender gap, from 8 percentage points to 4 percentage points.
Party and Riding Effects
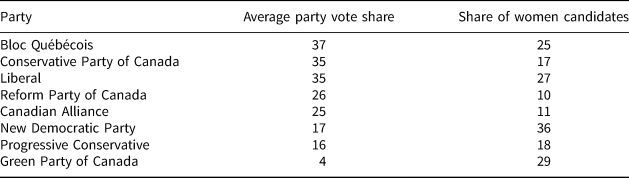
Another confounder is party popularity. If women tend to represent smaller parties, then the difference in vote shares between men and women might be explained by party effects. Table 2 shows that this is indeed the case: some third parties (for example, New Democratic Party, Green Party of Canada) have had more success than major parties in the House of Commons at recruiting and promoting women candidates. This is likely to reflect the fact that leftist parties are more prone to encourage women to run for office (Caul, Reference Caul2001; Cheng and Tavits, Reference Cheng and Tavits2011; Erickson, Reference Erickson1997; Tremblay, Reference Tremblay1998) and that most third parties in federal elections have been on the left.Footnote 5
Gender representation in Canadian political parties (%). All federal elections, 1993–2015

Another potential problem relates to gender bias in the geographic distribution of women candidates. If a party selects women to run in districts where it is less competitive, that discrimination could exaggerate the estimated gender penalty in electoral results.
We estimate two models to account for party and riding effects:
 $$V_{\,pre} = \beta _1W_{\,pre} + \alpha _e + \lambda _{\,pr} + \epsilon _{\,pre},$$
 $$V_{\,pre} = \beta _1W_{\,pre} + \beta _2V_{\,pre - 1} + \beta _3\bar V_{\,pke} + \alpha + \epsilon _{\,pre}.$$
Model 3 adds a dummy variable for each party-riding combination (λ pr). These fixed effects control for the fact that some parties are less popular than others and that a party's popularity varies from riding to riding. These are precisely the two threats to inference that arise when a woman runs for a third party or in a riding where her party is not competitive.
An alternative way to account for the same phenomena is shown in Equation 4, where we control for the party's vote share in the last election (V pre−1) and for the average vote share that each party p obtains in each province k during election e ( $\bar V_{pke}$).
Columns 3 and 4 of Table 1 show the results from those two models. Whereas the simple bivariate analysis points to a large gap in the electoral fortunes of men and women, controlling for time, party and riding effects suggests that the difference is quite small, approximately half a percentage point.
Importantly, because our data set is very large, we are able to estimate the association between gender and vote shares very precisely. Our empirical analysis shows that the gender gap is substantively small, even if it is statistically significant.
Does the Gender Gap Decrease Over Time?
If the Canadian electorate is growing more attuned to the rights of women, the gender gap should decrease over time.
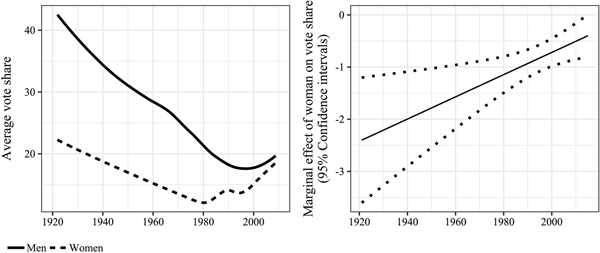
The left panel of Figure 3 shows a plot of the average vote share of men and women candidates over time (LOESS curves). For much of the period, there is a large observable gap between the electoral results of men and women candidates, but that gap has all but disappeared today. However, as we explained above, a simple bivariate analysis like this one can exaggerate the difference between men and women, because it ignores time, party and riding effects.
The gender gap in electoral performance decreases over time.

To account for these factors, we replicate the model in Equation 4 and interact the Woman indicator with a continuous Year variable:
 $$V_{\,pre} = \beta _1W_{\,pre} + \beta _2Y_e + \beta _3W_{\,pre}Y_e + \beta _4V_{\,pre - 1} + \beta _5\bar V_{\,pke} + \alpha + \epsilon _{\,pre}$$
The right panel of Figure 3 shows the estimated marginal effect of gender on vote share that we estimated using Equation 5 (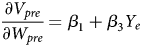 $\displaystyle{{\partial V_{pre}} \over {\partial W_{pre}}} = \beta _1 + \beta _3Y_e$). We find that in the 1920s, the (adjusted) gender gap in vote share was approximately 2.5 percentage points. Today, it is much smaller and is statistically indistinguishable from zero.
Robustness
We took several steps to ensure that the results reported above are robust. First, we estimated a new model with control variables for whether a party is the district-level incumbent. That model also controls for whether a party is a serious contender in a district (that is, the distance between that party's vote share and the winner's vote share in the previous election). The results in column 5 of Table 1 are not qualitatively different from the rest.
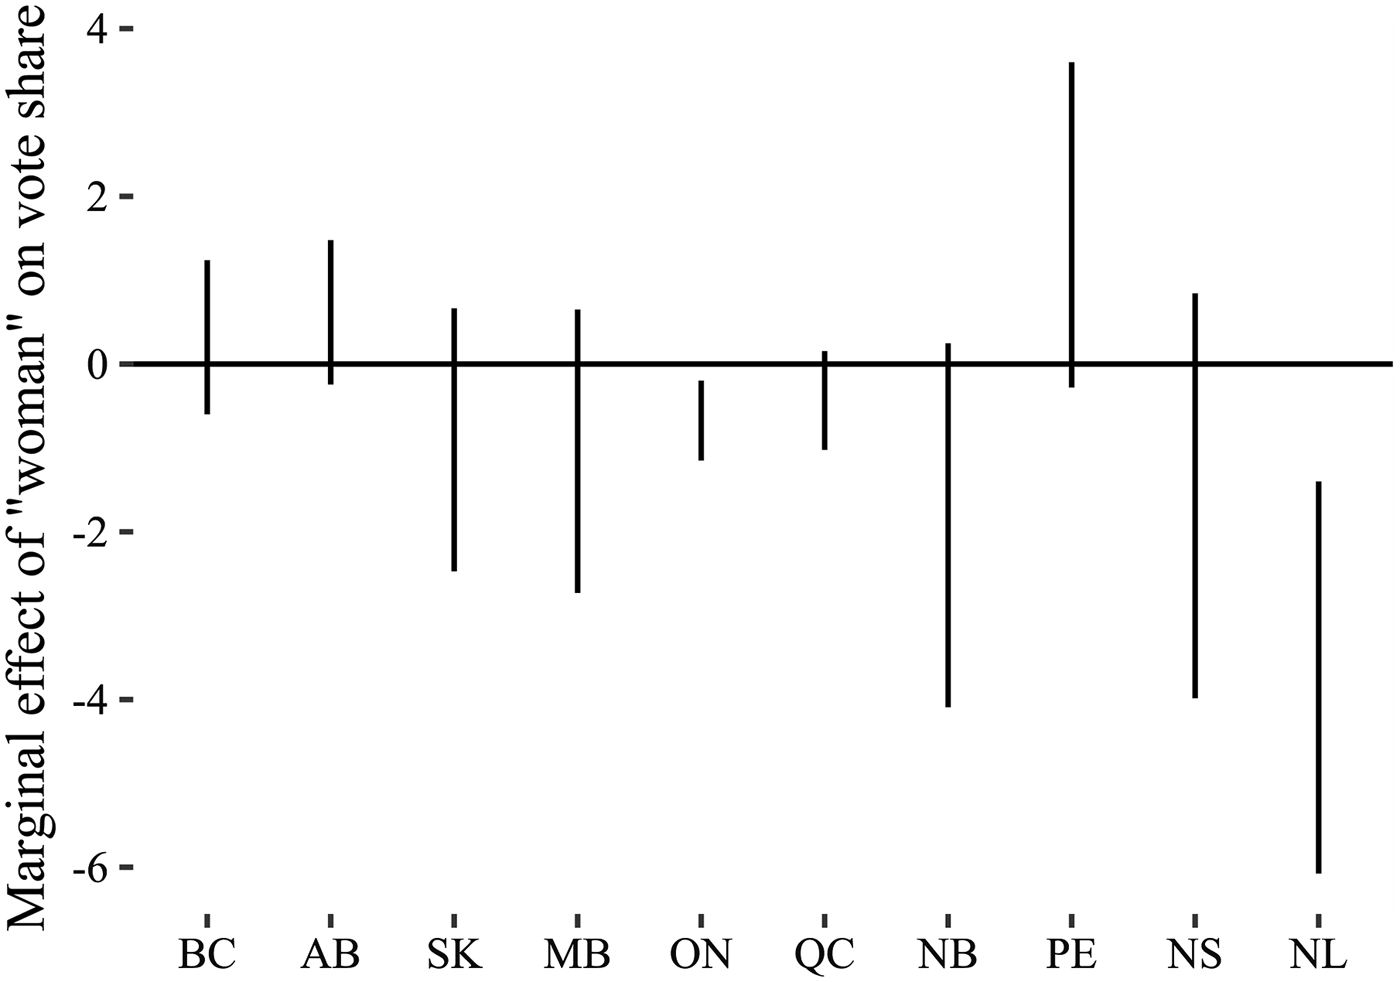
Second, we estimated a version of model 4 with different Woman coefficients for each province. Whereas we found some differences between provinces (for example, the Woman coefficient is positive in Prince Edward Island, but negative in Newfoundland), there was no obvious regional clustering, and most of the estimated Woman coefficients hover around zero (see Figure 4 in the Appendix). Overall, the finding that women do not suffer from a substantial electoral penalty seems to hold across much of the country.
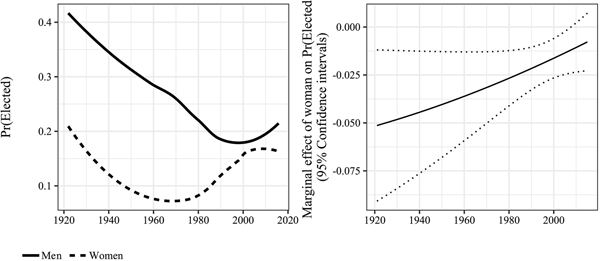
Finally, we re-estimated our core time-varying specification using a logit model with a binary dependent variable that equals one when the candidate was elected and zero otherwise. Again, our main conclusions are unchanged (see Figure 5 in the Appendix).
Interpretation and Caveats
To conduct the analyses reported in this article, we manually coded the gender of more than 21,000 unique candidates in Canadian federal elections and built a data set covering all general elections in the 1921–2015 period. We used this comprehensive data to estimate the gap in vote shares between men and women candidates. Importantly, the large size of our database allows us to offer precise estimates of the gap in question.
After controlling for country-level time trends, we estimate that the difference in the vote shares of men and women candidates is approximately 4 percentage points. Almost all of that difference can be linked to the fact that women tend to run for relatively unpopular parties. When we control for time and party effects, the gap between men and women all but disappears. Indeed, our preferred regression models suggest that this gap is very small (±0.5 percentage point). We also found evidence that the gender gap was higher decades ago but that it gradually disappeared over time.
Throughout the article, we have been careful to interpret our results in descriptive rather than causal terms because some of the formal conditions required for causal identification are quite stringent and may be violated here. One important concern is that unmeasured candidate-level characteristics could be related to both the dependent variable and the probability that a person will be nominated by her party.
For instance, if structural discrimination makes the path to nomination more arduous for women, then the typical woman candidate may be of higher “quality” than the typical man candidate. If candidate “quality” is positively associated with vote shares, our estimates of the Woman coefficient could be biased toward zero. In other words, if women candidates tend to be “better” than men candidates in some unmeasured way, the lack of a gender gap in vote shares could actually constitute evidence of electoral discrimination against women.Footnote 6 Researchers could improve on our work by expanding our database to include indicators of candidate quality.
Acknowledgements
We would like to thank the editors and the journal's anonymous reviewers for their helpful comments and suggestions as well as Christopher Cochrane, Ruth Dassonneville and Jean-François Godbout.
Appendix
Model 4 with province-specific Woman coefficients. 95% confidence intervals with Bonferroni correction.

The gender gap in electoral performance decreases over time.