Implications
We provide estimates of additive and dominance genetic variances in a purebred and a crossbred population of pigs for 22 traits related to growth and feed efficiency, carcass composition, meat quality, behaviour, boar taint and puberty. Some traits show relevant amount of dominance variance in both populations or increased amount in crossbreds (up to 18% of the phenotypic variance). Planned matings between individuals to exploit dominance genetic effects would be a good strategy to obtain descendants with an enhanced total genetic value, especially in crosses involving two breeds.
Introduction
The genetic components underlying the phenotypic variance of traits are of additive and non-additive nature. Animal breeding has mainly been focused on the estimation and utilization of the additive component of the genetic variance, being the one that can be transmitted from parents to offspring and exploited through selection. Dominance gene action is one of the components of the non-additive genetic variance. It has a major role on heterosis (Falconer and Mackay, Reference Falconer and MacKay1996), a property that, even not always being modelled explicitly, has been exploited in the production of commercial livestock and plants through crosses between genetically distant breeds or lines.
At the gene level, dominance deviations arise from the interaction between alleles at the same locus (Falconer and MacKay, Reference Falconer and MacKay1996). With the availability of high-density single nucleotide polymorphism (SNP) genotypic data, the methodology to account for dominance deviation effects has been revisited, and genomic models accounting for dominance have been proposed (e.g. Toro and Varona, Reference Toro and Varona2010; Su et al., Reference Su, Christensen, Ostersen, Henryon and Lund2012; Vitezica et al., Reference Vitezica, Varona and Legarra2013; Zeng et al., Reference Zeng, Toosi, Fernando, Dekkers and Garrick2013; Da et al., Reference Da, Wang, Wang and Hu2014; Vitezica et al., Reference Vitezica, Varona, Elsen, Misztal, Herring and Legarra2016; Xiang et al., Reference Xiang, Christensen, Vitezica and Legarra2016a). Accounting for dominance effects in genomic evaluation would increase the goodness of fit of the model and should consequently lead to an improvement in the prediction accuracy of the estimated genomic breeding values. One step further to take advantage of dominance effects is to perform planned matings (i.e. mate allocation) within breeds to boost the total genetic value of the progeny or planned crosses between the individuals of different breeds to produce crossbred animals with enhanced total genetic value (additive plus dominance genetic effects) (Toro and Varona, Reference Toro and Varona2010; Ertl et al., Reference Ertl, Legarra, Vitezica, Varona, Edel, Emmerling and Götz2014; Aliloo et al., Reference Aliloo, Pryce, González-Recio, Cocks, Goddard and Hayes2017).
The partition of the total genetic variance into its components (additive and non-additive) can differ from trait to trait, and between purebred and crossbred populations. A quantification of these genetic variance components will determine the extent to which it would be of interest to account for dominance in genomic evaluations or to establish mate allocation strategies along different populations and traits. The present study has assessed the contribution of the additive and dominance variances to the phenotype expression of 22 traits in a purebred Piétrain and a crossbred (Piétrain × Large White) pig populations using univariate genomic models that accounted for additive, dominance and genomic inbreeding effects. The 22 studied traits are related to growth rate and feed efficiency, carcass composition, meat quality, behaviour, boar taint and puberty.
Material and methods
Animals
Animals were produced by the three French breeding companies of the Alliance R&D group (Axiom, Choice Genetics France, Nucléus, IFIP) involved in the UtOpIGe project ANR-10-GENOM_BTV-015. A number of 636 purebred Piétrain (PB) and 720 crossbred Piétrain × Large White (CB) entire male piglets were produced on selection and multiplication farms and tested at a single test station. The PB and CB animals entered the test station facilities of Le Rheu (France) at approximately 4 weeks of age and were slaughtered at a fixed BW of 112 kg (at 5 to 6 months of age).
Phenotypes
Animals were weighted at the beginning (weighting around 35 Kg) and at the end of the test period (around 112 kg). Average daily gain (ADG, kg/day) was calculated as the BW gained during the test period divided by the duration of the period. Feed consumption was measured using an ACEMA 64 automated individual feeding system (Labroue et al., Reference Labroue, Guéblez, Sellier and Meunier-Salaun1994) combined with electronic identification of the pigs. Feed conversion ratio (FCR, kg/kg) was calculated as the ratio between feed consumption and BW gain. Average daily feed intake (ADFI, kg/day) was defined as the ratio between feed consumption and duration of the test period. Rib backfat thickness (BFT, mm) and rib muscle thickness (MT, mm) were measured on carcass with the Capteur Gras Maigre method (Daumas et al., Reference Daumas, Causeur, Dhorne and Schollhammer1998).
At the slaughterhouse, carcasses were chilled in a cooling room at 4°C for 24 h. Dressing yield (DY, kg/kg) was expressed as the ratio between cold carcass weight and live weight before departure to the slaughterhouse. Right half-carcasses were cut according to the normalized Dutch procedure (Metayer and Daumas, Reference Metayer and Daumas1998) and backfat was additionally separated from loin. Major cuts were weighted and expressed as a proportion of the cold half-carcass weight (kg/kg): loin (LO), ham (HC), backfat (BFW), belly (BW) and shoulder (SH).
Lean meat (LM, %) was estimated from a linear combination of the weights of cuts expressed as a percentage of the cold half-carcass weight for HC, LO and BFW (Daumas, Reference Daumas2008). Ultimate pH of the longissimus dorsi muscle (pHL) and the semimembranosus dorsi muscle (pHS) was measured using a Xerolyt electrode (Mettler-Toledo, Australia) and a Sydel pH meter (Sydel, France) at 24 h postmortem. Drip loss (DL, %) was quantified on a LO sample of about 130 g (at the 13th lumbar vertebra) placed 48 h in a plastic tray (Tusell et al., Reference Tusell, Gilbert, Riquet, Mercat, Legarra and Larzul2016).
Skin lesions were counted at two periods: 48 h after entry in the fattening building (BLB, counts) and at the end of the fattening period (BLE, counts), just before the departure of the first pen mate to the slaughterhouse. Lesions were also counted on carcasses (CL, counts). A detailed explanation of how skin lesions were recorded can be found in Parois et al. Reference Parois, Larzul and Prunier(2017) for BLB and BLE and in Parois et al. (Parois et al., Reference Parois, Prunier, Mercat, Merlot and Larzul2015) for CL. About 1 week before slaughter, a blood sample was taken from the jugular vein. Estradiol (ES) was measured on plasma using RIA kit (Orion Diagnostica, Espoo, Finland). Androstenone (AN), skatole (SK) and indole (IN) were measured by HPLC in a BFW sample extracted from the neck after slaughter. One can refer to Parois et al. Reference Parois, Prunier, Mercat, Merlot and Larzul(2015) for further details about the procedures used to measure AN, SK, IN and ES. Measurements of BLB, BLE, CL, AN, SK, IN and ES were normalized by natural logarithmic transformation for the analyses.
The 22 traits analysed in this study can be classified into growth and feed efficiency (ADG, FCR and ADFI), carcass composition (BT, MT, LM, BFW, HC, BW, LO and SH), meat quality (DY, pHS, pHL and DL), behaviour (BLB, BLE and CL), boar taint (AN, SK and IN) and puberty (ES) groups of traits.
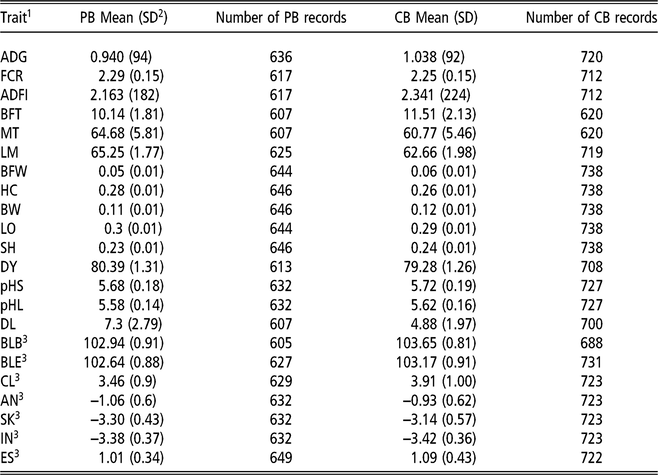
Summary statistics of the phenotypes for all the traits are presented in Table 1.
Summary statistics of the purebred (PB) and crossbred (CB) pig phenotype data

1 Average daily gain (ADG, kg/day), feed conversion ratio (FCR, kg/kg), average daily feed intake (ADFI, kg/day), backfat thickness (BFT, mm), muscle thickness (MT, mm), % lean meat (LM, %), backfat weight (BFW, kg/kg), ham cut (HC, kg/kg), belly weight (BW, kg/kg), loin (LO, kg/kg), shoulder (SH, kg/kg), dressing yield (DY, kg/kg), pH of the semimembranosus dorsi muscle (pHS, pH units), pH of the longissimus dorsi muscle (pHL, pH units), drip loss (DL, %), number of body lesions at the beginning of growth (BLB), number of body lesions at the end of growth (BLE), carcass lesions (CL), androstenone level (AN), skatole level (SK), indole level (IN) and estradiol level (ES).
2 Posterior standard deviation.
3 In natural logarithmic scale.
Genotypes
Animals were genotyped using the Illumina Porcine SNP60 BeadChip (Illumina, Inc., San Diego, USA). The SNPs with a call rate lower than 0.90 and a minor allele frequency lower than 0.05 were removed. For the remaining SNPs, the very few missing genotypes were imputed using a simple and naïve method that sampled the genotypes with probability weights based on the genotypic frequencies calculated at each locus from the non-missing genotypes (Perez et al., Reference Perez, de los Campos, Crossa and Gianola2010). This method keeps the average genotypic mean of the imputed loci unchanged after imputation. Animals with a call rate lower than 0.90 and parent–offspring pairs that displayed Mendelian inconsistencies were discarded. After quality control, 46,816 SNPs were retained for the analyses.
Statistical analysis
For each trait, purebred and crossbred phenotypes ( Y k ,k = PB, CB ) were separately analysed with the following general univariate genotypic model that accounted for dominance and inbreeding (Toro and Varona, Reference Toro and Varona2010; Xiang et al., Reference Xiang, Christensen, Vitezica and Legarra2016a):
 ${{\bf{y}}_k} = {{\bf{X}}_k}{{{\bf\beta }}_k} + {{\bf{f}}_k}{b_k} + {{\bf{u}}_k} + {{\bf{v}}_k} + {{\bf{e}}_k}$
Where β
k
is a vector that includes systematic effects and non-genetic random effects and X
k
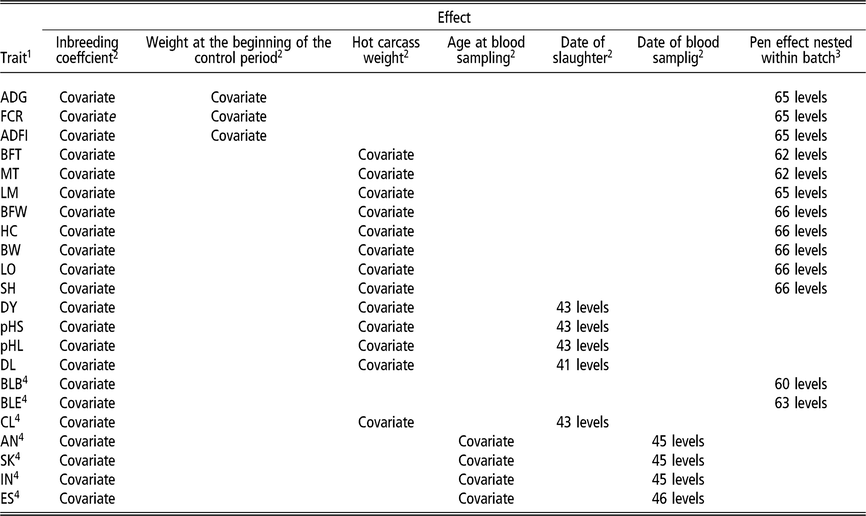
is an incidence matrix that assigns systematic and non-genetic random effects to the phenotypes. A description of the systematic and random effects included for each model trait is provided in Table 2. Terms u
k
and v
k
are the vectors of animal additive and dominance genotypic effects, respectively. These can be expressed in terms of additive and dominance SNP effects as u
k
= Z
k
a
k
and v
k = W
k
d
k
, being a
k
and d
k
the vectors of the additive and dominance SNP effects, respectively. Terms
Z
k
and W
k
are incidence matrices relating additive and dominance SNP effects to the animals with –1, 0, 1 (additive) and 0, 1, 0 (dominance) values for the AA, Aa and aa genotypes, respectively. Covariances for the additive and dominance genotypic values were modelled as
 $cov\left( {{\bf{u}}_k } \right) = {{{\bf{Z}}_k {\bf{Z'}}_k } \over {\left\{ {tr\left( {{\bf{Z'}}_k } \right){\rm{/n}}_{\rm{k}} } \right\}}}\sigma _{{\rm{A*}},{\rm{k}}}^{\rm{2}}$
and
 $cov\left( {\bf{v}} \right) = {{{{\bf{W}}_k}{\bf{W}}_k^'} \over {\left\{ {tr\left( {\left[ {{{\bf{W}}_k}{\bf{W}}_k^'} \right]} \right)/{n_k}} \right\}}}\sigma _{D*,k}^2$
(Vitezica et al., Reference Vitezica, Varona, Elsen, Misztal, Herring and Legarra2016) where
 $\sigma _{A*,k}^2$
and
 $\sigma _{D*,k}^2$
are the estimated variance components, and nk
the number of animals. Term f
k
is a vector of inbreeding coefficients that accounts for directional dominance and, thus, makes d
k
to have zero mean a required condition for random effects in mixed-model equations. It is calculated as the average homozygosity per individual, and b
k is the inbreeding depression coefficient (refer to Xiang et al., Reference Xiang, Christensen, Vitezica and Legarra2016a for further details). Term e
k
is the vector of random residual effects.
Systematic and permanent environmental random effects included in the models of analysis for each pig trait
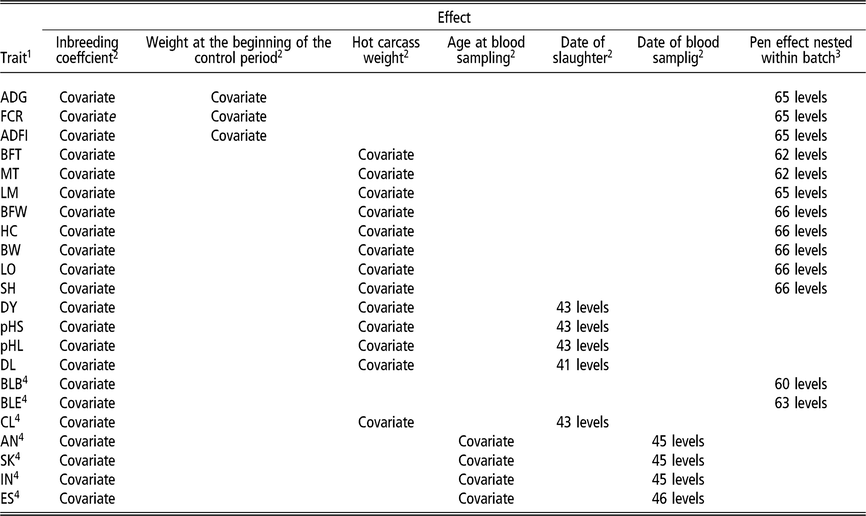
1Average daily gain (ADG, kg/day), feed conversion ratio (FCR, kg/kg), average daily feed intake (ADFI, kg/day), backfat thickness (BFT, mm), muscle thickness (MT, mm), % lean meat (LM, %), backfat weight (BFW, kg/kg), ham cut (HC, kg/kg), belly weight (BW, kg/kg), loin (LO, kg/kg), shoulder (SH, kg/kg), dressing yield (DY, kg/kg), pH of the semimembranosus dorsi muscle (pHS, pH units), pH of the longissimus dorsi muscle (pHL, pH units), drip loss (DL, %), number of body lesions at the beginning of growth (BLB), number of body lesions at the end of growth (BLE), carcass lesions (CL), androstenone level (AN), skatole level (SK), indole level (IN) and estradiol level (ES).
Effect Included in the model as a 2 systematic effect or a 3 permanent environmental random effect.
4In natural logarithmic scale.
The variance components
 $\sigma _{A*,k}^2$
and
 $\sigma _{D*,k}^2$
cannot be interpreted as the classical genetic variances (Vitezica et al., Reference Vitezica, Varona, Elsen, Misztal, Herring and Legarra2016), but once estimated, they can be used to retrieve the additive and dominance SNP variances with
 $\sigma _{a,k}^2 =\sigma _{A*,k}^2/\left\{ {tr\left( {\left[ {{{\bf{Z}}_k}{\bf{Z}}_k^'} \right]} \right)/{n_k}} \right\}$
and
 $\sigma _{d,k}^2 = \sigma _{D*,k}^2/\left\{ {tr\left( {\left[ {{{\bf{W}}_k}{\bf{W}}_k^'} \right]} \right)/{n_k}} \right\}$
, respectively (Vitezica et al., Reference Vitezica, Varona, Elsen, Misztal, Herring and Legarra2016).
Then, the additive and dominance SNP variances estimated in each population together with the allelic frequencies of the population allow for calculating the breeding additive
 $(\sigma _{A,k}^2)$
and dominance deviation
 $(\sigma _{D,k}^2)$
variances for the two populations that can be interpreted in terms of classical ‘statistical’ effect variances used in quantitative genetics (Vitezica et al., Reference Vitezica, Varona, Elsen, Misztal, Herring and Legarra2016).
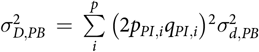
For the PB Piétrain (PI) population the additive genetic variance (i.e. breeding value variance) is
 $\sigma _{A,PB}^2 = \mathop \sum \limits_i^p \left( {2{p_{PI,i}}{q_{PI,i}}} \right)\sigma _{a,PB}^2$ + $\mathop \sum \limits_i^p \left( {2{p_{PI,i}}{q_{PI,i}}{{({q_{PI,i}} - {p_{PI,i}})}^2}} \right)\sigma _{d,PB}^2$
and the dominance deviation variance is obtained as
 $\sigma _{D,PB}^2 = \mathop \sum \limits_i^p {\left( {2{p_{PI,i}}{q_{PI,i}}} \right)^2}\sigma _{d,PB}^2$
. The terms
 ${p_{PI,i}}$
and
 ${q_{PI,i}}$
are the allelic frequencies of the ith SNP (I = 1,…,p) in the Piétrain population.
The additive genetic variance due to alleles from the Piétrain population in the F1 crossbreds can be obtained as:
 $$\eqalign{\sigma _{A,C{B_{PI}}}^2= \mathop \sum \limits_i^p \left( {2{p_{PI,i}}{q_{PI,i}}} \right)\sigma _{a,CB}^2 \cr + \mathop \sum \limits_i^p \left( {2{p_{PI,i}}{q_{PI,i}}{{({q_{LW,i}} - {p_{LW,i}})}^2}} \right)\sigma _{d,CB}^2$$
Since Large White allelic frequencies pLW,i
and qLW,i
are not known because Large White females did not have genotypes, they were inferred with
 ${p_{LW,i}} = 2{p_{CB,i}} - {p_{PI,i}}$
, where
 ${p_{CB,i}}$
is the allelic frequency in the F1 crossbred population (Piétrain × Large White) where genotypes are known
 $({q_{LW,i}} = 1 - {p_{LW,i}})$
. Since the latter is a numerical approximation, allelic frequencies higher than 1 and lower than 0 were set to 1 and 0.001, respectively (this occurred in less than 3% of the SNPs).
Conversely, the additive genetic variance due to alleles from the Large White population in the F1 crossbreds is:
 $$\eqalign{\sigma _{A,C{B_{LW}}}^2 = \mathop \sum \limits_i^p \left( {2{p_{LW,i}}{q_{LW,i}}} \right)\sigma _{a,CB}^2 \cr + \mathop \sum \limits_i^p \left( {2{p_{LW,i}}{q_{LW,i}}{{({q_{PI,i}} - {p_{PI,i}})}^2}} \right)\sigma _{d,CB}^2$$
The additive genetic variance for the F1 crossbred population is:
 $\sigma _{A,CB}^2 = 0.5\sigma _{A,C{B_{PI}}}^2 + 0.5\sigma _{A,C{B_{LW}}}^2$
and the dominance genetic variance (i.e. variance due to dominance deviation effects) in the crossbred population is:
 $\sigma _{D,CB}^2 = \mathop \sum \limits_i^p \left( {4{p_{PI,i}}{q_{PI,i}}{p_{LW,i}}{q_{LW,i}}} \right)\sigma _{d,CB}^2$
Parameter inference
A Bayesian framework was adopted for inference. Flat prior distributions were assumed for the parameters of the systematic effects and the (co)variance components. The GIBBS2f90 software developed by Misztal et al. (Misztal, Reference Misztal1999) was used to estimate the marginal posterior distributions of the parameters of interest via Gibbs sampling algorithm. Single chains of 400,000 iterations were run by discarding the first 200,000 iterations, for each analysed trait and genetic type. The burn-in was determined by visual inspection and by the procedures of Raftery and Lewis (Reference Raftery and Lewis1992) and Geweke (Reference Geweke1992). Samples of the parameters of interest were saved every 10 rounds.
Model comparison
Reduced models that were not accounted for dominance genotypic effects were implemented for all traits in both populations to be compared to the complete models that included dominance to statistically assess the relevance of including a dominance genetic effect in the models. Under a frequentist approach, restricted maximum likelihoods of the reduced and the complete models were obtained using REMLF90 software (Misztal, Reference Misztal1999) and a restricted likelihood ratio test was performed. Because the model comparison corresponded to a test of a parameter on the boundary of parameter space (i.e. testing for zero dominance variance), the distribution of the test statistic under the null hypothesis was a 50:50 mixture of Chi2-0df and chi2-1df distributions (Morrell, Reference Morrell1998).
Results and discussion
The present study aimed to assess the contribution of the additive and dominance genetic variances to the phenotypic variance of 22 traits related to growth and feed efficiency, carcass composition, meat quality, behaviour, boar taint and puberty. The genetic variances have been estimated in a PB Piétrain and a CB (Piétrain x Large White) population. The latter is not a crossbred animal commonly used for commercial purposes, but it was produced to create CB animals from two genetically distant lines (a terminal sire line and a maternal line). For the present study, the CB population allows to elucidate if the contribution of the dominance genetic effects to the phenotypic expression of the traits is relevantly different between populations with distinct genetic backgrounds. Details on main characteristics of the Piétrain and Large White lines can be found in IFIP (2013).
Ratios of variance components
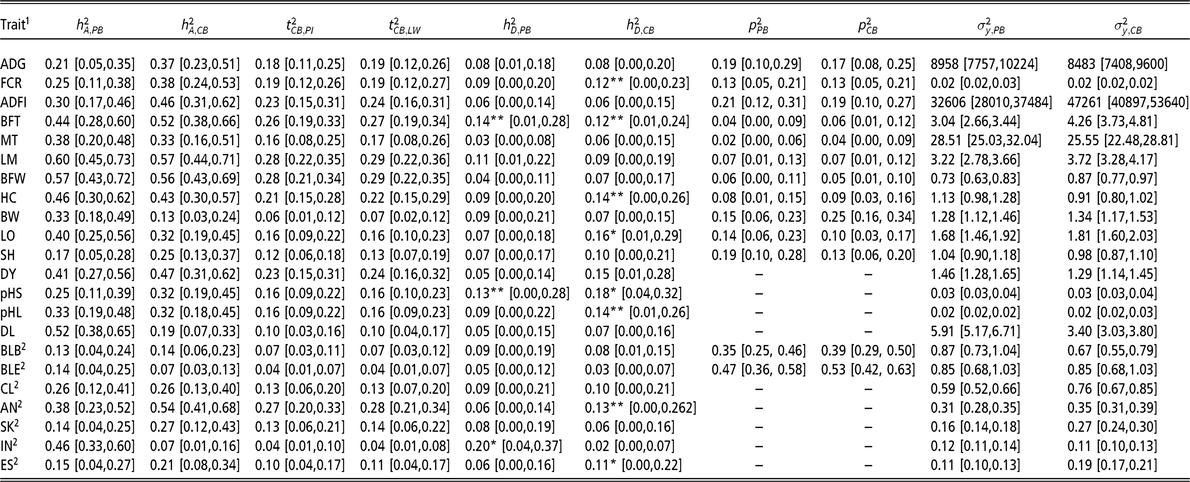
Table 3 shows the posterior mean of the marginal distribution of the ratios of the variance components with respect to the total phenotypic variance and the phenotypic variance estimated for all the traits in the two populations.
Mean (highest posterior density interval at 95%) of the marginal distribution of heritability
 $(\bi{h_{A,k}^2})$
, ratio of the additive genetic variance for Piétrain (PI) and Large White (LW) populations in the CB with respect to the CB phenotypic variance (
 $t_{\bf CB,PI}^2$
and
 $\bi {t_{CB,LW}^2}$
, respectively), ratio of dominance variance
 $(h_{D,k}^2)$
, ratio of permanent environmental variance
 $(\bi p_k^2)$
and phenotypic variance
 $(\bi\sigma^2 _{\bi {y,k})$
estimated for the purebred (k = PB) and crossbred pig populations (k = CB)

Dominance deviation variance significantly different from 0 at * P-value < 0.05 and **P-value < 0.10 in a restricted likelihood ratio test.
1 Average daily gain (ADG, kg/day), feed conversion ratio (FCR, kg/kg), average daily feed intake (ADFI, kg/day), backfat thickness (BFT, mm), muscle thickness (MT, mm), % lean meat (LM, %), backfat weight (BFW, kg/kg), ham cut (HC, kg/kg), belly weight (BW, kg/kg), loin (LO, kg/kg), shoulder (SH, kg/kg), dressing yield (DY, kg/kg), pH of the semimembranosus dorsi muscle (pHS, pH units), pH of the longissimus dorsi muscle (pHL, pH units), drip loss (DL, %), number of body lesions at the beginning of growth (BLB), number of body lesions at the end of growth (BLE), carcass lesions (CL), androstenone level (AN), skatole level (SK), indole level (IN) and estradiol level (ES).
2 Estimated in natural logarithmic scale.
Additive genetic effects
Heritability estimates of growth and feed efficiency traits (ADG, FCR and ADFI) were moderate (between 0.20 and 0.46) and within the range of values reviewed (Clutter, Reference Clutter, Rothschild and Ruvinsky2011). Heritability estimates of carcass composition traits ranged from moderate to high values in both populations (between 0.17 and 0.60). Most of the heritability estimates for carcass composition traits were within the range of other estimates previously reported in Piétrain and in other pig breeds (Bidanel et al., Reference Bidanel, Ducos, Guéblez and Labroue1994; Newcom et al., Reference Newcom, Baas, Mabry and Goodwin2002; Ciobanu et al., Reference Ciobanu, Lonergan, Huff-Lonergan, Rothschild and Ruvinsky2011; Lopes et al., Reference Lopes, Bastiaansen, Janss, Knol and Bovenhuis2015). A low heritability value was found for BW in the CB population (0.13) compared to other values previously reported in other pig breeds (0.33, Kang et al., Reference Kang, Lopez, Kim, Kim, Kim, Nam and Seo2015). Meat quality traits showed moderate heritabilities in both populations (between 0.19 and 0.51) in accordance with counterpart values found in literature (Sellier and Monin, Reference Sellier and Monin1994; Ciobanu et al., Reference Ciobanu, Lonergan, Huff-Lonergan, Rothschild and Ruvinsky2011). The heritability estimate for DL in the PB population was very high compared to published values that range from 0.01 to 0.30 (Ciobanu et al., Reference Ciobanu, Lonergan, Huff-Lonergan, Rothschild and Ruvinsky2011). This could be because of the presence of the halothane gene that segregates in the Piétrain population. The halothane gene is a major gene known to have a detrimental effect on meat quality causing pale, soft and exudative meat of susceptible individuals (Larzul et al., Reference Larzul, Roy, Gueblez, Talmant, Gogue, Sellier and Monin1997).
Lesion traits showed moderate to low heritabilities (0.07 to 0.26). The moderate heritability of CL is in agreement with the previously estimated value by Parois et al. Reference Parois, Prunier, Mercat, Merlot and Larzul(2015) using the same dataset and with another study where carcass lesions were measured on farm after mixing (Turner et al., Reference Turner, Farnworth, White, Brotherstone, Mendl, Knap, Penny and Lawrence2006). Heritabilities estimated for BLB and BLE were lower than those for CL, although the highest posterior density interval (HPD95% ) overlapped. This is, possibly, because CL measurements were collected after mixing of close to puberty animals, which contributes to express aggressiveness (which included transport to the slaughterhouse and waiting time). The other two skin lesion traits were recorded after less potentially stressful situations. Fattening building was recorded at the beginning of the BLE right after the mixing of animals in the test station at a very young age, and BLE was recorded simultaneously for all animals from one pen just before the departure of the first pen mate to the slaughterhouse. This could explain the lower genetic variance and also the lower heritability estimates obtained for these two traits compared to CL.
Accumulation of AN, SK and to some extent IN is the main cause for boar taint, that is an unpleasant odour found in pork meat when cooking (Lundstrom et al., Reference Lundstrom, Matthews and Haugen2009). In turn, ES is an indicator of sexual development (Prunier et al., Reference Prunier, Brillouet, Merlot, Meunier-Salaün and Tallet2013). Traits related to boar taint had a high (0.37 to 0.54 for AN, PB-CB respectively) and a moderate heritability (0.13 to 0.27 for SK, PB-CB respectively) and 0.46 to 0.07 for IN, PB-CB respectively. Heritability estimates obtained for AN, SK, IN and ES were of about the same magnitude as the previous study that used the same dataset (Parois et al., Reference Parois, Prunier, Mercat, Merlot and Larzul2015). All the heritability estimates were within the range of values previously found in the literature except for IN in the PB where a high value was found compared to other studies (see revision made by Parois et al., Reference Parois, Prunier, Mercat, Merlot and Larzul2015).
Parental allelic contribution effect to the crossbreds
The Piétrain and Large White allelic contributions to the CB variance were defined as the ratios of the additive genetic variance for PI and LW in the F1 CB population with respect to the F1 CB phenotypic variance, and were of about the same magnitude in all the traits (
 $t_{CB,PI}^2$
and
 $t_{CB,LW}^2$
, Table 3). Almost equal additive genetic variances due to alleles of the parental populations in the crossbreds were reported by Vitezica et al. Reference Vitezica, Varona, Elsen, Misztal, Herring and Legarra(2016) and Xiang et al. (Reference Xiang, Christensen, Vitezica and Legarra2016a) who used the same model than the current study for the analyses of litter size in pigs but with a multiple trait approach. In this model, estimates of these two allelic contribution variances differ only because of differences on allelic frequencies between the parental populations, whereas additive and dominance variances of the SNP effects are the same and estimated in the F1 CB population (equations 5 and 6 from Vitezica et al. (Reference Vitezica, Varona, Elsen, Misztal, Herring and Legarra2016) model). Furthermore, these two variances will be identical or very similar when the allelic frequencies of the two parental populations will be either identical (or very similar) or opposite (or almost opposite). Other model approaches that do not account for dominance and inbreeding estimate the variance of the parental allelic contributions to the crossbred descendants as two separated random effects. Christensen et al. (Reference Christensen, Madsen, Nielsen and Su2014) developed a single-step method for the joint genomic evaluation of PB and CB performance. Using CB genotypes, their model accounts for the exact contribution of alleles of the sire and the dam to a given CB performance. Xiang et al. (Reference Xiang, Nielsen, Su, Legarra and Christensen2016b) validated Christensen et al. (Reference Christensen, Madsen, Nielsen and Su2014) model analysing litter size data on Yorkshire × Landrace sows. The genetic variance due to the allelic contribution to the crossbred performance of the Yorkshire breed was slightly higher than that of the Landrace.
Some of the PB and CB phenotypes of the present study were previously analysed by extending the pedigree-based terminal-cross model proposed by Wei and van der Werf (Wei and Werf, Reference Wei and Werf1994) to a single-step procedure (Tusell et al., Reference Tusell, Gilbert, Riquet, Mercat, Legarra and Larzul2016). This model only uses parental genotypes, and the additive genetic effect of a crossbred individual is also decomposed into the additive effects of the sire and dam but, contrary to Christensen model (Christensen et al., Reference Christensen, Madsen, Nielsen and Su2014), the Mendelian sampling effect cannot be estimated and thus remains confounded with the residual effect. Tusell et al. Reference Tusell, Gilbert, Riquet, Mercat, Legarra and Larzul(2016) found higher ratios of genetic variance for CB performance for the Piétrain line than for the Large White line for FCR, pHL and intramuscular fat and equal parental ratios for ADG, LM and DL. However, in that approach (Tusell et al., Reference Tusell, Gilbert, Riquet, Mercat, Legarra and Larzul2016), the genetic correlation between PB animal genetic effects and the parental sire contribution to the crossbreds was accounted for in a bivariate model. This genetic correlation has been ignored in our study. We performed univariate models to estimate separately the additive and dominance genetic variance components in the two populations because the limited data size did not allow estimating genetic (co)variances in a highly parameterized model including dominance effects.
Variance of dominance deviation effects
The ratios of dominance deviation variance with respect to the total phenotypic variance across traits ranged from null to moderate values (0.18 for pHS in CB, Table 3). This indicates different contributions of this non-additive genetic effect to the phenotypic expression of the analysed traits. There was not a clear common pattern of dominance expression within groups of analysed traits. This fact is not surprising since the nature of the genetic background of the traits belonging to a group could be very different even if, for practical reasons, they have been classified here in the same category of traits (e.g. DY and DL, both considered meat quality traits). Only dominance deviation variances tested to be non-zero with a significant P-value < 0.10 in a restricted log-likelihood ratio test are commented in this section (denoted with * and ** in Table 3). As expected, dominance variances tested significantly different from zero were the ones that explained a larger proportion of the phenotypic variance of to the traits and populations although all the estimates included the zero in the HPD95%.
Published estimates of dominance deviation variances are scarce in the literature, and to our knowledge, they have never been estimated before for most of the traits analysed here. Ratios of dominance deviation variance for the traits related to feed efficiency and growth were very low being the FCR in CB the only significant one (0.06, Table 3). Lopes et al. Reference Lopes, Bastiaansen, Janss, Knol and Bovenhuis(2015) estimated that the proportion of phenotypic variance explained by dominance was of about 14%, 13% and 8% for lifetime daily gain and 6%, 8% and 10% for BFW in Piétrain, Landrace, and Large White populations, respectively (view file S1 in the supporting information of Lopes et al., Reference Lopes, Bastiaansen, Janss, Knol and Bovenhuis2015). Same study also reported estimates of the proportion of dominance variance to the phenotypic variance for number of teats equal to 3% and 7% in the Landrace and Large White populations, respectively. Although not relevantly different, estimated dominance values for lifetime daily gain in the Piétrain population in Lopes et al. Reference Lopes, Bastiaansen, Janss, Knol and Bovenhuis(2015) are slightly higher than ours, possibly because they used a model that did not account for inbreeding. Estimates of dominance variance can be inflated when average heterozygosity or inbreeding is not accounted for in the model (Aliloo et al., Reference Aliloo, Pryce, González-Recio, Cocks, Goddard and Hayes2017; Moghaddar and van der Werf, Reference Moghaddar and van der Werf2017). Su et al. Reference Su, Christensen, Ostersen, Henryon and Lund(2012) reported that dominance variance represented about 5% of the phenotypic expression of ADG in Duroc pigs. However, they used a genotypic model where the estimated variance due to additive and dominance genotypic effects cannot be properly compared to the variances expressed in terms of breeding values and dominance deviations of the present study (Vitezica et al., Reference Vitezica, Varona and Legarra2013).
Ratios of dominance deviation variance for traits related to carcass composition ranged from null to moderate to low values (0.14 and 0.12 for BFT in PB and CB, respectively). The ratio of dominance variance ranged from 0.00 to 0.07 across different BW and scanned body composition traits in a purebred population, and from 0.07 to 0.19 in a combined crossbred population in sheep (Moghaddar and van der Werf, Reference Moghaddar and van der Werf2017). This ratio decreased to 0.03 and 0.09 after accounting for heterosis effects. In another study, the median dominance variance across 16 traits related to growth, carcass and fertility traits of beef cattle was low, about 5% of the phenotypic variance (Bolormaa et al., Reference Bolormaa, Pryce, Zhang, Reverter, Barendse, Hayes and Goddard2015).
Ratios of dominance deviation variance for traits related to behaviour, boar taint and puberty ranged from null to low values (0.11 for ST in CB and 0.20 for IN in PB, Table 3). Variance component estimates obtained with IN were unusually high, so results should be taken with caution. To our knowledge, there are no previous published estimates of dominance variances for these types of traits.
There is a common belief that low heritable traits can be more influenced by non-additive genetic effects than the highly heritable ones. This fact had not been confirmed on the traits analysed here, since for instance, the correlation between heritability and proportion of phenotypic variance due to dominance deviation variance among traits was almost null or even positive (0.13 and 0.44 for the PB and the CB population, respectively). Notice that we have calculated the correlation between the two ratios and not directly between the variances to avoid influence of scale effects along the different traits. Likewise, the proportion of phenotypic variance explained by dominance effects was estimated to be very low for litter size, a low heritable trait. For instance, the proportion of dominance variation relative to phenotypic variance for total number of piglets born in Landrace, Yorkshire and Landrace x Yorkshire pigs was of 0.3%, 0.6% and 0.2%, respectively, giving a ratio of dominance variance to additive genetic variances of 5%, 11% and 7%, respectively (Xiang et al., Reference Xiang, Christensen, Vitezica and Legarra2016a). Similarly, Vitezica et al. Reference Vitezica, Varona, Elsen, Misztal, Herring and Legarra(2016) reported a proportion of dominance variance relative to additive genetic variance of around 15% in accordance to what has been previously reported in the literature for this trait using pedigree-based models (25%, reviewed by Vitezica et al., Reference Vitezica, Varona, Elsen, Misztal, Herring and Legarra2016). For that study, the proportion of phenotypic variance for total number of piglets born alive due to dominance effects was very small, around 2% in two pure parental populations and its crossbred population. Similarly, the proportion of dominance variation relative to phenotypic variance for a fertility trait such as calving interval was 1.2% in Holstein, and equal to zero in Jersey cows (Aliloo et al., Reference Aliloo, Pryce, González-Recio, Cocks and Hayes2016). Proportions of dominance variance to phenotypic variance reported in cattle for other traits are very variable, and they range from 3% to 26% for milk production traits, 23% and 21% for protein and casein content, respectively, and 12% for conformation traits (reviewed by Aliloo et al., Reference Aliloo, Pryce, González-Recio, Cocks and Hayes2016). These estimates come from studies made in different breeds that used either pedigree or SNP-based models, and accounted or not for inbreeding.
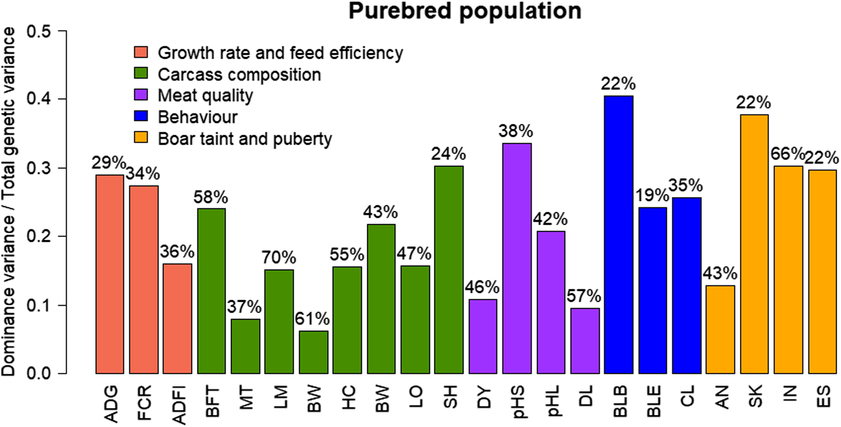
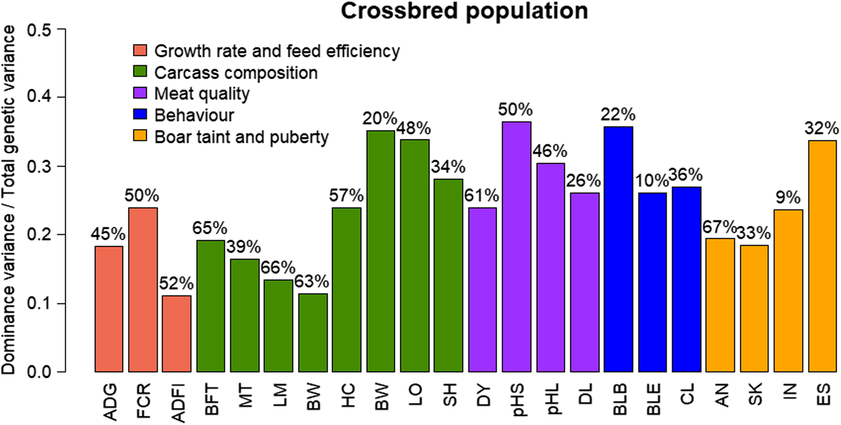
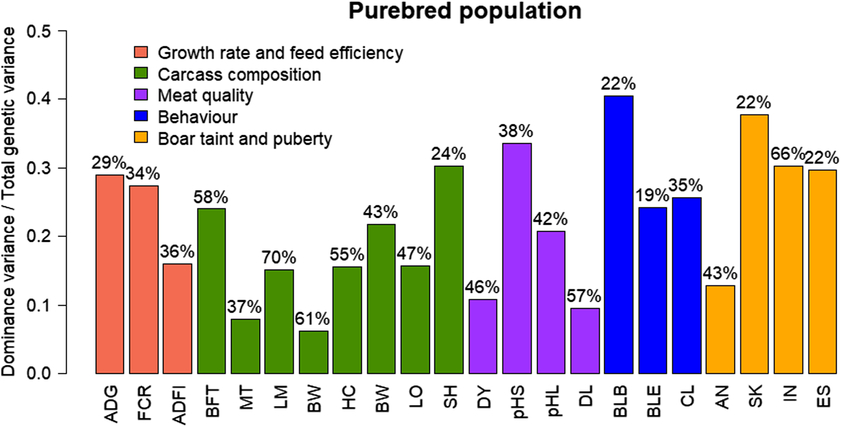
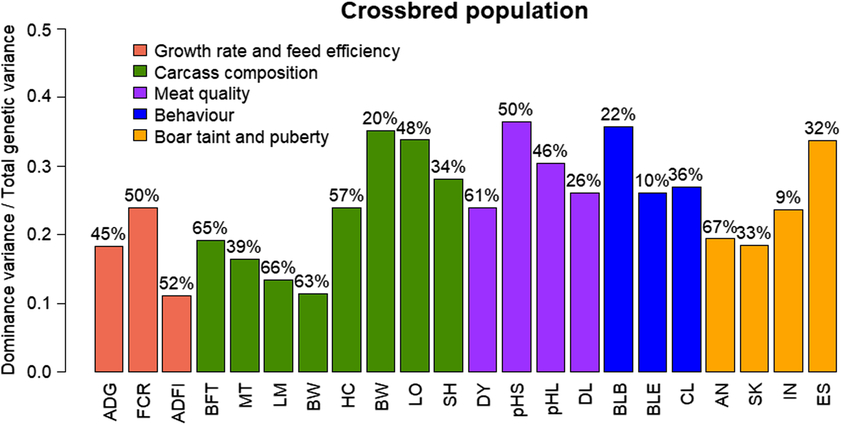
Ratios of dominance deviation variance with respect to the total genetic variance (additive plus dominance deviation genetic variance) for the 22 analysed traits are represented for the PB population in Figure 1 and for the CB population in Figure 2 (percentages above the bars indicate the amount of phenotypic variance that is due to total genetic variance). Some of the traits showed a relevant amount of dominance deviation variance in the PB population (> 10% of the phenotypic variance). The dominance deviation variance represented up to a 40% of the total genetic variance in BLB, but this result should be taken with caution as the total genetic variance estimated for this trait was low and estimated inaccurately. The pHS also showed a strong dominance component with respect to the total genetic variance (over 30%). In the CB population, LO, pHS, pHL and ST had more than 30% of the total genetic variance due to dominance deviation variance. The pHS had the highest proportions of dominance deviation variance in both populations, representing 38% and 50% of the phenotypic variance due to genetic effects (in PB and CB, respectively).
Ratios of dominance deviation variance with respect to the total genetic variance estimated in the purebred pig population. Percentages above the bars indicate the amount of phenotypic variance that is due to total genetic variance. Source: average daily gain (ADG), feed conversion ratio (FCR), average daily feed intake (ADFI), backfat thickness (BFT), muscle thickness (MT), % lean meat (LM), backfat weight (BFW), ham cut (HC), belly weight (BW), loin (LO), shoulder (SH), dressing yield (DY), pH of the longissimus dorsi muscle (pHL), pH of the semimembranosus dorsi muscle (pHS), drip loss (DL), number of body lesions at the beginning of growth (BLB), number of body lesions at the end of growth (BLE), carcass lesions (CL), androstenone level (AN), skatole level (SK), indole level (IN) and estradiol level (ES).
Ratios of dominance deviation variance with respect to the total genetic variance estimated in the crossbred pig population. Percentages above the bars indicate the amount of phenotypic variance that is due to total genetic variance. Source: average daily gain (ADG), feed conversion ratio (FCR), average daily feed intake (ADFI), backfat thickness (BFT), muscle thickness (MT), % lean meat (LM), backfat weight (BFW), ham cut (HC), belly weight (BW), loin (LO), shoulder (SH), dressing yield (DY), pH of the longissimus dorsi muscle (pHL), pH of the semimembranosus dorsi muscle (pHS), drip loss (DL), number of body lesions at the beginning of growth (BLB), number of body lesions at the end of growth (BLE), carcass lesions (CL), androstenone level (AN), skatole level (SK), indole level (IN) and estradiol level (ES).
Purebred v. crossbred variance components
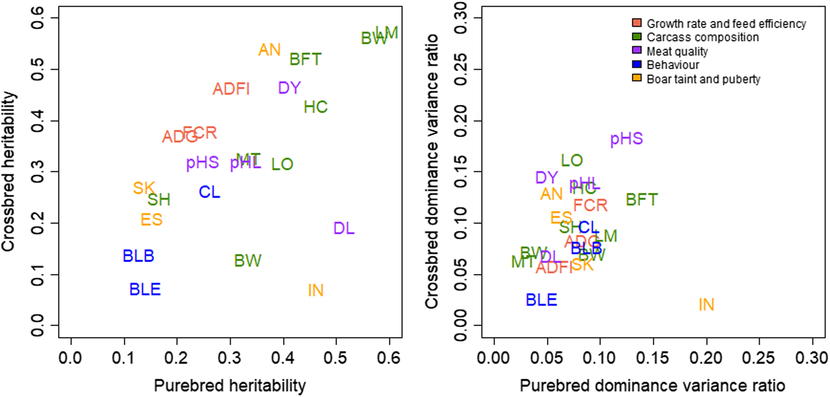
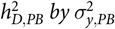
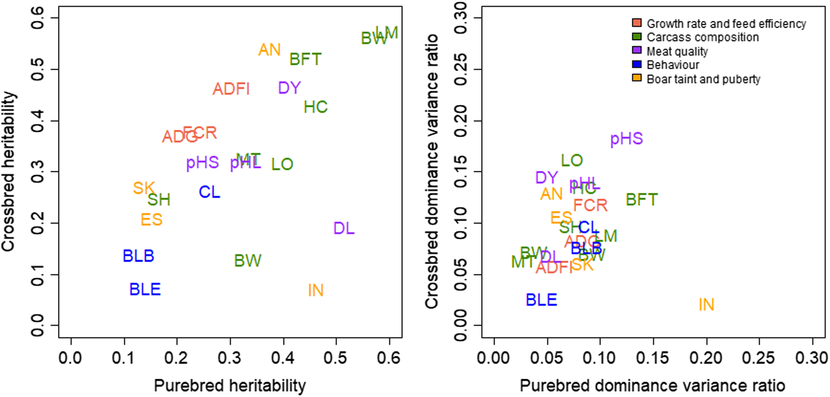
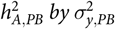
Figure 3 depicts the scatterplots between the PB and CB heritabilities and the PB and CB ratios of dominance deviation variances for all the traits. For most of the analysed traits, PB and CB heritabilities were of similar magnitude except for BW, DL and IN that, as commented earlier, presented unusual values either in PB or in CB populations. For most traits, the additive genetic variance was higher in the CB than in the PB population (additive genetic variance can be retrieved after multiplying
 $h_{A,PB}^2$ by $\sigma _{y,PB}^2$
and
 $h_{A,CB}^2$ by $\sigma _{y,CB}^2$
from Table 3 for PB and CB, respectively). This indicates that the gamete effect of the PB population is not the same when mated within the PB than mated to gamete of another population to produce the crossbreds.
Scatterplots between the purebred and crossbred heritabilities and purebred and crossbred ratios of dominance deviation variances with respect to phenotypic variance in several pig traits. Source: average daily gain (ADG), feed conversion ratio (FCR), average daily feed intake (ADFI), backfat thickness (BFT), muscle thickness (MT), % lean meat (LM), backfat weight (BFW), ham cut (HC), belly weight (BW), loin (LO), shoulder (SH), dressing yield (DY), pH of the longissimus dorsi muscle (pHL), pH of the semimembranosus dorsi muscle (pHS), drip loss (DL), number of body lesions at the beginning of growth (BLB), number of body lesions at the end of growth (BLE), carcass lesions (CL), androstenone level (AN), skatole level (SK), indole level (IN) and estradiol level (ES).
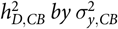
For many traits, the dominance deviation variance was higher in the CB than in the PB population (dominance deviation variance can be retrieved after multiplying
 $h_{D,PB}^2$ by $\sigma _{y,PB}^2$
and
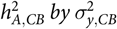 $h_{D,CB}^2$ by $\sigma _{y,CB}^2$
from Table 3 for PB and CB, respectively). Hence, 8 out of 22 of the analysed traits in the CB population showed a dominance variance significantly different from zero (Table 3) compared to only 3 traits out of the 22 in the PB population. Some of the traits showed similar amount of dominance genetic variance with respect to the total phenotypic variance in both populations (i.e. FCR 9% to 12%, BFT 14% to 12%, PB-CB respectively, Table 3). Other traits showed increased amount in crossbreds (i.e. HC 8% to 14%, LO 7% to 16%, pHS 13% to 18%, pHL 9% to 14%, AN 5% to 13% and ES 6% to 11%, in PB-CB respectively, Table 3). Only IN had a higher ratio of dominance genetic variance in purebreds compared to crossbreds (20% to 2%, PB-CB, respectively). Nevertheless, results obtained for this last trait should be taken with caution because of its unusually high estimated values.
Inbreeding depression
The genomic inbreeding coefficient (f) was on average 0.66 (with a range of 0.55 to 0.72) for the purebreds and 0.58 (with a range of 0.40 to 0.66) for the crossbreds indicating that purebred individuals had a higher proportion of homozygote loci than the crossbreds, as expected.
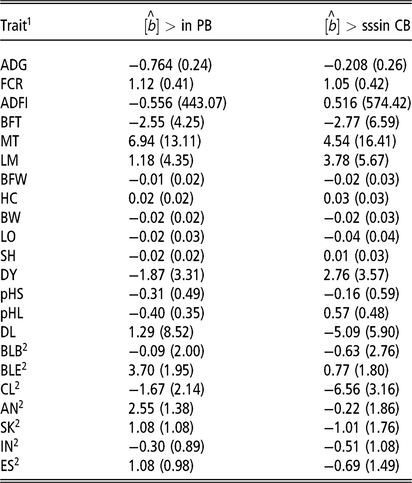
Table 4 shows the inbreeding depression parameter estimates (b) for the different traits in the two populations. The posterior standard deviation (PSD) of the parameter estimate was very large for most of the traits, indicating that estimates were very inaccurate and probably not different from zero. The inbreeding depression, expressed as the change in phenotypic mean per 10% increase in inbreeding, had a detrimental effect on ADG equal to –76.4g/day and −20.8g/day on the PB and CB phenotypic means, respectively (although PSD for the CB estimate was very large). The inbreeding depression also had a detrimental effect on FCR. Using a multiple trait model including dominance effects and inbreeding depression fitted as the overall homozygosity for the individual, Xiang et al. estimated a negative inbreeding depression coefficient on litter size of different magnitude in three pig populations (Xiang et al., Reference Xiang, Christensen, Vitezica and Legarra2016a).
Genomic inbreeding depression parameter (posterior standard deviation) estimated in purebred (PB) and crossbred (CB) populations for the different pig traits

1 Average daily gain (ADG, kg/day), feed conversion ratio (FCR, kg/kg), average daily feed intake (ADFI, kg/day), backfat thickness (BFT, mm), muscle thickness (MT, mm), % lean meat (LM, %), backfat weight (BFW, kg/kg), ham cut (HC, kg/kg), belly weight (BW, kg/kg), loin (LO, kg/kg), shoulder (SH, kg/kg), dressing yield (DY, kg/kg), pH of the semimembranosus dorsi muscle (pHS, pH units), pH of the longissimus dorsi muscle (pHL, pH units), drip loss (DL, %), number of body lesions at the beginning of growth (BLB), number of body lesions at the end of growth (BLE), carcass lesions (CL), androstenone level (AN), skatole level (SK), indole level (IN) and estradiol level (ES).
2 In natural logarithmic scale.
Conclusions
The present study has assessed the contribution of the additive and dominance genetic variances to the PB and CB phenotypic variance of 22 traits related to growth and feed efficiency, carcass composition, meat quality, behaviour, boar taint and puberty. The estimated PI and LW allelic contributions to the CB variance were of about the same magnitude in all the traits. Among the analysed traits, we have not encountered a clear common pattern of dominance expression between groups of analysed traits and between population types. Some of the analysed traits show a relevant amount of variance due to dominance such as BFT, pHS and pHL. Despite the uncertainty of the estimates because of model complexity and the limited amount of data available, this study gives a picture about the influence of dominance variance in the phenotypic expression in a wide range of traits of different nature. For the traits most influenced by dominance effects, it would be of interest to evaluate the impact of accounting for non-additive genetic effects on GEBV accuracy, as well as the interest to exploit these non-additive genetic effects to maximize the total genetic merit of the individuals by means of assortative matings, especially in crossbred populations. Finally, with more data, a proper estimation of the genetic correlation between additive and dominance deviation effects between the two populations would have certainly contributed to give some insights about the impact of the use of crossbred information to evaluate the purebred candidates for crossbred performance.
Acknowledgments
Preliminary results have been published in an abstract form (Tusell et al. Reference Tusell, Gilbert, Vitezica, Mercat, Legarra and Larzul2017). The authors acknowledge funding from the UtOpIGe ANR-10-GENOM_BTV-015 project and the INRA SelGen metaprogram projects (SelDir and OptiMAGicS), Alliance R&D and Feed-a-Gene (EU H2020 Program number 633531). The authors are grateful to the French breeding companies of the Alliance R&D association (Axiom, Choice Genetics France, Nucléus, IFIP) for providing the animals and to the staff of the test station of Le Rheu for collecting the data. The authors are grateful to Ingrid David for providing expertise in model comparison via restricted likelihood ratio test. We are also grateful to the GenoToul bioinformatics platform Toulouse Midi-Pyrenees for providing computing and storage resources and to Ignacy Misztal and coworkers for the blupf90 suite of programs.
L. Tusell Palomero 0000-0003-2419-7330
Declaration of interest
The authors declare no conflict of interest.
Ethics statement
The experiment was conducted according to the French guidelines for animal care and use (http://ethique.ipbs.fr/sdv/charteexpeanimale.pdf).
Software and data repository resources
None of the data were deposited in an official repository.