1. Introduction
Academic scientists are under great pressure to be ‘research active’ (e.g. Lawrence, Reference Lawrence2007; Edwards & Roy, Reference Edwards and Roy2017); their primary aim is therefore to regularly report significant discoveries. If successful, it helps with securing jobs, gaining tenure, achieving promotion, obtaining post-retirement contract extensions and acquiring grants. Additionally, there are individuals who are driven to publish in the highest-profile journals (see Reich, Reference Reich2013), and/or to compete for prestigious awards.
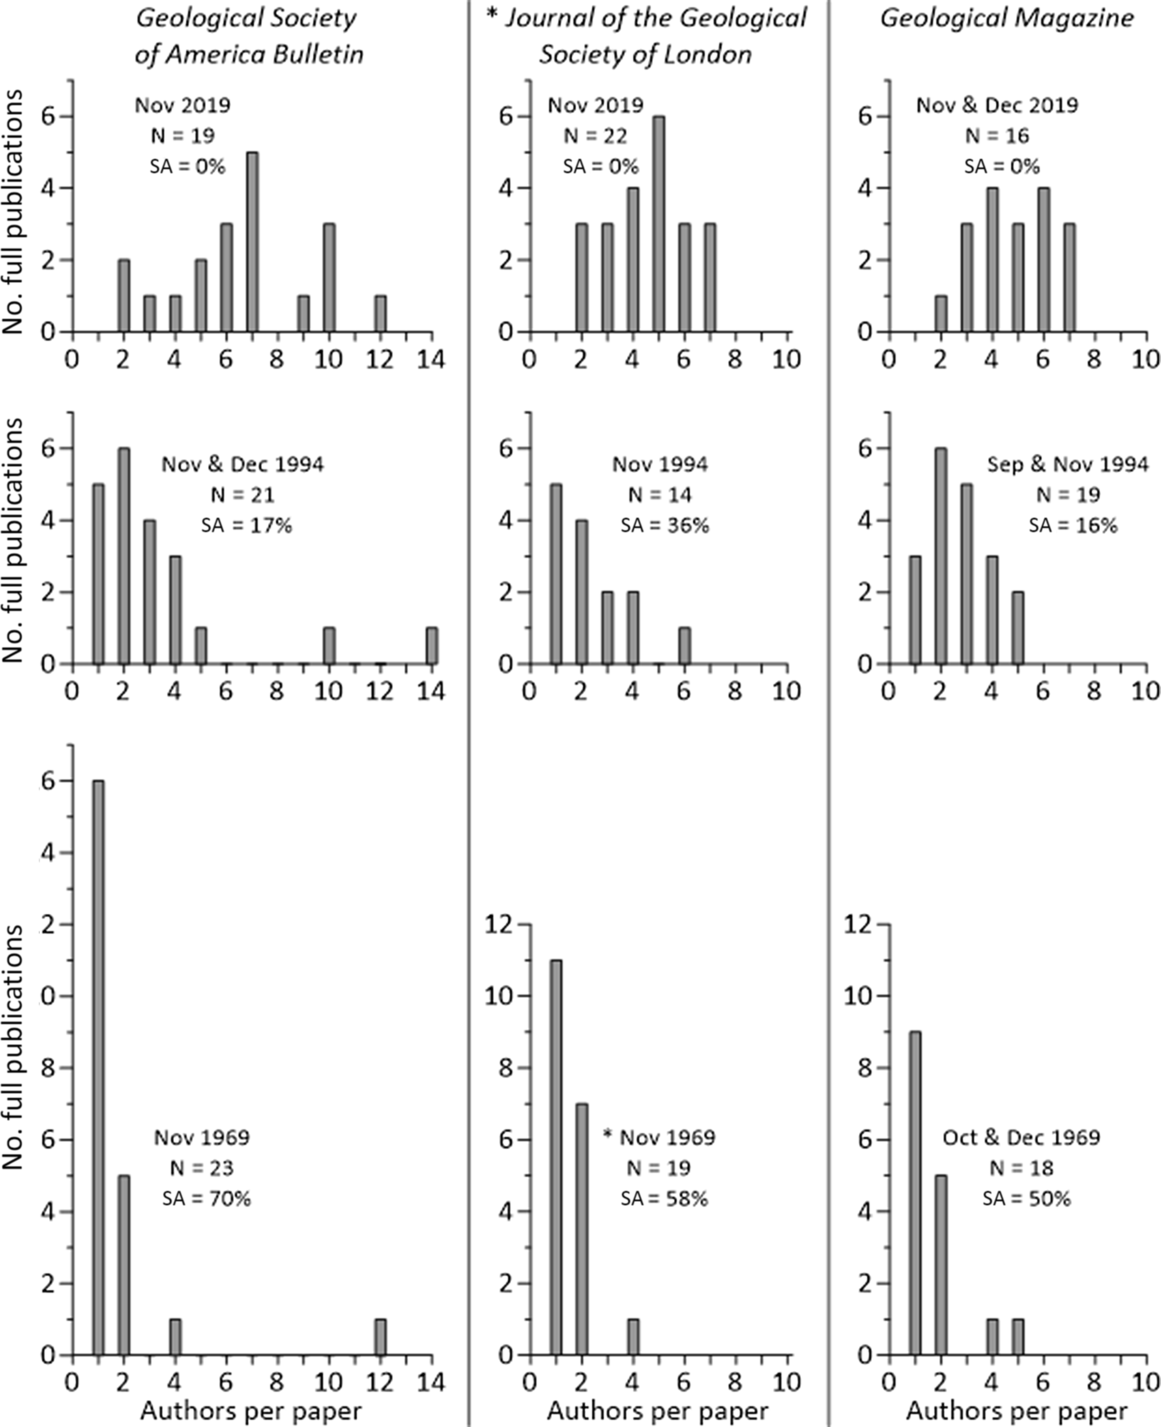
Today, geoscience research publications tend to be written by four- to seven-person teams; solo efforts are rare (Fig. 1). The situation is very different from that 50 years ago when articles were composed by individuals and, to a lesser extent, duos; few outputs had three or more authors (Fig. 1). The data for 1994 suggests that the shift seems to have been steady; in that year, there were typically 1–4 contributors (Fig. 1). A consequence of enlarged author lists, which is ubiquitous across the science, technology, engineering and mathematics (STEM) subjects (although possibly not to the same extent in mathematics), involves the reporting and recording of author contributions, some qualitative and others quantitative. For instance, papers in most journals now require statements explaining who was involved with the various elements of the study, namely its conceptualization, research design, fieldwork/primary data collection, experimental work, analyses and writing (e.g. Cozzarelli Reference Cozzarelli2004; Allen et al. Reference Allen, Brand, Scott, Altman and Hlava2014; McNutt et al. Reference McNutt, Bradford, Drazen, Hanson, Howard, Hall Jamieson, Kiermer, Marcus, Kline Pope, Schekman, Swaminathan, Stang and Verma2018; Appendix). My institution, the University of Hong Kong, has a research-output recording system that assigns equal weighting to each of the authors on a publication, regardless of their contributions. It should perhaps be noted, however, that the data are used principally to convey to the Hong Kong government and its associated agencies its overall efficiency; the relatively simple distillation of its researchers’ activities is presumably adequately informative. With promotion and/or tenure applications, however, faculty are tasked with supplying their percentage contributions to each refereed output, although not the values for their co-authors. Elsewhere, as part of the Australian Research Council’s most recent (2018) Excellence in Research for Australia census, all people listed on those publications that were submitted for appraisal were weighted equally, irrespective of each individual’s input. Colleagues have intimated that this incentivized collaboration, but that it also led to gaming in the form of ‘gifted’ authorships.
Histograms showing the increasing sizes of teams authoring Earth science publications over the last 50 years. The data (for late 1969, late 1994 and late 2019) are from the Geological Society of America Bulletin (established in 1890), the Quarterly Journal of the Geological Society of London/Journal of the Geological Society of London (established in 1845/1971) and the Geological Magazine (established in 1864). With the 1969 and 1994 publications (lower and middle rows), only full papers are considered (discussions, comments, replies, book reviews, etc. are not). With each plot, the percentage of single-author papers (SA) is also shown.

It is my suspicion that the research publishers, home institutes and research funders will in the not-too-distant future ask authors to provide contribution proportions for the articles they submit/publish (see also Verhagen et al. Reference Verhagen, Wallace, Collins and Scott2003; Rahman et al. Reference Rahman, Regenstein, Kassim and Haque2017). It would be akin to the supplying of grant information, detailing the authors’ roles in specific parts of the study, and making declarations on ethics compliance and conflicts of interest. To this end, the results of a survey outlining the contribution distributions associated with Earth science research articles are presented. I posit that if the requesters of such information already have an appreciation of the general patterns within the subject, then any schemes that are introduced will be optimally developed. Moreover, the findings should be useful to author teams trying to establish their quantitative inputs to a study. I end this article by presenting a modified H-Index that weights a researcher’s core papers based on their contributions to them.
2. Methods
In late March – early April 2020, individual email requests were sent out to 45 Earth science colleagues inviting them to participate in a survey on author inputs. At that time, many countries had just imposed coronavirus disease (COVID-19) lockdowns; most recipients formed a captive audience. Notably, I knew all researchers sufficiently well to address them by their first names. The senior members of the recipient pool were awarded their doctorates in the 1970s; the youngest received theirs in 2014. Most could be categorized as ‘mid- to late-career’. Another consideration was the desire to minimize instances of respondents sharing publications; workers with links to the same research groups were therefore avoided. Moreover, because the survey was a peer-to-peer request and not a top-down demand, it was thought that the issue of contributors inflating their stated inputs would be reduced (anecdotal evidence indicates this is common when rewards or opportunities are at stake). Based on their work locations, the breakdown by geographical region is: Asia, 13; Australasia, 10; Europe, 12; and North America, 10.
Recipients were asked to compile author-list number and author-contribution percentage data for up to 10 fully refereed papers (specifically, no conference abstracts) that were published between January 2015 and December 2019, inputting the values to a structured Excel file that I provided. At this juncture, it is worth emphasizing that Earth scientists spend their careers handling imprecise data. For instance, our conversations are littered with phrases such as ‘a 12- to 15-m-high river bluff’, ‘southwest-directed palaeocurrents’, or ‘beds dipping 50–70 degrees towards the north and northeast’. I therefore assert that, within the STEM subjects, our community’s members are well qualified to estimate the percentage contributions made by a member of a research team, perhaps via the labels ‘all’, ‘the most’, ‘a sizable fraction’, ‘a fair bit’ or ‘only a small amount’. To reduce article-selection bias, the recipients were advised to choose outputs that formed a continuous chronological sequence. This, it was thought, would avoid them simply listing their best works. Instead, it had a good chance of encapsulating a variety of publications: some with a few authors, others with many, some where the respondent was a leading player and others where they had a lesser role. The survey was close to being fully anonymous as author names and publication dates were not required. To add a further level of privacy, it was suggested that the participants randomized the sequence in which they listed each article’s author inputs (obviously, those with unusual author numbers would be identifiable, but there was zero motivation for me to do this). Upon receipt of the data records, each portfolio was allocated a three-letter code in order to mask its source for presentations such as this. In total, 26 replies were received (>57%) from Asia (9), Australasia (8), Europe (5) and North America (4). Moreover, several respondents highlighted various matters associated with their submissions, although such information had not been requested.
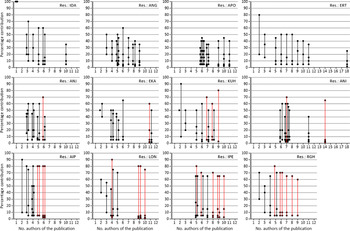
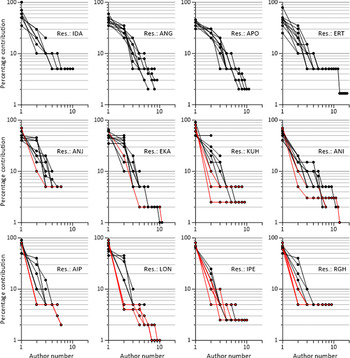
In processing the data, the first, second, third authors etc. were deemed to be those with the highest, second-highest and third-highest percentage contributions etc., not their positions on the list (however, the two correspond for more than seven out of eight publications). The first stage of the analysis involved deducing the basic author-list inputs for the various articles in each researcher’s portfolio. To this end, two sorts of line-plot were used. The first involved plotting the author contributions for each paper against the number of authors (Fig. 2). However, although much useful information is provided, some is obscured when two or more authors contributed identical amounts. To circumvent this, sister plots were generated for each individual researcher in which contribution as a percentage was plotted against author number for every article published (Fig. 3).
Examples of the researcher-contribution data plotted according to article author number. Where there are two or more publications with the same number of authors, small offsets are made along the x-axes. The articles associated with the four portfolios in the top row all have balanced lists. Those in the lower row each contain four or more imbalanced author lists, each of which is shown with red lines/symbols. The middle-row portfolios have between one and three imbalanced author contributions.


The next level of processing involved combining the data from the various respondents. Separate line-plots were used to summarize the contributions of the ‘first to third’ and ‘fourth and fifth’ authors, and these were accompanied by a histogram showing the distribution of the author-team sizes. Here, the data are presented for publications with 1–11 authors. There were publications with 12 or more co-workers, including one with 40, but because there were so few it would have been impossible to extract any meaningful information from them; they were therefore omitted from the analysis. Most articles had at most seven authors (see below); interpreting those with eight authors or more therefore needed to be tempered by the fact that their associated mean values and standard deviations were based on reduced numbers of data records.
3. Results
3.a. Relationship between author contribution and list position
As stated in the previous section, the convention with Earth science publications is for a particular author’s input to be reflected by their position in the list of authors, with the highest contribution assumed for the first author. This idea is strongly supported by the data supplied for this study. Of the 254 survey-pool articles, only 31 (12.2%; from 15 researchers) did not adhere to this rule. In fact, 12 of those works were published by the same two researchers, one of whom has a strong palaeo-biological slant (in the biological sciences, the correspondence author is often the leader of the research team; almost invariably, they are the last author listed). There were only four articles where the first-listed author did not have the greatest input. There were just 12 cases where the last author’s contribution is the second highest, and 1 case (a two-author publication) where the last author was the leading player.
3.b. Allocation of author contributions
When discussing the contributions of research team members, author lists are described as either ‘imbalanced’ or ‘balanced’. The former applies to articles with five or more contributors with a ≥60% difference in contribution between the first and second authors and/or when there is a ‘tail’ of four or more authors each with ≤5% contribution (see Figs 2, 3). However, one four-author paper is also included as the inputs were 90%, 4%, 4% and 2%. On the log-log plots shown in Figure 3, the imbalanced works exhibit a distinctive concave trace relative to the origins of the plots. In contrast, articles with balanced author contributions show smaller disparities within the larger teams. The category also accommodates, for example, a two-author publication with 90% and 10% contributions (Researcher KUH), as well as two researchers each with one thee-author paper with inputs of 60%, 39% and 1% (EDS and NTO). At the other end of the scale, Researcher ERT reported an 18-author work where the percentage for the first-listed person was just 25%; Researcher AHR included a publication with inputs of 30%, 10% and 5×12%. Notably, the balanced outputs in Figure 3 have linear or convex trajectories relative to the origins of the plots.
In terms of researcher portfolios, three sorts are recognized: those comprising exclusively balanced lists (14 researchers, namely ANG, APO, DEL, DIA, DNE, EDS, ERT, IDA, KLA, NBE, NSW, OKF, OSA and RPO); those with one to three publications with imbalanced contributions (7 researchers, namely AHR, ANI, ANJ, EKA, LAI, KUH and NTO); and those with four or more imbalanced works (5 researchers, namely AIP, EBI, IPE, LON and RGH). Notably, members of the last group also tended to have a number of marginal records. Four examples of each of these three cases are shown in Figures 2 and 3.
The imbalanced lists result from either estimation problems or too many authors. Concerning the former, it is common for researchers to inflate their inputs on publications where they played a prominent role (see Herz et al. Reference Herz, Dan, Censora and Bar-Haima2020). Aside from it bolstering their contributions, this also acts to flatten those of their co-authors. A second somewhat unusual estimation issue was highlighted by one survey-pool member (RGH) who, when they felt unable to judge their colleagues’ inputs to a work, then applied a stock algorithm (perhaps when most or all of their collaborators were contributing remotely). This involved assessing their own input, then apportioning 5% to their co-authors except for the lead author, who was then allocated the remaining fraction. A consequence was that some article teams had many members with 5% contributions. As will be seen below (Sections 3.b.1–3.b.4), however, when establishing the roles of the lesser authors on a manuscript this approach is not nearly as blunt as it might appear, delivering numbers that are comparable to those who felt they could establish the inputs.
Concerning excessive authors, there appears to be three reasons for why this arises. The first is when publications are subject to a formally imposed whole-group authorship arrangement. For example, the Science paper of Larsen et al. (Reference Larsen, Saunders, Clift, Beget, Wei and Spezzaferri1994) was speedily assembled by a small group of sedimentologists and biostratigraphers who were sailing on Ocean Drilling Program Leg 152 (September–November 1993), but the related discovery that was published in May 1994 was credited to the entire shipboard scientific party (28 members, including myself). Second, many Earth scientists operate in a world where at times it is expedient to expand the author list if it facilitates access to a restricted region or specialist equipment. Third, some colleagues, especially junior researchers, work in environments where they have minimal control over the authorship lists and are obliged to involve mentors and various associates. Tellingly, several respondents drew attention to this. It should be noted, however, that in some cases they are ‘victims’ (when they are a leading contributor), but in others they may benefit from the arrangement, although they might not necessarily approve.
3.b.1. All data records
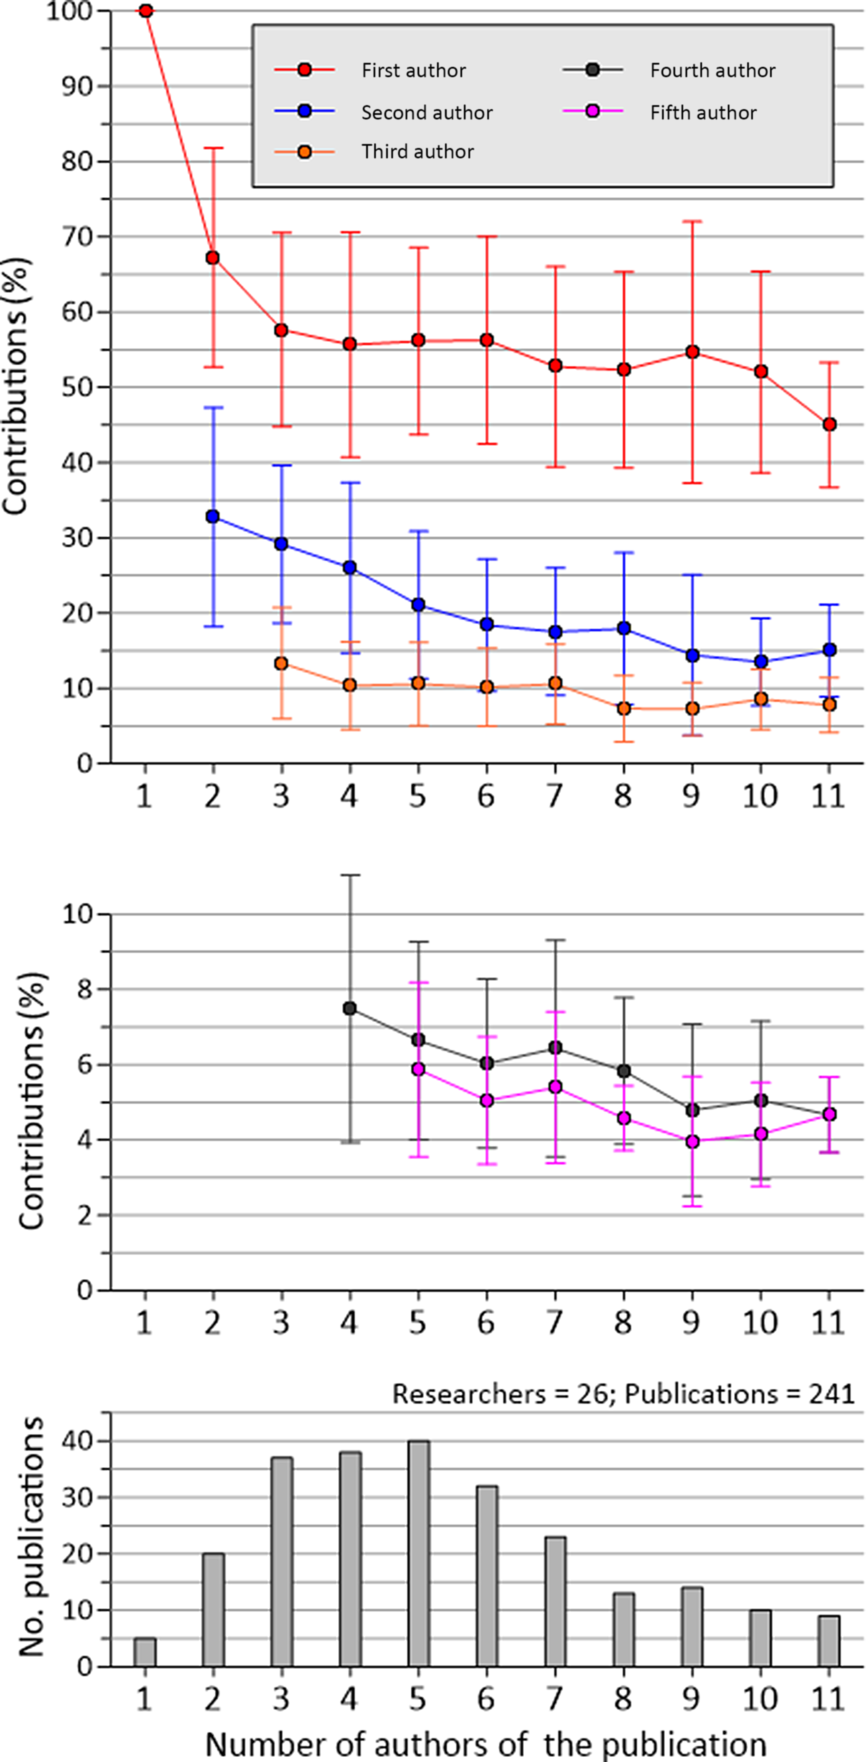
The data for all of the survey-pool articles with 11 or fewer authors (N = 241) are plotted in Figure 4 (see also Fig. 5), including balanced and imbalanced author lists. The contributions of the first authors range from 67% for a two-author work to 58–52% for 3–10 authors. For the second author, the contributions are 33% and 29–14%, respectively; the contributions of fifth authors were reported to be 6–4% for publications with 3–10 authors.
Summary of the author contributions for the entire survey set for publications with ≤11 authors. The roles of the first through third authors are shown in the upper plot, and those of the fourth and fifth authors in the middle plot; the error bars indicate the standard deviations. The bar chart shows the numbers of publications for the different-sized author teams.

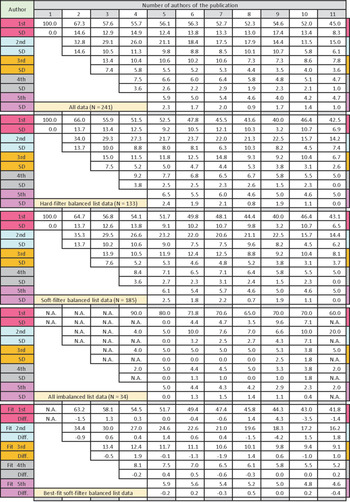
Summary of the synthesized survey-pool data used in Figures 4, 6, 7 and 8 and the best-fit data in Figure 9. For the first four blocks, the associated standard deviation (SD) is provided below each averaged value. For the last block, below each best-fit value is the difference between it and the associated mean of the source data for the soft-filter balanced author lists. NA – not applicable.

3.b.2. Hard filter
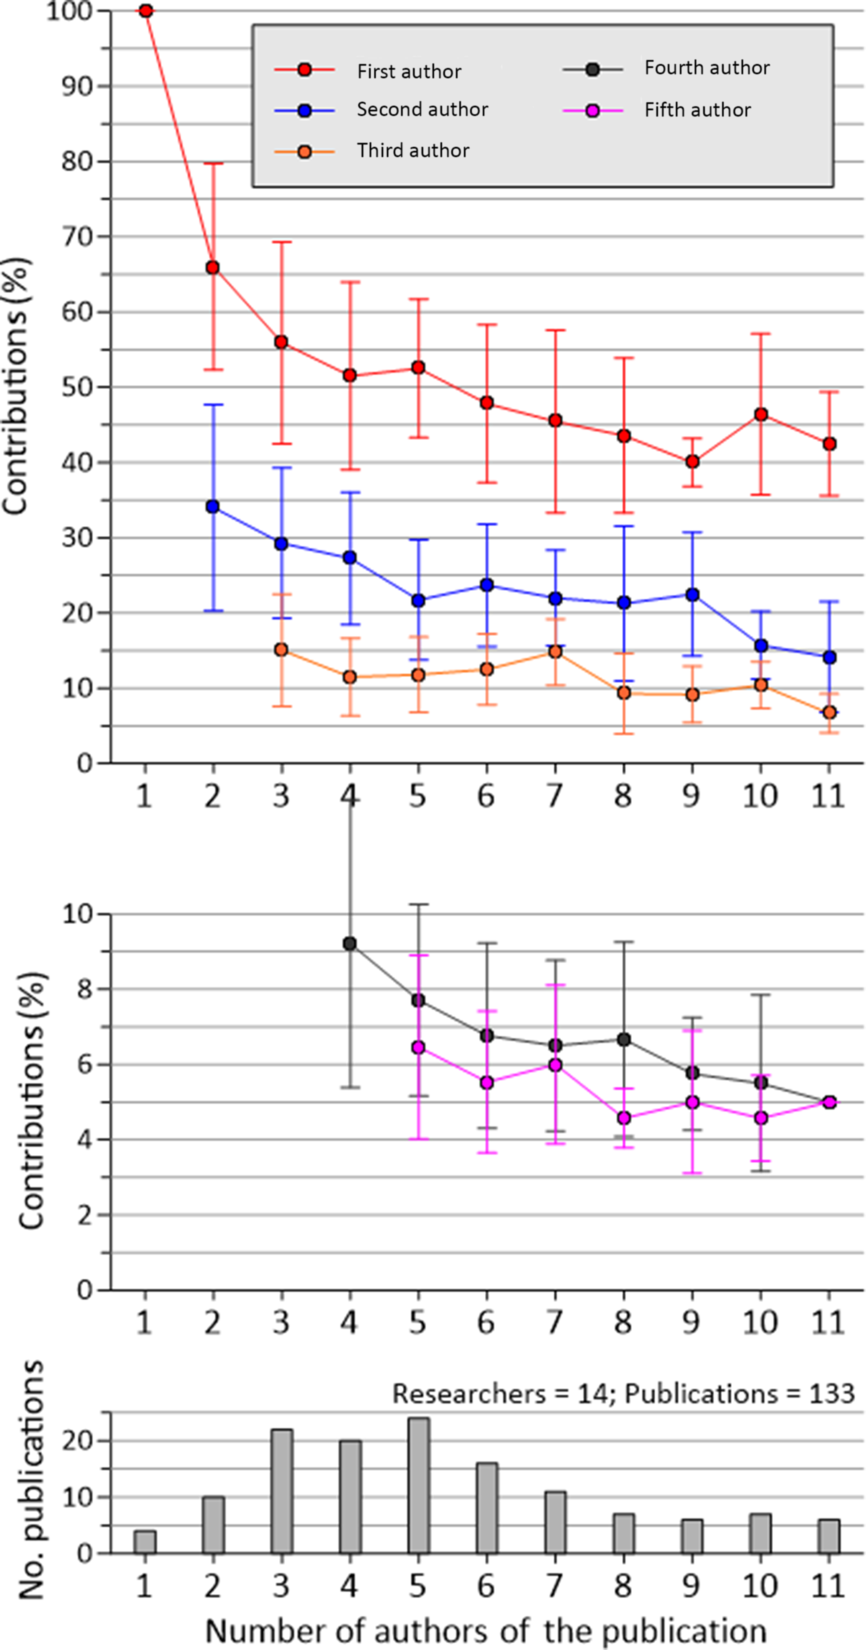
A hard filter excludes all of the records from the 12 survey respondents with one or more imbalanced lists. This leaves 133 publications to draw upon from the 14 researchers with exclusively balanced author-list portfolios (Fig. 6; see also Fig. 5). The contributions of the first authors range from 66% for a two-author work to 56–40% for 3–11 authors. For the second author, the contributions are 34% and 29–14%, respectively; fifth author contributions were reported to be 7–5% for publications with 3–11 authors.
Summary of the author contributions for publications with ≤11 authors for those researchers with no imbalanced list records. The roles of the first through third authors are shown in the upper plot, and those of the fourth and fifth authors in lower plots; the error bars indicate the standard deviations. The bar chart shows the numbers of publications for the different-sized author teams.

3.b.3. Soft filter
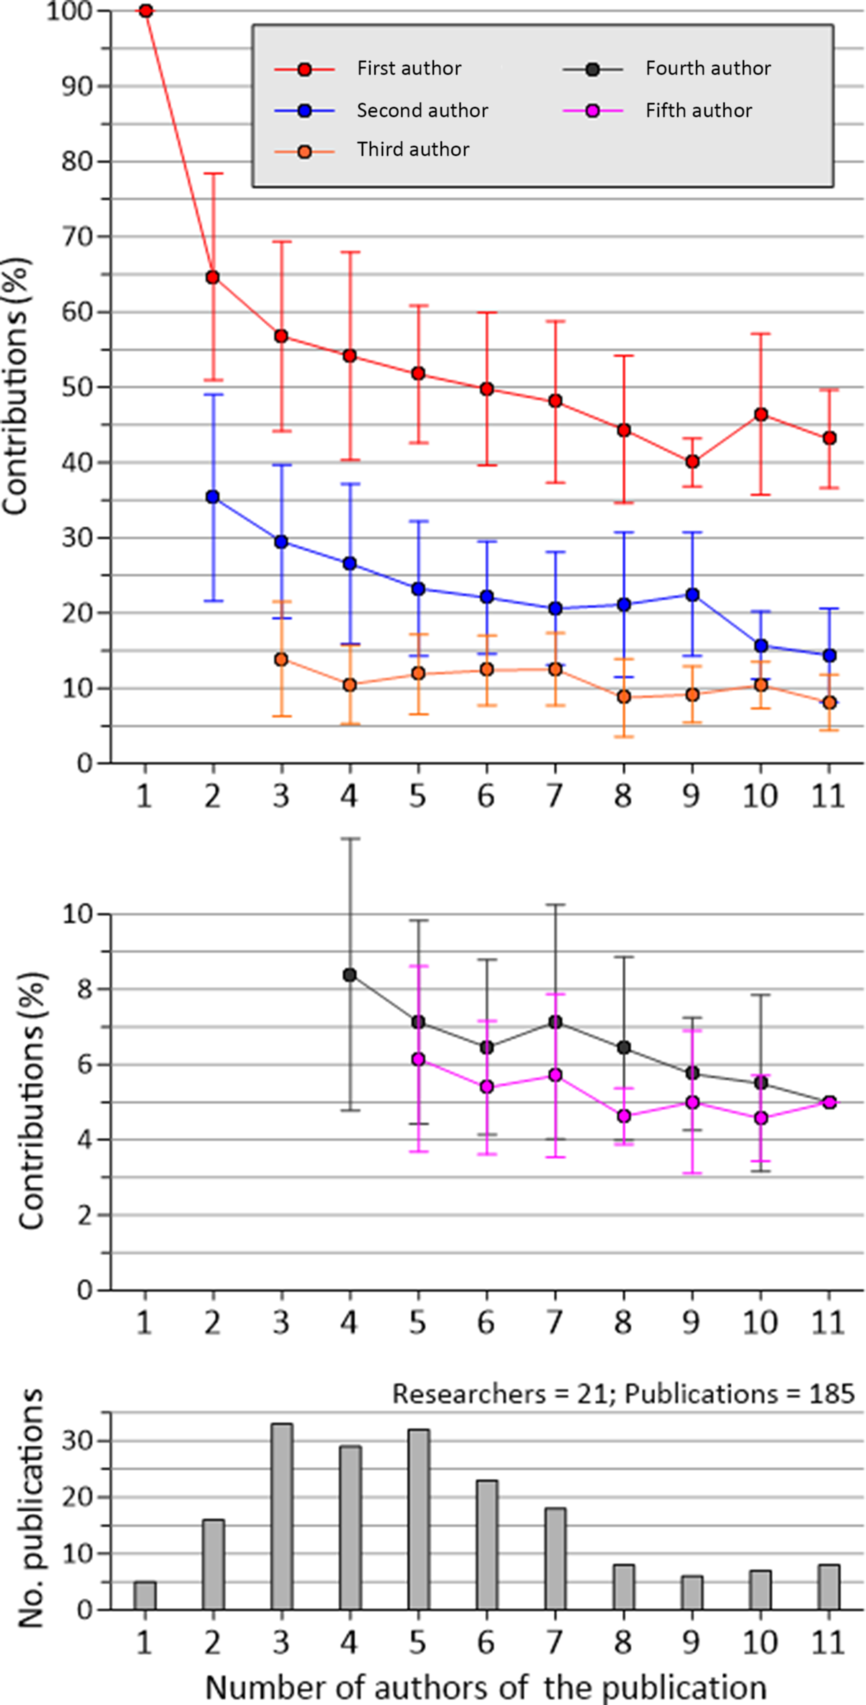
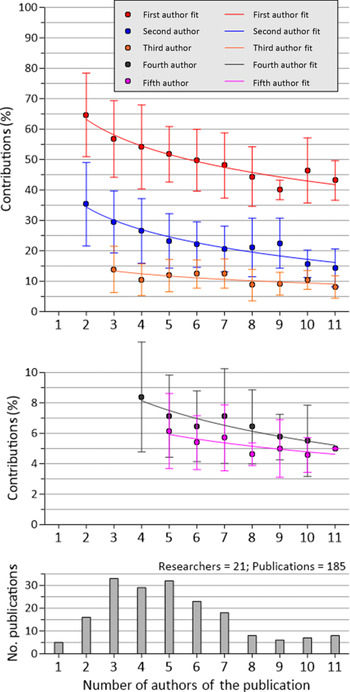
The application of a soft filter adds to the restricted dataset defined in the preceding section 52 balanced list records from the seven survey-respondents with three or fewer imbalanced records (Fig. 7; N = 185; see also Fig. 5). The balanced list articles from the five researchers with four or more imbalanced list articles were not included, however, as many of their other works are borderline imbalanced and any sifting would be challenging and somewhat arbitrary (see the lower-row plots in Fig. 2). The contributions of the first authors range from 65% for a two-author work to 57–40% for publications with 3–11 authors. Unsurprisingly, the range of numbers is similar to that associated with the hard filter, but the curve is somewhat smoother for publications with two to seven co-workers. For the second authors, the contributions are 35% and 30–14%, respectively; the contributions of the fifth author were reported as 6–5% for publications with 3–11 authors.
Summary of the author contributions for publications with ≤11 authors for those researchers with purely balanced lists plus those with three or fewer imbalanced lists where the biased article records have been removed. The roles of the first through third authors are shown in the upper plot, and those of the fourth and fifth authors in the lower plot; the error bars indicate the standard deviations. The bar chart shows the numbers of publications for the different-sized author teams.

3.b.4. Imbalanced author-list publications
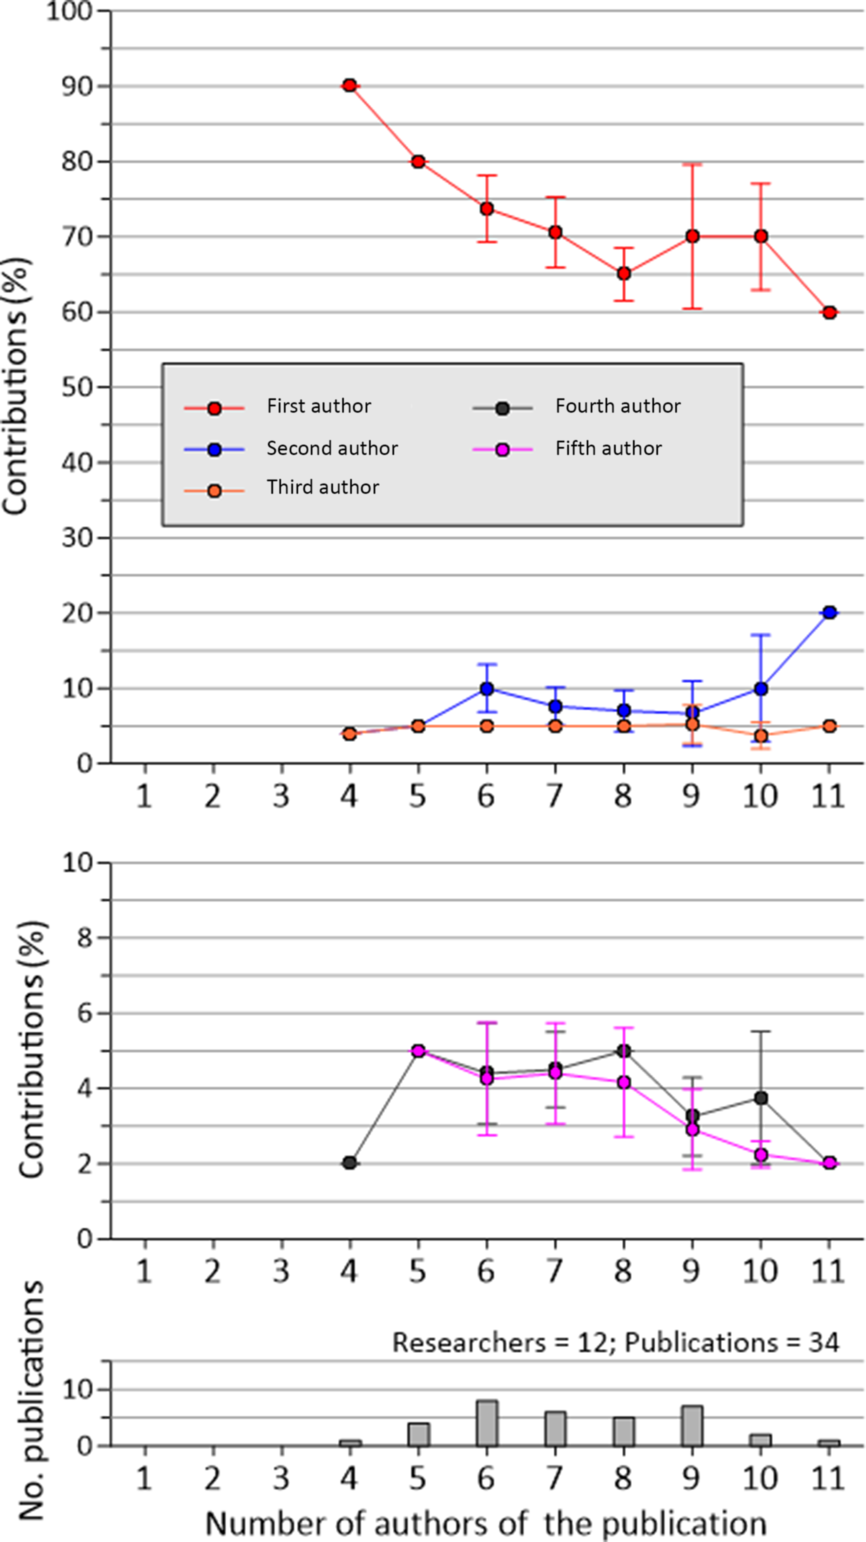
To close the Results section, I consider those articles with imbalanced author lists (Fig. 8; N = 34; see also Fig. 5). In exploring the main features, it is useful to compare the data with those presented in the previous section. Notably, the first author inputs are significantly larger (cf. Fig. 6): 90% for a four-author work to 80–60% for publications by 5–11 authors. Consequently, the lesser contributors play only minor roles, with just 5% for the third authors.
Summary of the contributions of the articles with imbalanced author lists for publications with 4–11 authors. The roles of the first through third authors are shown in the upper plot, and those of the fourth and fifth authors in the lower plot; the error bars indicate the standard deviations. The bar chart shows the numbers of publications for the different-sized author teams.

4. Discussion
4.a. Survey results provide guidance values
The survey results provide insights into geoscience workers’ contributions to research publications. First, the vast majority of researchers uphold the tradition of ordering their lists based on input: most is first, least is last. Second, and perhaps more importantly, we now have a firm idea about the range of proportional contributions based on a researcher’s position on the author list and the number of workers who were involved. For example, with a team of six there is a high expectation that the contributions of the first five will be 39–60%, 14–30%, 8–17%, 4–9% and 4–7%; 10-person collaborations will have numbers that are a little less. We should also be aware that author teams of five or more might include publications with lists that are heavily imbalanced. Here, one or two people will have led the work, but the rest will have contributed relatively little. Interestingly, 30 years ago Frederick Mumpton (Reference Mumpton1990, p. 632) in an editorial for the journal Clays and Clay Minerals opined: ‘I will not attempt to state what is an acceptable number of authors, but merely state that credibility decreases as the number increases beyond five or six.’ To this end, when we draft our manuscripts, I suggest that we first place all of our colleagues’ names in the acknowledgements section and, only with evident justification, should we transfer any to the author list. When considering the issue, it is worth noting that the difference between 0% and 1–3% is not very much. In such instances, inclusion on a publication where it is obvious that no substantive contribution was made is not going to make a career; correspondingly, an omission will not break one.
4.b. Best-fit data for the first five authors with soft-filtered balanced author lists
Using the data presented in Figure 5, best-fit data for the first five authors with soft-filtered balanced author lists are shown in Figure 9 (cf. Fig. 7). The derived log equation values (calculated using the GrapherTM software, where X is the total number of publication authors) are, for first, second, third, fourth and fifth authors: Y = −[12.581×ln(X)]+71.927 (with the single-author records removed); Y = −[10.673 × ln (X)]+41.773; Y = −[3.320 × ln(X)]+17.051; Y = −[2.897 × ln(X)]+12.164; and Y = −[1.655 × ln(X)]+8.592, respectively. The calculated numbers are also presented in the lower block of Figure 5, along with the differences between the source-data values. Notably, these offsets increase for publications with eight or more authors, presumably reflecting the marked reduction in data records.
Best-fit lines for the author contributions for publications with 2–11 authors for those researchers with purely balanced lists plus those with three or few imbalanced lists, where the biased article records have been removed. The roles of the first through third authors are shown in the upper plot, and those of the fourth and fifth in the lower plot; the error bars indicate the standard deviations calculated for the source data. The bar chart shows the numbers of publications with different-sized author teams.

4.b. Publications with two or more authors declaring an equal contribution
In recent years, a trend has emerged with some publications including statements declaring that two or more authors contributed equally (in a leading capacity). For example, Xu et al. (Reference Xu, Currie, Pittman, Xin, Meng, Lü, Hu and Yu2017) has three such authors from a total of eight. Using Figure 9, it is possible to estimate their efforts as the first three authors of eight-worker articles have inputs of c. 46%, 20% and 10%, the average being just over 25%.
4.c. Relevance to the other STEM subjects
Many of the other STEM subjects have author teams that are similar in size to those in the Earth sciences; the findings of this study may therefore be relevant to other disciplines. Perhaps the main issue concerns those fields where the last-listed author is deemed to have been either the principal or second-most important contributor. I therefore suggest that any associated survey ask for the input percentages as “first”, “last”, “second”, “third” etc. and process them using that ordering scheme. However, there exist some research areas that involve huge groups, for instance: those who worked on the Higgs’ Boson discovery (Aad et al. Reference Aad2015; more than 5100 authors); and those who were the first to detect a gravity wave that was induced by the merging of two black holes (Abbott et al. Reference Abbott2016; c. 1100 authors). Despite appreciating the incredible significance of these findings, as an outsider it is difficult to comprehend the associated credit/reward schemes. Moreover, in other subjects (e.g. conservation biology) there appear to be some high-profile publications where prominent figures are added to the author lists ostensibly to endorse the findings.
4.d. An author-contribution-weighted H-Index
Despite the misgivings of its inventor (Conroy, Reference Conroy2020), Jorge Hirsch’s H-Index (Hirsch, Reference Hirsch2005) is widely used to evaluate a STEM researcher’s impact. It features prominently on a person’s Google Scholar webpage, and is an integral feature of the Scopus and Web of Science bibliographic databases. When their score nudges up by a single point, some colleagues are known to celebrate ‘H-Index Day’. Discussion of a person’s H-Index is common during job searches and promotions. In 2012, Nature published an article summarizing a just-invented online app that aimed to predict a person’s future H-Index (Acuna et al. Reference Acuna, Allesina and Kording2012).
As the H-Index concept gained traction, however, its legitimacy began to be scrutinized. One consequence is that other metrics have been introduced, for example the Field-Weighted Citation Impact (FWCI) and the Relative Citation Ratio (RCR), to facilitate comparisons between workers in (1) different fields and (2) and through time (Purkayastha et al. Reference Purkayastha, Palmaro, Falk-Krzesinski and Baas2019). An obvious failing with the H-Index, as well as with the FWCI and RCR indices, concerns the role a researcher has played in their core publications, especially when it is small (e.g. Costas & Bordons, Reference Costas and Bordons2007; Kreiner, Reference Kreiner2018). Various weighting schemes have therefore been devised (e.g. Şekercioğlu, Reference Şekercioğlu2008; Zhang, Reference Zhang2009; Biswal, Reference Biswal2013), but all rely on a worker’s position within an author list and a series of assumptions, primarily subject-based, that are attached to it. An alternative approach would take the numerical data described above and use that to achieve the recalibration.
I therefore propose a modified H-Index metric that weights a person’s core papers according to their quantitative contributions to each article. Another consideration is that the H-Index core includes variably cited works. Those with the highest numbers are often of great value to the community (however, a small fraction may be highly contentious and referenced negatively). There will also be less impactful publications, which any scheme should accommodate. To explain, I use as an example a researcher with an H-Index of 30. A value of 30 is assigned to their highest-cited work, 29 to the second-highest, 28 to the third-highest, all the way down to 1. At this point, it is noted that the sum of 30+29+28+…+1 is 465, which I term the ‘ceiling value’. The next step involves taking each of the numbers and multiplying them by their associated fractional contribution, which is the percentage contribution divided by 100. The sum of all 30, which is termed the ‘contribution total’, will therefore be ≤ 465. If it is close to the ceiling value, then the researcher must have played a leading role in many of their publications. If, on the other hand, it is low, it indicates that their involvement was not so great. Multiplying the contribution total by the H-Index number and then dividing it by the ceiling value creates the researcher’s weighted H-Index.
To solidify the point, two demonstrations are presented, both involving people with H-Indexes of 30 and therefore, on paper, of a similar standing. The first researcher’s fractional contributions on the ranked papers are deemed to be 1.0 for 30–25, 0.8 for 24–19, 0.6 for 18–13, 0.4 for 12–7 and 0.2 for 6–1 (for clarity, most cited to least cited). Here, the contribution total is 351 and the weighted H-Index is (351×30)/465 = 22.6. The second researcher’s fractional contributions on the ranked papers are 0.2 for 30–25, 0.4 for 24–19, 0.6 for 18–13, 0.8 for 12–7 and 1.0 for 6–1. Here, the contribution total is 207 and the weighted H-Index is (207×30)/465 = 13.4. Clearly, the weighted H-Index of the second researcher is not nearly as impressive as that of the first.
The next stage of the presentation involves applying the scheme to a real situation. My Google Scholar page shows that I have an H-Index of 43. However, if I employ the best-fit, soft-filtered, balanced author list fractional contribution numbers in Figure 5 (see also Fig. 9), and apply to those publications with 12 or more authors fractional contributions of 0.02–0.04, then my recalibrated score is c. 13.8. The lowered number is sobering, and I would argue that the weightings on some of my first-author articles are undervalued, preferring instead to use specific values for particular publications. That said, the inescapable fact is that my H-Index core includes papers for which I had small to minimal inputs (e.g. Larsen et al. Reference Larsen, Saunders, Clift, Beget, Wei and Spezzaferri1994; Aubry et al. Reference Aubry, Ouda, Dupuis, Berggren, Van Couvering, Ali, Brinkhuis, Gingerich, Heilmann-Clausen, Hooker, Kent, King, Knox, Laga, Molina, Schmitz, Steurbaut and Ward2007; Wignall et al. Reference Wignall, Sun, Bond, Izon, Newton, Védrine, Widdowson, Ali, Lai, Jiang, Cope and Bottrell2009). Comfortingly, most modern-day Earth scientists would experience similar levels of correction. It is also worth emphasizing that workers who were prominent in earlier times, including those who led the plate-tectonic revolution, would emerge largely unscathed from such an evaluation as most of their outputs, if not all, were single-author efforts.
In summary, the advantages of the proposed weighted H-Index scheme are: (1) it is straightforward to explain; (2) once a publication’s fractional contribution is determined it is locked-in; (3) the ranking number can be quickly rearranged as the H-Index core articles leapfrog one another and new articles are added; and (4) for most of us working in today’s multi-author world, it is more reflective of our impact than the number generated by Hirsch’s algorithm.
5. Conclusions
Over the last half-century, the number of authors on Earth science research articles has grown from one or two to typically four to seven; 10 is not surprising. The survey of present-day authorship patterns provides insights into the quantitative contributions each of the members make. Although several or more people may feature on a manuscript, it is never a team of equals. Generally, the first and/or second authors lead the study with a sharp fall-off to a contribution of about 5% for the fifth. Also, our subject has an issue with imbalanced author lists, which results from publications having an excess/apparent excess of authors. In some instances, this is unavoidable. Where preventable, however, efforts should be made to trim the list to a sensible level; otherwise, the credibility of the group, its leader(s) and their science risks being undermined. There exist well-publicized guidelines for authorship inclusion (e.g. Cozzarelli Reference Cozzarelli2004; Allen et al. Reference Allen, Brand, Scott, Altman and Hlava2014; McNutt et al. Reference McNutt, Bradford, Drazen, Hanson, Howard, Hall Jamieson, Kiermer, Marcus, Kline Pope, Schekman, Swaminathan, Stang and Verma2018), their aim being to ensure that all of those associated with a manuscript have made real contributions to the study (also see Appendix). These should be at the forefront of our thinking as works are prepared for dissemination within the community. I have also proposed a modified H-Index that makes use of the author contribution data. Arguably, this will provide a more meaningful metric for evaluating an Earth scientist’s impact considering the fact that most of our outputs involve multi-person collaborations. Finally, if STEM researchers are eventually required to provide quantitative contribution information, it is hoped that the data and interpretations presented above will positively shape their introduction. Moreover, author teams tasked with estimating inputs to a specific publication should find the information useful.
Acknowledgements
Associated discussions with numerous colleagues are acknowledged. I am grateful to the 26 people who provided survey data, plus three others who courteously explained why they felt unable to do so. Several of those who supplied author-list contribution records also included contextual information; those unsolicited feedbacks were much appreciated. Shawn Wright, who did not participate in the study, directed me to the Mumpton (Reference Mumpton1990) commentary. Formal critiques by two referees helped to improve the manuscript.
Appendix
Declaration by McNutt et al. (Reference McNutt, Bradford, Drazen, Hanson, Howard, Hall Jamieson, Kiermer, Marcus, Kline Pope, Schekman, Swaminathan, Stang and Verma2018) on authorship: ‘Each author is expected to have made substantial contributions to the conception or design of the work; or the acquisition, analysis, or interpretation of data; or the creation of new software used in the work; or have drafted the work or substantively revised it; AND to have approved the submitted version (and any substantially modified version that involves the author’s contribution to the study); AND to have agreed both to be personally accountable for the author’s own contributions and to ensure that questions related to the accuracy or integrity of any part of the work, even ones in which the author was not personally involved, are appropriately investigated, resolved, and the resolution documented in the literature.’