Introduction
Optimising oilseed rape canopy size through correct management is crucial for maximising yield. Development of an over-large canopy at flowering can lead to yield reductions due to the formation of a thick flower layer which reflects much of the incoming light (Lunn et al., Reference Lunn, Spink, Stokes, Wade, Clare and Scott2001; Berry and Spink Reference Berry and Spink2009a). In turn, this reduces seed set and thus reduces yield potential. The production of an over-optimal canopy also increases the risk of lodging. Lodging is a persistent problem in oilseed rape which has been identified as one of the factors responsible for the lack of improvement in farm yields (Berry and Spink, 2006). Lodging in oilseed rape can reduce yield by up to 50% (Baylis and Wright, 1990; Armstrong and Nichol, Reference Armstrong and Nicol1991). Yield losses due to lodging can be attributed to restricted assimilate supply and poor seed fill at maturation and to pod shatter prior to and during harvest. The extent of the yield loss depends on the growth stage at which lodging occurs and its severity, with generally greater yield losses from earlier lodging (Armstrong and Nicol, Reference Armstrong and Nicol1991; Islam, Reference Islam1988). It is therefore clear that achieving an optimum sized canopy is critical for oilseed rape. The correct application rate and timing of nitrogen (N) fertiliser and plant growth regulators (PGRs) are crucial for achieving this.
Generally, PGRs are applied at a flat rate across the whole field, yet it is well understood that the lodging risk varies substantially across different parts of the field, in part due to variation in canopy size. Given the importance of optimising canopy size and minimising lodging, the variable application of a PGR across a field would prevent over-regulation to smaller plants and minimise lodging risk in lodging prone areas. A threshold green area index (GAI) of >1 at early green bud is usually used to determine whether to apply a PGR (Berry and Spink, Reference Berry and Spink2009b). There are a number of methods currently available to farmers which allow them to estimate the GAI of the crop, however none of these methods provide an efficient way of estimating the level of variation in GAI within a field. It is clear that non-destructive measurements to assess parameters such as GAI for large areas would be very useful.
Careful choice of rate and timing of N fertiliser is required to achieve the optimum GAI of 3 to 4 units by flowering (Berry and Spink, Reference Berry and Spink2009a). Oilseed rape canopies have been shown to contain approximately 50 kg N/ha per unit of GAI prior to and during stem extension (Berry et al., Reference Berry, Roques and Clarke2011; Berry and Spink, Reference Berry and Spink2009a). Previous work has shown that oilseed rape crops with large canopies should receive less N fertiliser and this fertiliser should be delayed. Thus, similar to PGR applications, it is clear that the capacity to vary N rates based on a remote assessment of canopy size is likely to be beneficial.
Using spectral reflectance (SR) indices derived from a combination of two or more spectral bands offers a possible tool for the non-destructive characterisation of vegetative attributes. The light reflectance of plant canopies can be measured at different spectral bands of visible and near-infrared wavelengths. The reflectance spectrum is dependent on several factors, for example, the amount of above ground biomass and the chlorophyll content of the crop. Specific SR indices have been shown to correlate well with the plant biomass for a range of crops (e.g. normalised difference vegetation index (NDVI)) (Aparicio et al., Reference Aparicio, Villegas, Araus, Casadesus and Royo2002; Bendig et al., Reference Bendig, Bolten, Bennertz, Broscheit, Eichfuss and Bareth2014; Haboudane et al., Reference Haboudane, Miller, Pattey, Zarco-Tejada and Strachan2004). Muller et al. (Reference Muller, Bottcher, Meyer-Schatz and Kage2008) showed a strong correlation between NDVI and GAI, dry matter of the shoots and N content of the shoots in winter oilseed rape. However, Behrens et al. (Reference Behrens, Muller and Diepenbrock2006) showed weak correlations between NDVI and growth characteristics in oilseed rape if calculations are based on data covering the whole growth period. This was attributed to the level of light reflected by the canopy that occurs during flowering. In addition, SR indices can correlate with crop N content in a range of crops, and thus may help to predict crop N requirement and guide variable fertiliser application (Carter and Spiering, Reference Carter and Spiering2002 and Gitelson et al., Reference Gitelson, Gritz and Merzlyak2003). This would also help to optimise canopy size and reduce the risk of lodging.
The aim of this paper was therefore to understand the potential for SR indices to predict GAI and crop N content in winter oilseed rape, with specific interest in developing the Fritzmeier Isaria Crop Sensor for use on oilseed rape in UK conditions.
Materials and Methods
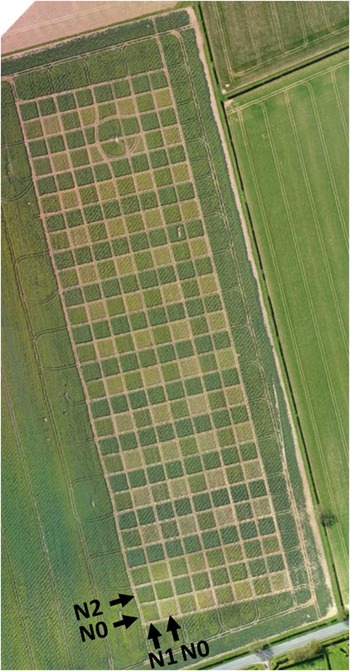
In order to develop and validate systems that could integrate spatial information into robust estimates of PGR and N requirement, a total of three large oilseed rape chessboard experiments were set up in 2015 and 2016 in the UK. These were located at Hockerton, Nottinghamshire in 2015 and Walkington, East Yorkshire and Islington, Norfolk in 2016. Each experiment consisted of 200–300 large plots (e.g. 12 m x 12 m) each with one of four rates of fertiliser N applied as liquid urea ammonium nitrate or solid ammonium nitrate in a chequerboard pattern, thus providing a range of crop N contents and canopy sizes to test. This design was relatively simple to set up using commercial application equipment by criss-crossing the experimental area. In one direction N rate 1 (130 kg N/ha) was applied to one side of the tramline, N rate 0 (0 kg N/ha) on the other. In the perpendicular direction N rate 2 (270 kg N/ha) was applied to one side and again N rate 0 (0 kg N/ha) to the other. This sets up the chessboard pattern (actually a gingham pattern) of alternating squares of 0 kg N/ha (N0+N0) and 130 kg N/ha (N1+N0) plus 270 kg N/ha (N0+N2) and 400 kg N/ha (N1+N2) across the applied area (Figure 1). The size of each square depends on tramline width, a common 24 m tramline width giving 12 m squares. N applications were made in either two or three equal doses between the late February and late April.
Aerial image of the chessboard trial at Walkington in 2016.

Canopy sensing using the Fritzmeier Isaria handheld sensor and CropScan handheld sensor was done at three different growth stages (according to Sylvester-Bradley and Makepeace Reference Sylvester-Bradley and Makepeace1984): just prior to or at the start of stem extension (on eight selected nil N plots), Green bud (3,3) (on eight selected nil N, 130 kg N/ha, 270 kg N/ha and 400 kg N/ha plots) and Yellow bud (3,7) (on eight selected nil N, 130 kg N/ha, 270 kg N/ha and 400 kg N/ha plots). Isaria and Cropscan scans were made from an area of the plot which was used for crop sampling. NDVI was calculated using light reflected at specific wavelengths (nm) as follows (λ810– λ640)/(λ810+λ640) using the CropScan measurements. The Fritzmeier Isaria sensor measures four wavelengths (in the spectral range from 670 nm to 780 nm) and creates two vegetative indices: IBI (an index which reflects the biomass of the crop) and IRMI (an index which reflects the N concentration of the crop).
On the plots that were scanned, a representative area of each plot was chosen for sampling which was directly under where the Cropscan and Isaria scans were taken. The sensors were held at an appropriate height above the crop canopy to ensure that the field view diameter was the same (approximately 60 cm). Two 0.5 m row lengths were sampled and the row width was recorded. The plants were cut off at ground level and all above ground plant material collected. The whole sample was weighed and where appropriate a 25% representative sub-sample was taken and weighed. The combined green area of the leaves and stems was measured using a green leaf area meter. The plant material was dried for approximately 24 hours at 80°C until there was no further weight loss. The dry weight was recorded. The N content of the leaf and stem material was determined by Hill Court Farm Research, Gloucestershire. The material was milled and then analysed by dry combustion using a Carlo -Erba CN Analyser (NA-2100).
Results
Predicting GAI
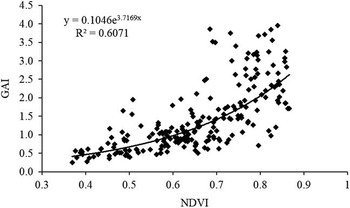
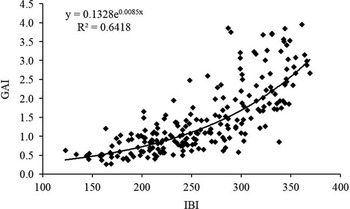
The different N application rates were successful at each site in creating a wide range of canopy sizes and therefore GAIs to test the ability of the remote sensing methods to predict this measure. GAI ranged from 0.3 to 5.8 and this reflects the range that could be observed for a very small crop through to a very large crop. A positive relationship was obtained between GAI (restricted to 4 and below) and NDVI (Figure 2) with an R2 of 0.607. The GAI was restricted as a GAI of 4 and below would be expected at a typical PGR application growth stage. The data shown in this figure represents data collected across the three sites and across the three growth stages. Similarly, a positive relationship between GAI (restricted to 4 and below) and the Isaria biomass index IBI was obtained, (Figure 3) with an R2 of 0.642, which was slightly stronger than the correlation with NDVI.
Relationship between NDVI and GAI for oilseed rape crops in 2015 and 2016 measured between the start of stem extension and yellow bud.

Relationship between Fritzmeier Isaria spectral reflectance index for biomass (IBI) and GAI for oilseed rape crops in 2015 and 2016 measured between the start of stem extension and yellow bud.

The results shown in Figures 2 and 3 show a good correlation between both NDVI and the Fritzmeier Isaria index IBI with GAI. Using the equation shown in Figure 3, the ability of the Fritzmeier Isaria to predict GAI at a threshold of one was tested. In 78% of cases, the IBI index could predict correctly whether or not the GAI was less than one or more than one.
Predicting Crop N content
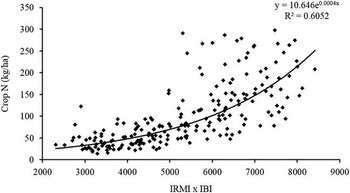
The different N application rates led to a wide range of crop N content (kg N/ha) values within each experiment. Figure 4 shows the correlation between crop N content and the Fritzmeier Isaria biomass index (IBI) multiplied by the crop N concentration index (IRMI), with an R2 value of 0.605.
Relationship between the product of Fritzmeier Isaria spectral reflectance indices IRMI and IBI against Crop N for oilseed rape crops in 2015 and 2016 measured between the start of stem extension and yellow bud.

Discussion
Predicting GAI for variable PGR application
A PGR is generally applied to an oilseed rape crop which has a GAI of one or more. By using the Isaria crop sensor IBI indicie, which can predict correctly whether or not the GAI is less than one or more than one in 78% of cases, this system would correctly apply or not apply a PGR in the majority of areas of a field. Although it may be challenging to accurately predict the exact GAI using the relationship shown in Figure 3, working at the level of precision described would still be very useful for farmers wanting to variably apply a PGR. It may also be possible to detect large canopies of, for example, a GAI of 2 and above, for which a greater rate of PGRs may be appropriate. However, what may be more challenging is the ability of the Fritzmeier Isaria to detect smaller GAI differences, which would allow small changes in rates of PGR to be made. For example perhaps a lower rate could be applied to a crop with a GAI ranging from 0.8 to 1.
Predicting crop N content for variable N application
A good relationship between IRMI*IBI and crop N content was obtained from the data collected from the three chessboard experiments in 2015 and 2016 (Figure 4). This suggests that the Isaria crop sensor would be able to adequately measure the amount of N in the crop at the time of N application and use this information in a decision making process to variably apply N across the field, and to decide whether or not to delay N.
In each of the three chessboard experiments, yield data from the four N rates can be used to fit N response curves to describe the yield response to applied N in different parts of the experimental area. The economic optimum N rate can then be calculated and mapped across the experimental area. Further work will be carried out to describe spatial variation in optimum N rate and understand the factors which cause this variation. Validation of the technology will be a key component of understanding the benefit on farm of the Fritzmeier Isaria to UK oilseed rape crops.
Conclusion
The results presented in this paper provide promising evidence to suggest that the Fritzmeier Isaria crop sensor could be used to enable both variable N and PGR applications under UK conditions for oilseed rape.
Acknowledgements
The authors are grateful to Innovate UK for part funding of project 101909 and to the project partners: CF Fertilisers UK Ltd, Hill Court Farm Research, Precise Crop Nutrition, Syngenta UK, Precision LandCare, Patchwork Technology and also to Fritzmeier.