Dyes are one of the world's most widespread pollutants; they react strongly with a large number of synthetic and natural surfaces in the textile, printing, dyeing, paper and plastics industries (Han et al., Reference Han, Ding, Xu, Zou, Wang, Li and Zou2008; Shahid et al., Reference Shahid, Shahid-ul-Islam and Mohammad2013). It is estimated that >100,000 types of synthetic dyes exist and >700,000 tons of dyestuff are produced annually worldwide (Robinson et al., Reference Robinson, McMullan, Marchant and Nigam2001; Sun et al. Reference Sun, Li, Sun, Shi, Fan and Zhou2009). In the textiles industry, up to 200,000 tons of dyes are lost in effluents every year during dyeing and finishing operations, due to inefficiency in recovery from the dyeing process and treatment (Ogugbue & Sawidis, Reference Ogugbue and Sawidis2011). Unfortunately, most of these dyes persist in the environment as a result of their high stability and low biodegradability (Couto, Reference Couto2009). In addition, anti-microbial agents resistant to biological degradation are frequently used in the manufacture of textiles, particularly for natural fibres such as cotton (O'Neill et al., Reference O'Neill, Hawkes, Hawkes, Lourenço, Pinheiro and Delée1999; Couto, Reference Couto2009). The synthetic origin and complex aromatic structure of these agents make them more resistant to biodegradation (Forgacs et al., Reference Forgacs, Cserháti and Oros2004; Przystaś et al., Reference Przystaś, Zabłocka-Godlewska and Grabińska-Sota2012). Environmental legislation applies strict controls to dye-containing effluents before disposal into water pools (O'Neill et al., Reference O'Neill, Hawkes, Hawkes, Lourenço, Pinheiro and Delée1999; Ogugbue & Sawidis, Reference Ogugbue and Sawidis2011). Since the 1960s, increasingly severe environmental regulations have driven research in wastewater treatment and neutralization of solutions of reactive dyes (20–30% of the total dye market) (Orfao et al., Reference Orfao, Silva, Pereira, Barata, Fonseca and Faria2006). Hence, several physical (Das & Basu, Reference Das and Basu2014), chemical (Liang et al., Reference Liang, Sun, Li, Ong and Chung2014) and biological (Pandey et al., Reference Pandey, Singh and Iyengar2007) methods have been developed to remove dyes and other coloured contaminants from wastewaters. Despite the effectiveness of the majority of these tests, the cost of the adsorbent and/or regeneration rate remain an important issue. In this context, the dye Direct Orange 34, commonly used in the Tunisian textiles industry, remains largely unstudied, and research focused on the treatment of wastewater derived is rare. Their high solubility, toxicity and carcinogenic effects make such reactive dyes difficult to remove; adsorption might be an attractive and efficient solution (Gurses et al., Reference Gurses, Dogar, Yalcin, Akyildiz, Bayrak and Karaca2006; Chaari et al., Reference Chaari, Moussi and Jamoussi2015). This method involves a wide variety of materials including clays (Bhattacharyya et al., Reference Bhattacharyya, SenGupta and Kumar Sarma2014), calcium carbonate and hydroxides (Vimonses et al., Reference Vimonses, Jina, Chow and Saint2009), fly ash (Kumar et al., Reference Kumar, Ramamurthi and Sivanesan2005), and Fe composites (Khosravi & Azizian, Reference Khosravi and Azizian2013). With the abundance of clay materials in Tunisia and the need for low-cost sorbents, recent work has reported the effective removal of organic pollutants by natural kaolinite, due to its layer structure and suitable mechanical and chemical stability (Errais et al., Reference Errais, Duplay, Darragi, M'Rabet, Aubert, Huber and Morvan2011; Hamdi & Srasra Reference Hamdi and Srasra2009).
Interest in using materials such as natural and modified kaolin as sorbents (Doğan et al., Reference Doğan, Karaoğlu and Alkana2009; Karaoğlu et al., Reference Karaoğlu, Doğan and Alkan2010), catalysts (Khanikar & Bhattacharyya, Reference Khanikar and Bhattacharyya2013), membranes (Tahri et al., Reference Tahri, Masmoudi, Ellouze, Jrad, Drogui and Amar2012) and fillers in the synthesis of polymer nanocomposites is growing, as is a new trend in wastewater treatment (Faria et al., Reference Faria, Ricci, Marcal, Nassar, Vicente, Trujillano, Gil, Korili, Ciuffi and Calefi2012; Adebowale et al., Reference Adebowale, Unuabonah and Olu-Owolabi2008). Moreover, kaolins may be modified to improve their removal efficiency (Hajjaji et al., Reference Hajjaji, Ganiyu, Tobaldi, Andrejkovičová, Pullar, Rocha and Labrincha2013; Akgül, Reference Akgül2014; Ugochukwu et al., Reference Ugochukwu, Jones, Head, Manning and Fialips2014). In the present study, acid activation and Fe impregnation of the clay were applied to improve the dye-removal capacity. Furthermore, Fe-SDB is relatively stable and may be recycled because it can be recovered easily due to its magnetic properties.
MATERIALS AND METHODS
Materials and reagents
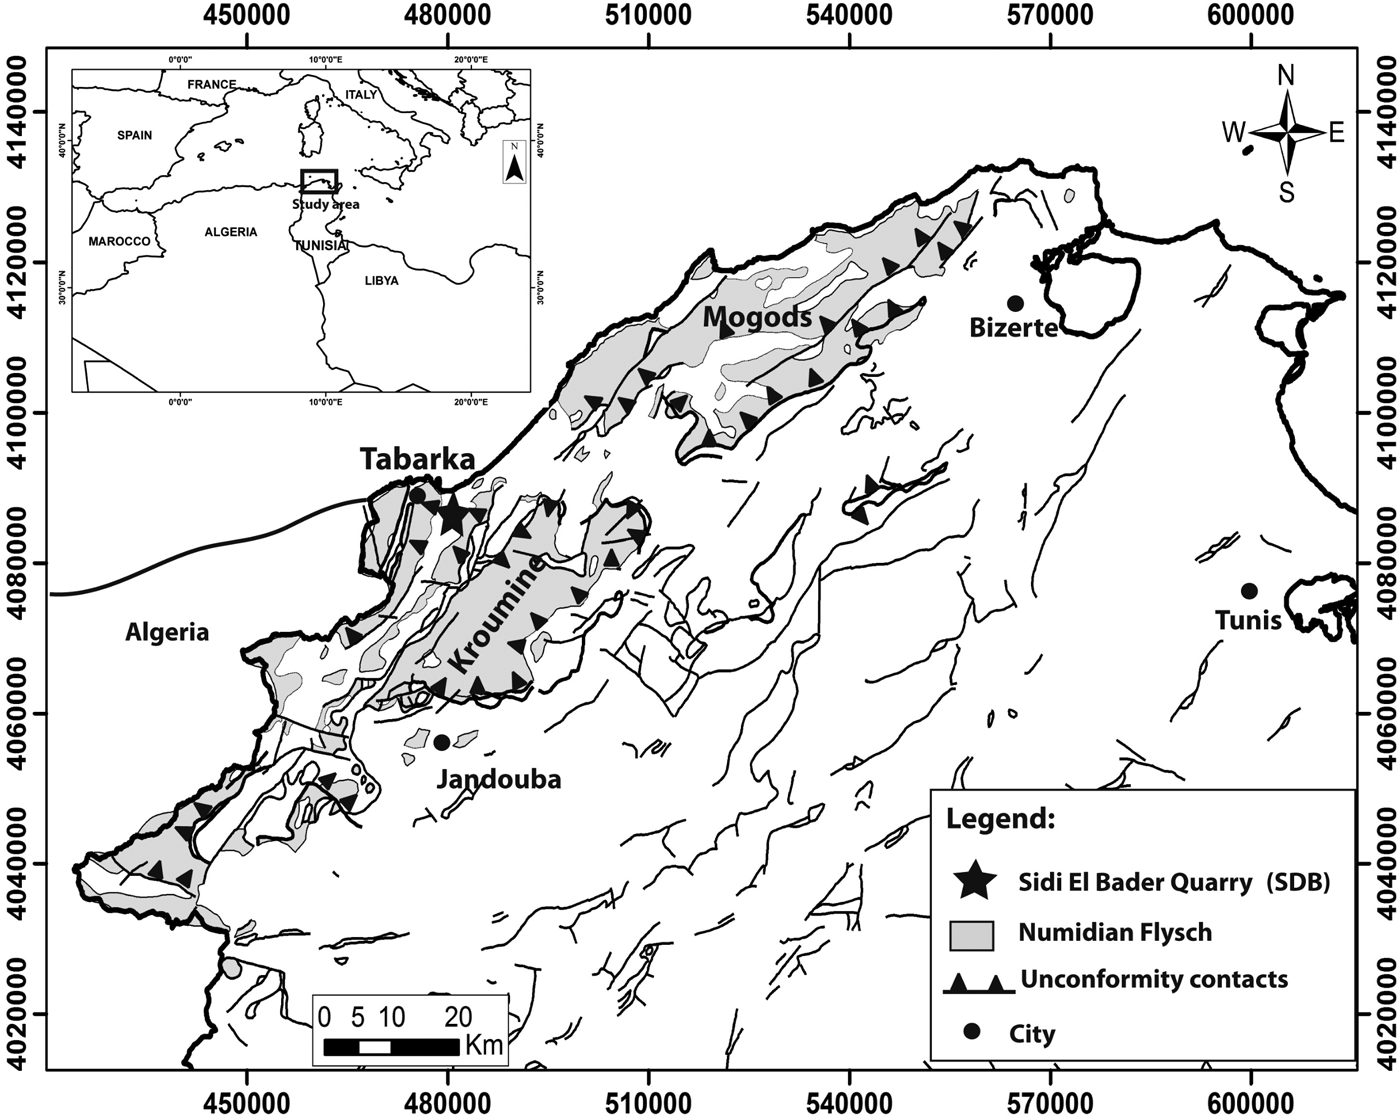
The clay (SDB) used in the present study was collected from the Sidi Bader quarry in Tabarka (NW Tunisia) (Fig. 1). The clay belongs to the Numidian Flysch located within the Kroumiries mountain chain (Moussi et al., Reference Moussi, Medhioub, Hatira, Yans, Hajjaji, Rocha, Labrincha and Jamoussi2011).
Location of the clay deposit studied.

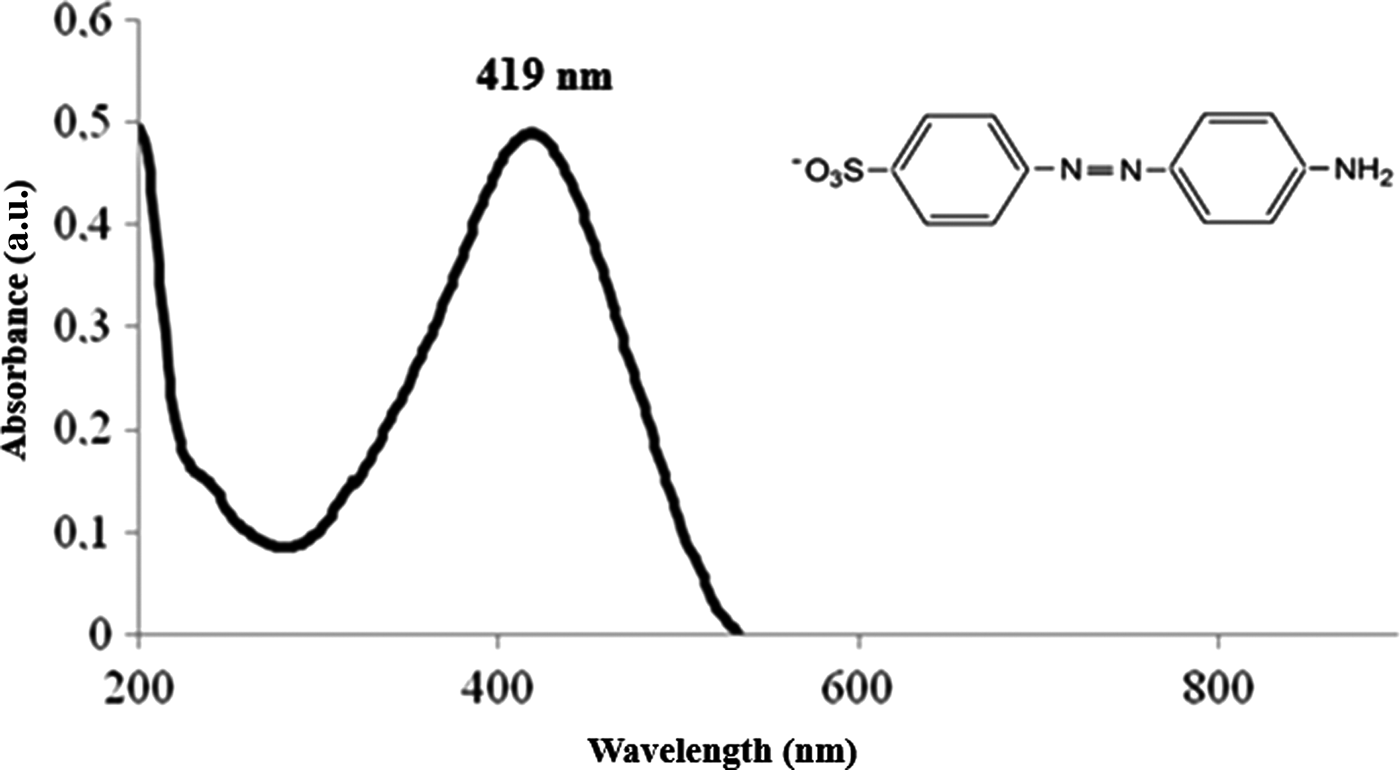
The chemical formula and UV-vis absorption spectrum of Direct Orange 34 are shown in Fig. 2. The maximum adsorption intensity was observed at λ = 419 nm. The stability of the dye and the colour intensity depend on the pH. The acid pH (3), and also the basic pH (10) influence the absorption spectrum of the dye as a new ultraviolet absorption band appeared at λ = 227 nm under these conditions. This phenomenon was also observed by Chaari et al. (Reference Chaari, Moussi and Jamoussi2015). Stock dye solution (1 g L–1) was prepared by dissolving 1 g of Direct Orange 34 in 1 L of deionized water and subsequently diluted to the required concentrations.
Chemical structure of Direct Orange 34 with water solubility of 6 g/100 mL at 30°C; λmax = 419 nm.

Mineralogical analysis of the SDB samples was carried out by X-ray diffraction (XRD, PANalytical X'PERT Pro diffractometer; Table 1). Oriented aggregates were treated with ethylene glycol and dried at 500°C for 2 h. The quantification of clay and associated minerals was evaluated from peak areas in the diffraction patterns (Zevin & Kimmel, Reference Zevin and Kimmel1995), and corrected by chemical data (López-Galindo et al., Reference López-Galindo, Torres-Ruiz and Gonzalez López1996). The experimental error was ± 5%. The chemical composition was determined by X-ray fluorescence (XRF) using an Axios Wavelength spectrometer. Loss on ignition was estimated by measuring the difference in weight in a 10 g sample after drying and after calcination at 1000°C. The microstructural characterization was performed by transmision electron microscopy (TEM, Phillips FEI-Tecnai 10 electron microscopy) with an accelerating voltage of 80 kV. The specific surface area and nitrogen adsorption/desorption isotherms were measured by the Brunauer Emmet Teller (BET) (Reference Brunauer, Emmett and Teller1938) method using a MicromeriticsTristar 3000 instrument. Fourier-transform infrared (FTIR) spectra were collected using a Perkin Elmer Paragon 1000 Spectrometer. Peak assignments were made visually and with the Perkin Elmer Spectrum TM 10 spectroscopy software.
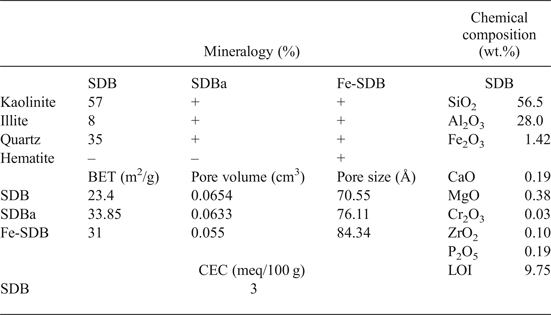
Composition, CEC and BET results of treated and untreated clays.

+: detected; –: not detected
The surface zeta potential was evaluated using a Beckman Coulter, Delsa™ Nano C, particle analyser. The pH of dilute dispersions was adjusted to between 1 and 10 by adding either HCl or NaOH solutions, and measured directly before introducing the sample into the capillary cell. The cation exchange capacity (CEC) was estimated using the copper ethylenediamine complex method (Bergaya & Vayer, Reference Bergaya and Vayer1997).
To determine the particle-size distribution and the percentage of the <2 µm fine clay fraction, a Malvern Mastersizer 2000 laser particle size analyser was used. The range of particle sizes measured was between 0.02 µm and 2000 μm.
Acid-activated clay, referred to here as SDBa, was obtained by mixing, under vigorous stirring, 20 g of kaolin (SDB) with 100 mL of 2 M HCl solution for 1 h at 60°C, followed by aging at room temperature for 12 h. The precipitate was filtered and the treated material was washed several times with distilled water until pH 5. Finally, the product was dried in air at 60°C overnight.
For Fe loading, Fe-SDB was prepared by the impregnation method. 20 g of SDB powder was mixed with 100 mL of a 0.2 M iron sulfate (FeSO4.7H2O) solution for 3 h with a magnetic stirrer, and then aged for 12 h at room temperature (24 ± 2°C). A greater Fe concentration than this would lead to oversaturation and a decrease in the number of active adsorption sites. The cost of the reagent could be prohibitive when applied to wastewater treatment at an industrial scale. The suspension obtained was washed, centrifuged and dried overnight at 60°C and then calcined in a furnace at 400°C for 3 h.
Batch adsorption experiments were carried out by adding 0.5 g of clay to 50 mL of dye solution with an initial concentration of 200 ppm. The adsorption kinetics were studied by varying the contact time from 5 to 180 min. To study the effect of pH, the dye adsorption rate was measured while varying the pH from 3 to 10. The influence of temperature on dye adsorption was studied at 283, 298 and 313 K under optimum conditions for a 1 h contact time, i.e. 0.5 g of adsorbent and pH 3. The Direct Orange 34 adsorption isotherms were obtained by adding 1 g of clay to 100 mL of distilled water with various concentrations of dye (20, 30, 100, 150, 200 and 300 ppm) at acidic pH (3).
After adsorption, the suspension was centrifuged at 4000 rpm for 20 min and the supernatant was filtered under vacuum through 45 µm filters and was analysed using a SPECORD 205 spectrometer at a wavelength of 419 nm to determine the concentration of the residual dye. The amount of dye adsorbed by the SDB-based sorbent was determined by the following equation:
 $$q_t = (C_0 - C_t)V/m$$
where C 0 and C t are the initial and final (at time t) dye concentrations (mg L–1), respsectively; q t is the dye concentration on adsorbent at any time, t (mg g–1), V is the volume of dye solution (L), and m is the mass of clay sample (g).
In this study, the Freundlich and Langmuir isotherm models (Freundlich, Reference Freundlich1906; Langmuir, Reference Langmuir1918) were applied. The linear form of Langmuir isotherm is given by the following equation:
 $$C_{\rm e}/q_{\rm e} = {\rm} 1/q_{\rm m}{\rm b} + C_{\rm e}/q_m$$
where C e is the equilibrium concentration (mg L–1), q e is the amount adsorbed at equilibrium (mg g–1), q m the maximum amount adsorbed (mg g–1), and b is the energy of adsorption (Langmuir constant) (L mg–1). The values of q m and b were calculated from the slope and intercept of the linear plot C e/q e vs. C e. The slope 1/q m corresponds to the complete monolayer coverage (mg g–1) and the intercept is 1/q mb (plots not shown).
The Freundlich isotherm describes equilibrium on heterogeneous surfaces and, hence, does not assume monolayer capacity. The isotherm is described by the following equation:
 $$q_{\rm e} = {\rm k}_{\rm F} C^{1/n}$$
The logarithmic form of the equation becomes:
 $${\rm log} \, \left(q_{\rm e} \right) = {\rm log} \, {\rm k}_{\rm F} + 1/{\rm n} \, {\rm log} \, \left(C_{\rm e} \right)$$
where kF and n are Freundlich constants calculated from the slope and intercept of the Freundlich plot. An n value between 1 and 10 represents a good adsorption potential of the adsorbent (Freundlich, Reference Freundlich1906).
The essential characteristics of the Langmuir equation can be expressed in terms of a dimensionless separation factor, RL, which was defined by Hall et al. (Reference Hall, Eagleton, Acrivos and Vermeulen1966) as:
 $${\rm R}_{\rm L} = 1/(1 + {\rm b} C_0)$$
where C 0 is the greatest initial dye concentration (mg L–1) and RL values indicate the shape of the isotherm.
The kinetic behaviour was studied using Lagergren pseudo-first order and pseudo-second order equations. The Lagergren pseudo-first order equation was used to fit the experimental results (Lagergren, Reference Lagergren1898):
 $${\rm Ln} \, (q_{\rm e} - q_{\rm t}) = {\rm Ln} \, \left( {q_{\rm e}} \right) - {\rm k}_1 t/2.303$$
where q e and q t are the amounts of Direct Orange 34 dye adsorbed per unit weight of adsorbent (mg g–1) at equilibrium time and time t, respectively, and k1 is the rate constant for the first-order kinetics. The adsorption rate constant was determined from the plot of ln(q e−q t) vs. t.
The pseudo-second order kinetics may be expressed as (Bhattacharyya & Sharma, Reference Bhattacharyya and Sharma2004):
 $$t/q_t = 1/{\rm k}_2 q_{\rm e}^2 + t/q_{\rm e}$$
where k2 is the rate constant of adsorption, q e is the amount of dye adsorbed (mg g–1) at equilibrium and q t is the amount of dye adsorbed (mg g–1) at time t.
The equilibrium adsorption capacity (q e) and the second-order rate constant k2 (mg g–1 min–1) may be determined experimentally from the slope and intercept of plot of t/q t vs. t, if the initial adsorption rate is (Gundogan et al., Reference Gundogan, Acemioglu and Alma2004):
 $$h = {\rm k}_2q_{\rm e}^2 $$
RESULTS AND DISCUSSION
Characterization of adsorbents
The natural SDB clay is composed mainly of kaolinite (57%) with minor amounts of illite (8%) (Table 1). Quartz is also abundant (35%), in good agreement with the large amount of SiO2 reported by the chemical analysis (Table 1).
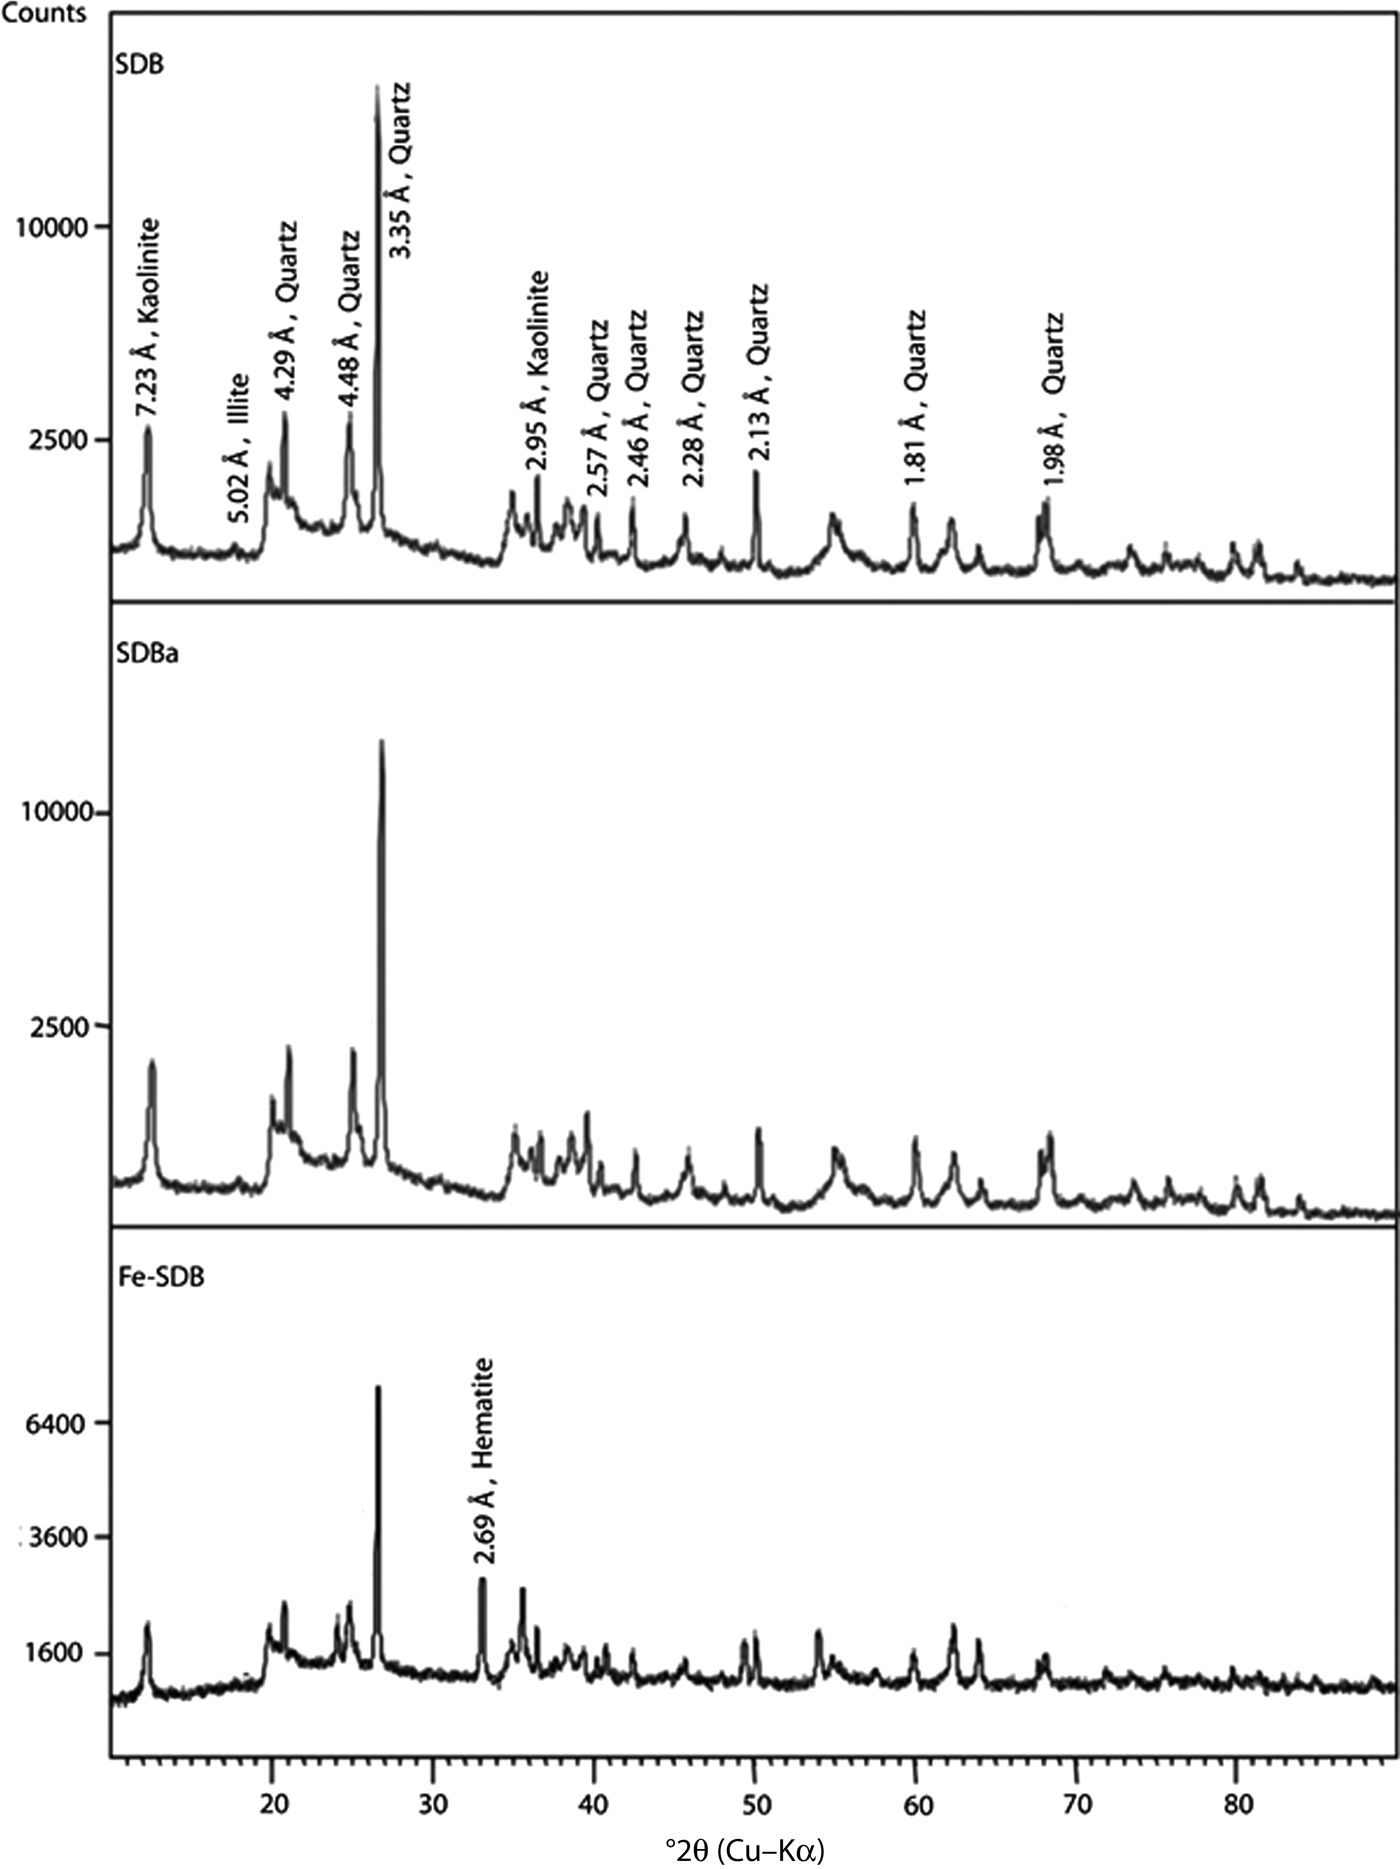
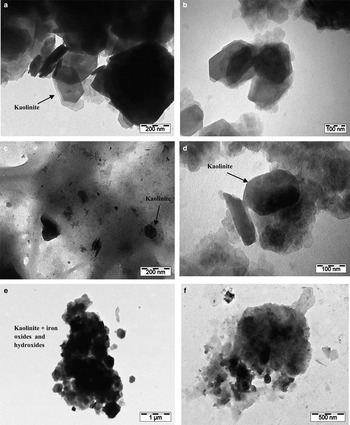
The XRD traces of the raw SDB clay, the acid-activated SDBa and impregnated Fe-SDB products are presented in Fig. 3. The basal reflections of kaolinite and illite appear at 7.23 Å (001) and 5.02 Å (002), respectively. The TEM images display the pseudo-hexagonal structure of kaolinite particles (Fig. 4a,b). After 1 h of acid activation, the position of the principal minerals’ reflections remained unchanged. Nevertheless, a considerable decrease in peak intensities was observed, due to a decrease in the structural order of kaolinite under the effect of the acidic medium, also observed in TEM images (Fig. 4c,d). With acid activation, the clay minerals seem less crystalline and more agglomerated, in accordance with the increase in BET values (33.9 m2/g) compared to the raw kaolin (23.4 m2/g; Table 1). Acid activation opens the edges of the clay layers and increases the diameter of the pore (Ravichandran & Sivasankar, Reference Ravichandran and Sivasankar1997; Chaari et al., Reference Chaari, Feki, Medhioub, Bouzid, Fakhfakh and Jamoussi2009; Rezende & Pinto, Reference Rezende and Pinto2016). During acid activation, exchangeable cations are initially replaced by protons, followed by partial dissolution of tetrahedral and octahedral sheets, creating new spaces. Acid sites formed at the layer edges contribute to the fixing of organic dye molecules (Komadel & Madejová, Reference Komadel and Madejová2006).
XRD patterns of raw (SDB) clay, its acid-activated form (SDBa) and its Fe-impregnated form (Fe-SDB).

TEM images of (a,b) SDB, (c,d) SDBa and (e,f) Fe-SDB clays.

The peak positions remained almost unchanged after Fe impregnation (sample Fe-SDB), although a slight decrease in peak intensities of kaolinite and illite was observed. This behaviour could be explained by the fixation of spherical Fe nanoparticles onto the clay minerals’ surfaces (Fig. 4e,f). Fe treatment had the same effect on the specific surface area which was 31 m2/g (Table 1).
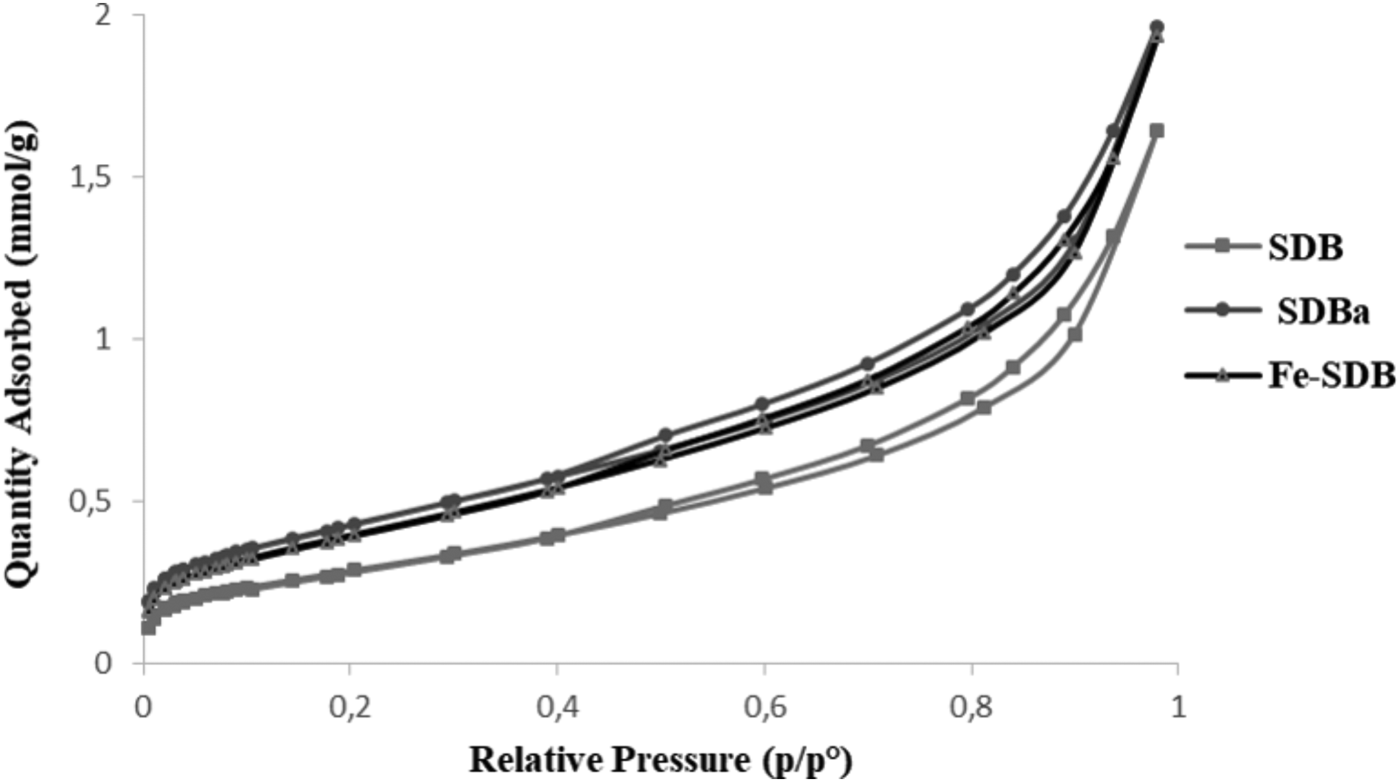
The N2 adsorption–desorption isotherms of SDB, SDBa and Fe-SDB are very similar to each other (Fig. 5). The treated and untreated clay are mesoporous materials characterized by type IV isotherms, typical of this type of clay (Michot et al., Reference Michot, Baril and Armand1995). The physical properties derived from N2 adsorption–desorption data are summarized in Table 1. The total N2 adsorption uptake is slightly higher for SDBa and Fe-SDB than SDB. After the treatments, the BET surface area increased, probably due to the formation of surface cracks and defects as a result of the collapse of pore structure during Fe impregnation in Fe-SDB (Akgül, Reference Akgül2014), and acid activation (Rezende & Pinto, Reference Rezende and Pinto2016) in SDBa. In SDBa, the specific surface area increased after acid activation due to the formation of mesopores; indeed, the total pore-volume values and mean pore diameters increased. Acid activation opens the edges of the clay layers and increases the diameter of the pores: consequently, specific surface area increases (Ravichandran & Sivasankar, Reference Ravichandran and Sivasankar1997). The decreased pore volume and mean pore diameter of the Fe-SDB compared to the unmodified SDB suggest an increase in the microporosity, which might be ascribed to the opening of side pockets, or removal of some impurities included within the clay pores due to calcination (Gregg & Sing, Reference Gregg and Sing1982; Li, Reference Li2013).
Adsorption isotherms of the clays studied.

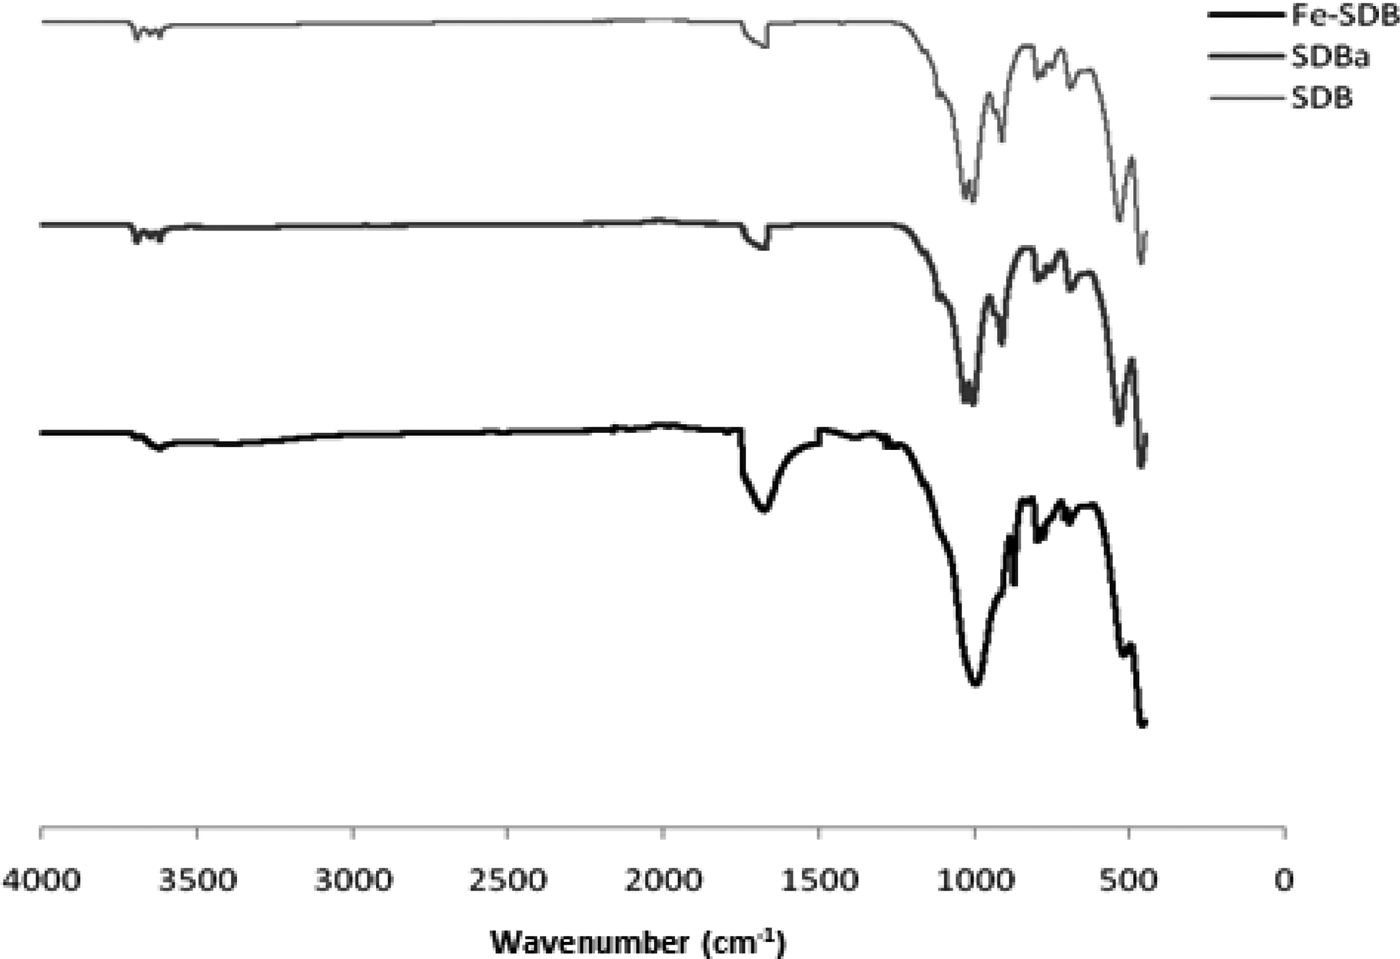
The FTIR spectra were collected to obtain a better insight into the surface characteristics of the natural and modified clays (Fig. 6). All the kaolinite samples studied yielded FTIR spectra which correspond to those reported in the literature (Farmer et al., Reference Farmer, Fraser and Tait1979; Madejová, Reference Madejová2003; Bhattacharyya et al., Reference Bhattacharyya, SenGupta and Kumar Sarma2014). The following characteristic infrared bands were observed: O–Si–O stretching (1029, 1006 and 1114 cm−1), Si–O bending (469 cm−1), O–Si–O symmetric stretching (796 cm−1), Al–OH bending (914 cm−1), and vibrations of deformation of Al–O bonds and Si–O (689 cm−1). Also, additional absorption bands appear in kaolinite in the OH-stretching region at 3618 cm–1, due to inner OH groups lying between the tetrahedral and octahedral sheets, and at 3695 cm–1, assigned to in-phase symmetric OH stretching vibration (Madejová, Reference Madejová2003; Bhattacharyya et al., Reference Bhattacharyya, SenGupta and Kumar Sarma2014). The bands at 524 and 734 cm−1, corresponding to “pore opening” vibration and to symmetric stretching of free SiO4, also appeared (Innocenzi et al., Reference Innocenzi, Falcaro, Grosso and Babonneau2003; Akgül, Reference Akgül2014). In the Fe-SDB, the bands at 3618 and 1600 cm−1 were still present but exhibited increased intensity, suggesting the formation of additional Brønsted acid sites (new hydroxyl groups) by the incorporation of Fe3+ on the kaolinite (Li, Reference Li2013). Furthermore, bands corresponding to the typical frequencies for Fe-O (490, 599) were not observed, probably due to the overlap with the characteristic bands of kaolinite (Samanta et al., Reference Samanta, Giri, Sastry, Mal, Manna and Bhaumik2003; Guo et al., Reference Guo, Zhang, Cui, Sharma, Yang and Akins2005).
FTIR spectra of the raw and modified clays.

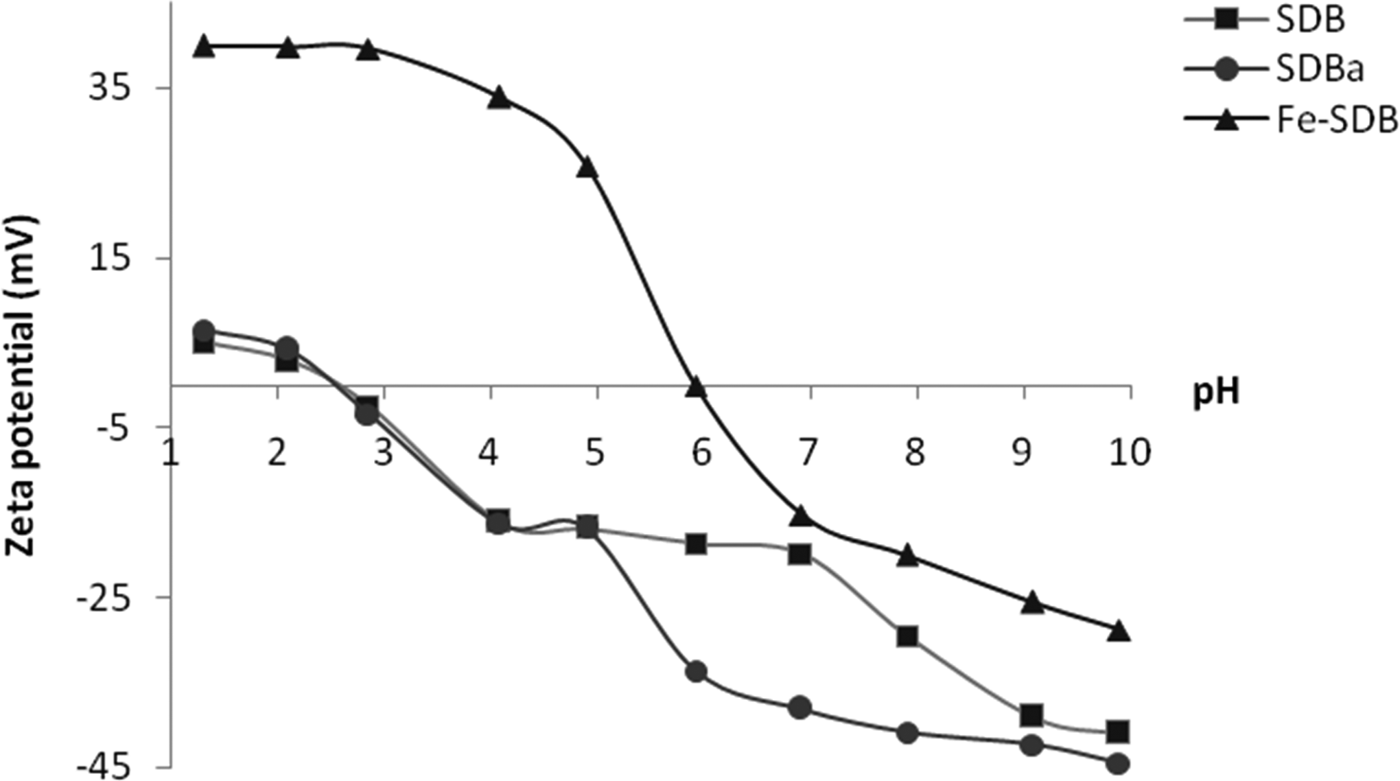
The SDB and SDBa clays (Fig. 7) showed similar zeta potential profiles at acid and alkaline pH, which differ from the natural clay at medium pH (close to 20 mV at pH 7). At these levels, the modification in the clay surface charge due to acid activation (elimination of OH– sites and fixation of H+) was obvious.
Variation of zeta potential with pH.

In the case of Fe-SDB, there is a distinct behaviour of Fe species which leads to an increase in the zeta potential from –28.8 mV at pH = 10 to +40.3 mV at pH = 1, that may be explained on the basis of the charge neutralization via partial specific fixation of Fe3+ ions on the surface of the clay. The specific adsorption may be defined as the attraction of Fe3+ ions to the adsorbent surface by chemical forces in addition to electrostatic forces (Akgül, Reference Akgül2014). The formation of additional hydroxyl groups (Fe-OH), which are protonated to form Fe-OH2+, may also increase zeta potential with decreasing pH (Gupta & Suhas, Reference Gupta and Suhas2009).
Adsorption of ions and release of structural OH groups may modify the surface charge of clays (Akgül, Reference Akgül2014). The above reaction is forced by a charge-neutralization stable state that requires an equal number of equivalents of the adsorbed anion; the positive charge is neutralized, and as a result the hydroxyl group is released.
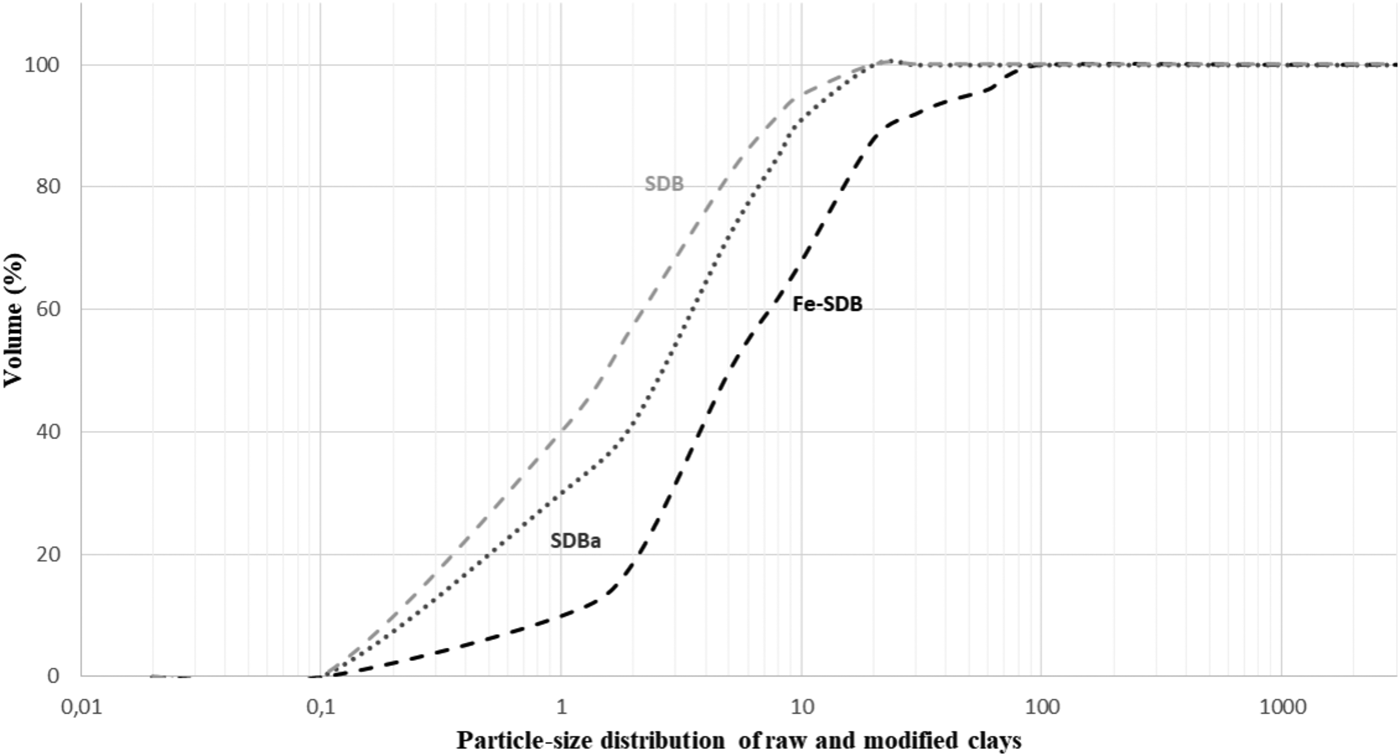
The proportion of the sample which was <2 µm was 57.5% for SDB, 41.5% for SDBa and 18.8% for Fe-SDB, according to the cumulative particle-size curve (Fig. 8). This reduction in the volume of the fine fraction (<2 µm) is explained by the agglomeration of the clay particles when treatment was applied.
Particle-size distribution of raw and modified clays.

Adsorption tests
The effects of parameters such as contact time, solution pH, initial dye concentration and solution temperature were studied to refine and optimize the removal process of Direct Orange 34 from laboratory-prepared aqueous solutions, using the previously prepared SDB, SDBa and Fe-SDB materials.
Contact time
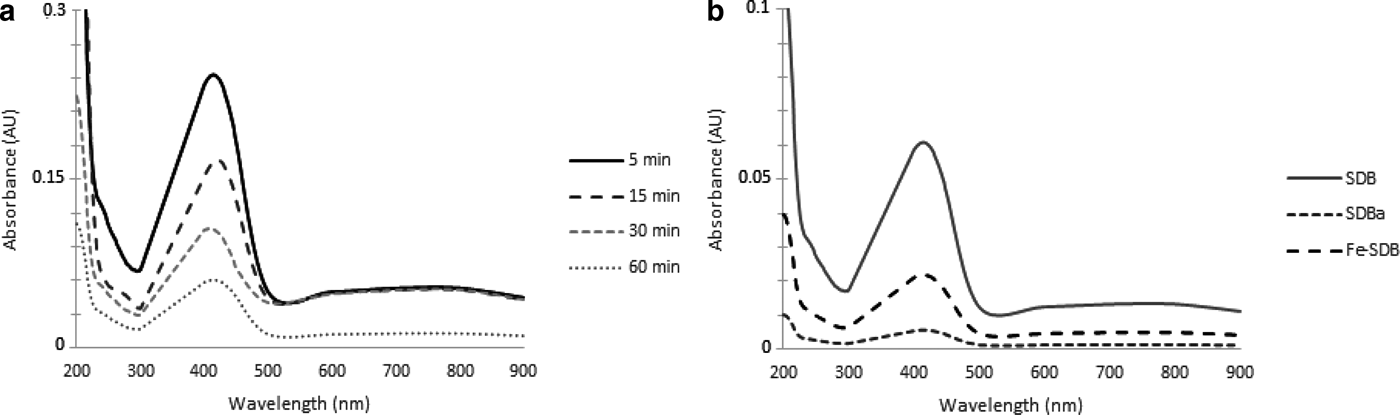
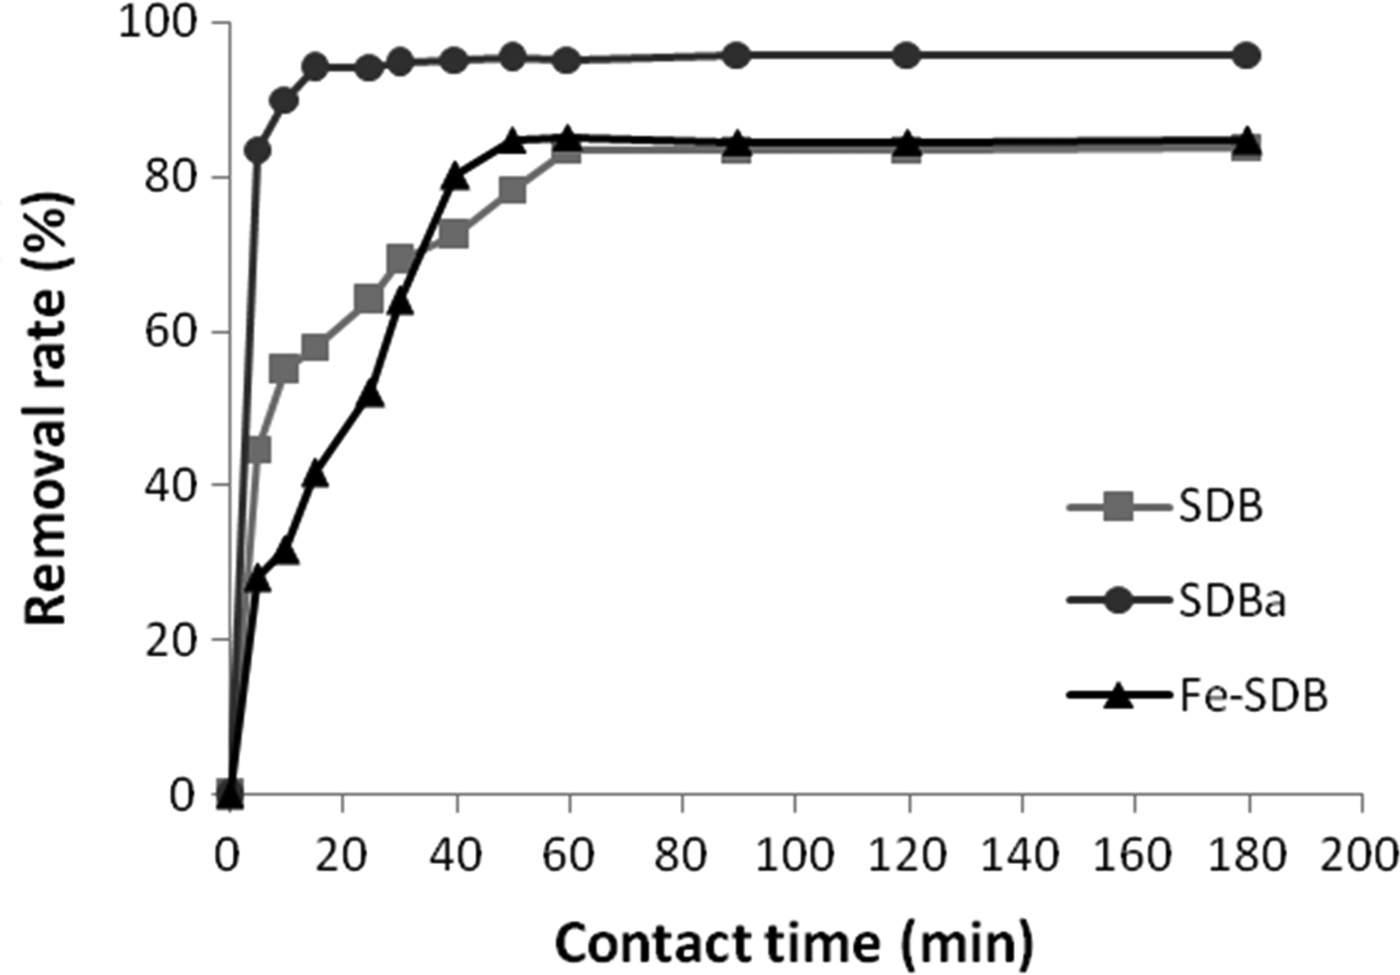
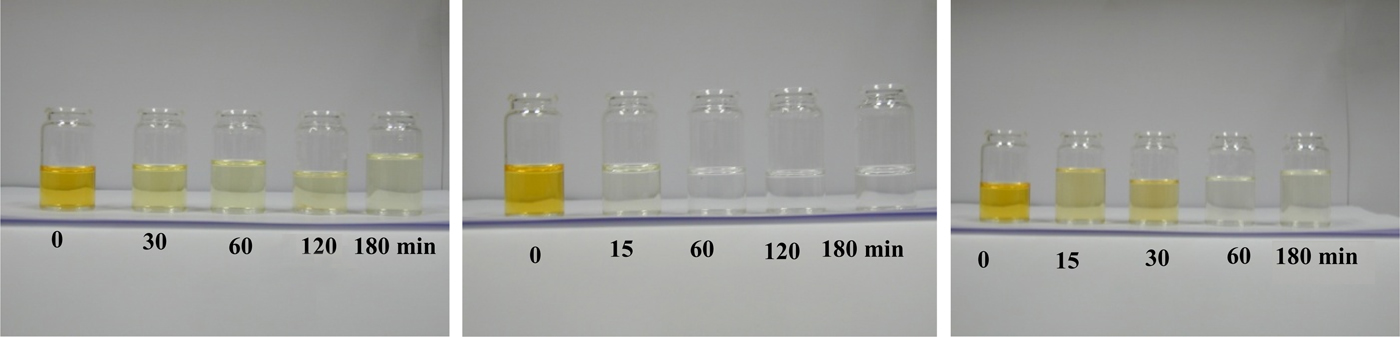
The adsorption kinetics of Direct Orange 34 on the three clays (SDB, SDBa and Fe-SDB) were determined under the same operating conditions. The dye uptake for activated clay SDBa was relatively fast in the initial stage and equilibrium was reached after 15 min (Figs 9–11). Regarding SDB and Fe-SDB the maximum dye removal was obtained after 60 min of contact time. The adsorption capacity of acid-activated kaolin (95% decolourization) was superior to the unmodified and Fe-impregnated kaolin (83% and 85%, respectively). This difference is mainly related to the greater availability of active sites on the SDBa clay surface.
(a) Evolution of the UV-vis absorption spectrum of Orange DO34 over time and after treatment with SDB clay; (b) absorption spectrum of Orange DO34 after treatment with SDB, SDBa and Fe-SDB.

Effect of contact time on the adsorption rate of dye on clay.

Effect of contact time on the adsorption rate of dye on clay.

At the chosen experimental conditions, unmodified SDB, with the lowest CEC value (Table 1), had a relatively high adsorption rate (83%). Therefore, cation exchange was probably not the main adsorption mechanism.
Variation in pH
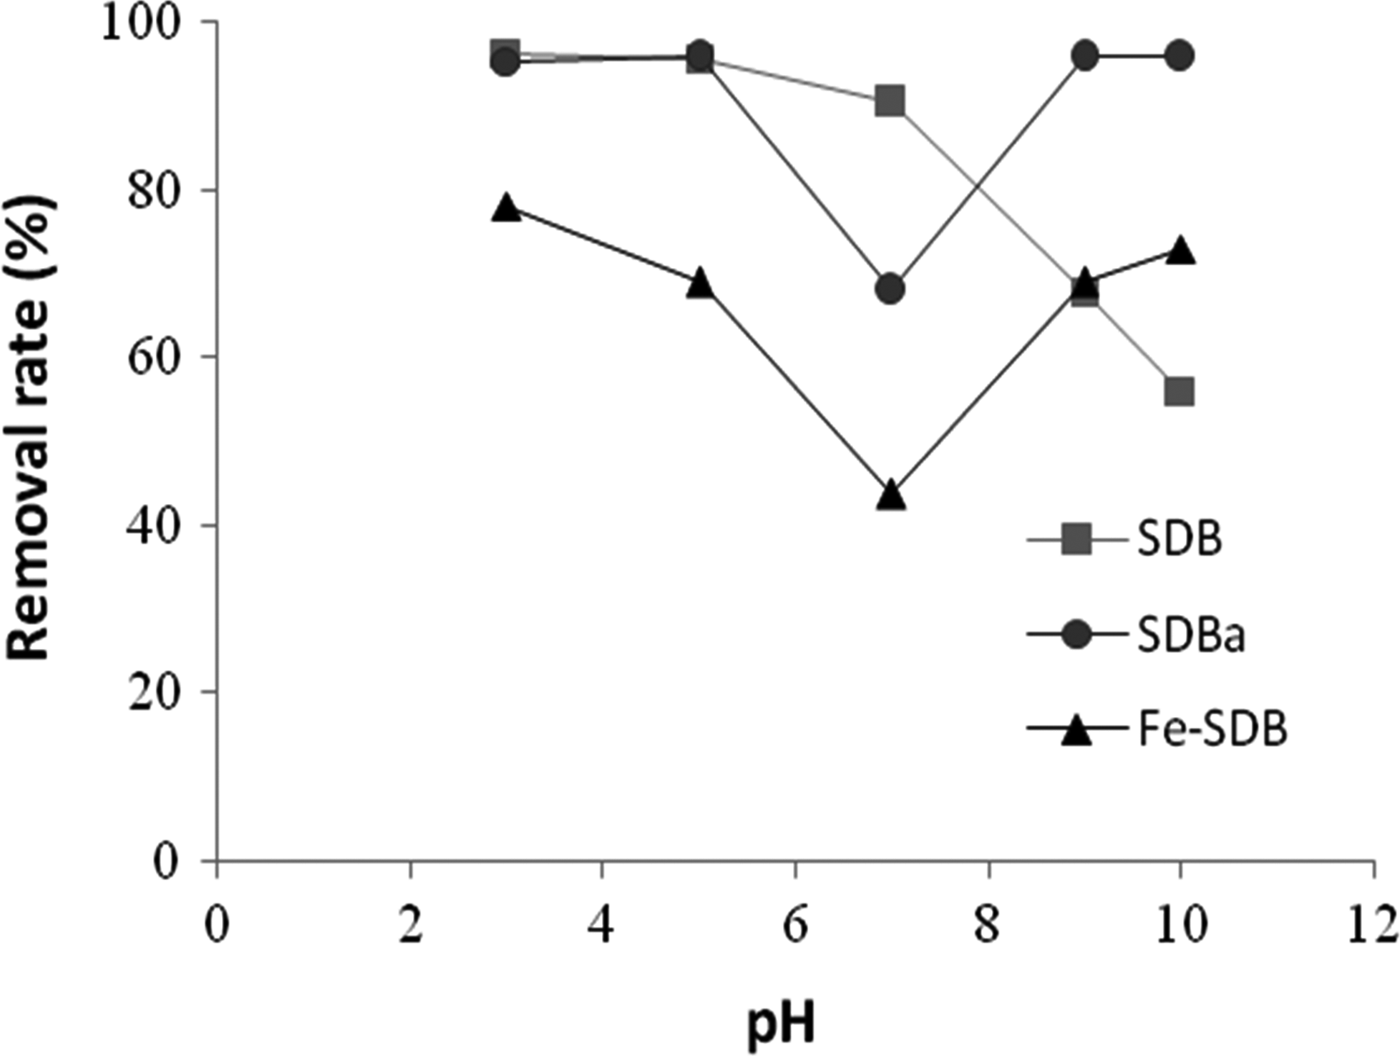
The effect of pH on the adsorption of Direct Orange 34 is depicted in Fig. 12. The maximum adsorption capacity was observed over the pH range 3–5. The natural SDB clay displayed different adsorption behaviour; it decreased with increasing pH from 3 to 10, probably due to the protonation of the clay surface and electrostatic interaction between clay and dye molecules (Gurses et al., Reference Gurses, Dogar, Yalcin, Akyildiz, Bayrak and Karaca2006; Errais et al., Reference Errais, Duplay, Darragi, M'Rabet, Aubert, Huber and Morvan2011). Similar behaviour was reported by Karaoğlu et al. (Reference Karaoğlu, Doğan and Alkan2010), who showed that the adsorption of reactive dyes on kaolinite is optimal at low pH (pH = 3), due to the potential of clay minerals to form bonds with H+ and OH– (Tahir & Rauf, Reference Tahir and Rauf2006).
The effect of pH on the adsorption rate of dye on clays.

The substituents which render the Direct Orange 34 dye water soluble are sodium sulfonate groups (SO3Na). In aqueous solutions, Direct Orange 34 ionizes into sodium cations and coloured sulfonate anions (Bulut et al., Reference Bulut, Ozacar and Ayhan Sengil2008; Fungaro & Bruno, Reference Fungaro and Bruno2009; Chaari et al. Reference Chaari, Moussi and Jamoussi2015). The molcule of Direct Orange 34 also has an amine group (NH2) at the end of the molecule, which may be protonated (NH3+) at low pH (Fu & Viraraghavan, Reference Fu and Viraraghavan2001; Chaari et al. Reference Chaari, Moussi and Jamoussi2015), and might achieve greater basicity, which might result in an attraction between the protonated amine (NH3+) and the negatively charged functional groups of the adsorbent according to the following schematic raction:
 $${R} \hbox{-} S{\rm O}_3 {\rm Na} + {\rm H}_2{\rm O}\; \rightarrow \; {R} \hbox{-} {\rm SO}_{3}^{-} + {\rm Na}^{+} $$
where R denotes the adsorbent surface. Moreover, zeta-potential measurements have shown that the isoelectric point, pHiep, of kaolinite is at 2.35 (Alkan et al., Reference Alkan, Demirbas and Dogan2005). The broken bonds along the surface of the clay crystals result in hydrolysis. In the acid medium, positive charges develop on the surface of the adsorbent, as shown in equation 9 (Dogan & Alkan, Reference Doğan and Alkan2003; Dogan et al., Reference Doğan, Alkan, Türkyılmaz and Özdemir2004):
 $$ = \! {\rm SO} \hbox{-} {\rm OH} + {\rm H}^ + \lrarrs {\rm SO} \hbox{-} {\rm OH}_2^{+} $$
The association of the dye anions with the positively charged kaolinite surface, resulting from the SO-OH2+ groups, might easily take place following equation 10:
 $$ = \!{\rm SO} \hbox{-}{\rm OH}_2^{+} + {\rm Dye}^ - \lrarrs {\rm SO} \hbox{-} {\rm OH}_2^{+} {\rm Dye}^{-}$$
The adsorption capacity of SDB remained nearly constant in the pH range 3–7, decreasing at higher pH (Fig. 12). Although the negatively charged surface sites do not stimulate the adsorption of anionic dye (electrostatic repulsion), a significant amount of dye is removed (70% at pH 10). This suggests that a mechanism other than chemisorption may occur simultaneously. On the other hand, the adsorption capacity of the SDBa and Fe-SDB clays decreased remarkably beyond pH 5, reaching ~68% and 43%, respectively, at pH 7. At this stage, fewer available positively charged sites are present on the clay surface.
In alkaline media (pH > 8), the removal rate of the SDBa and Fe-SDB clays increased again. Normally, at high pH, competition between OH– ions and dye anions is expected (Baskaralingam et al., Reference Baskaralingam, Pulikesi, Elango, Ramamurthi and Sivanesan2006). However, in this case, a high decolourization of the solution was observed, proving that a more complex mechanism is in operation. At higher pH values, the formation of covalent bonds between the external surface –OH groups of Si and Al atoms of the adsorbent, and negatively charged dye molecules, might explain our observations. This behaviour has already been reported with some modified clays (Baskaralingam et al., Reference Baskaralingam, Pulikesi, Elango, Ramamurthi and Sivanesan2006).
Temperature
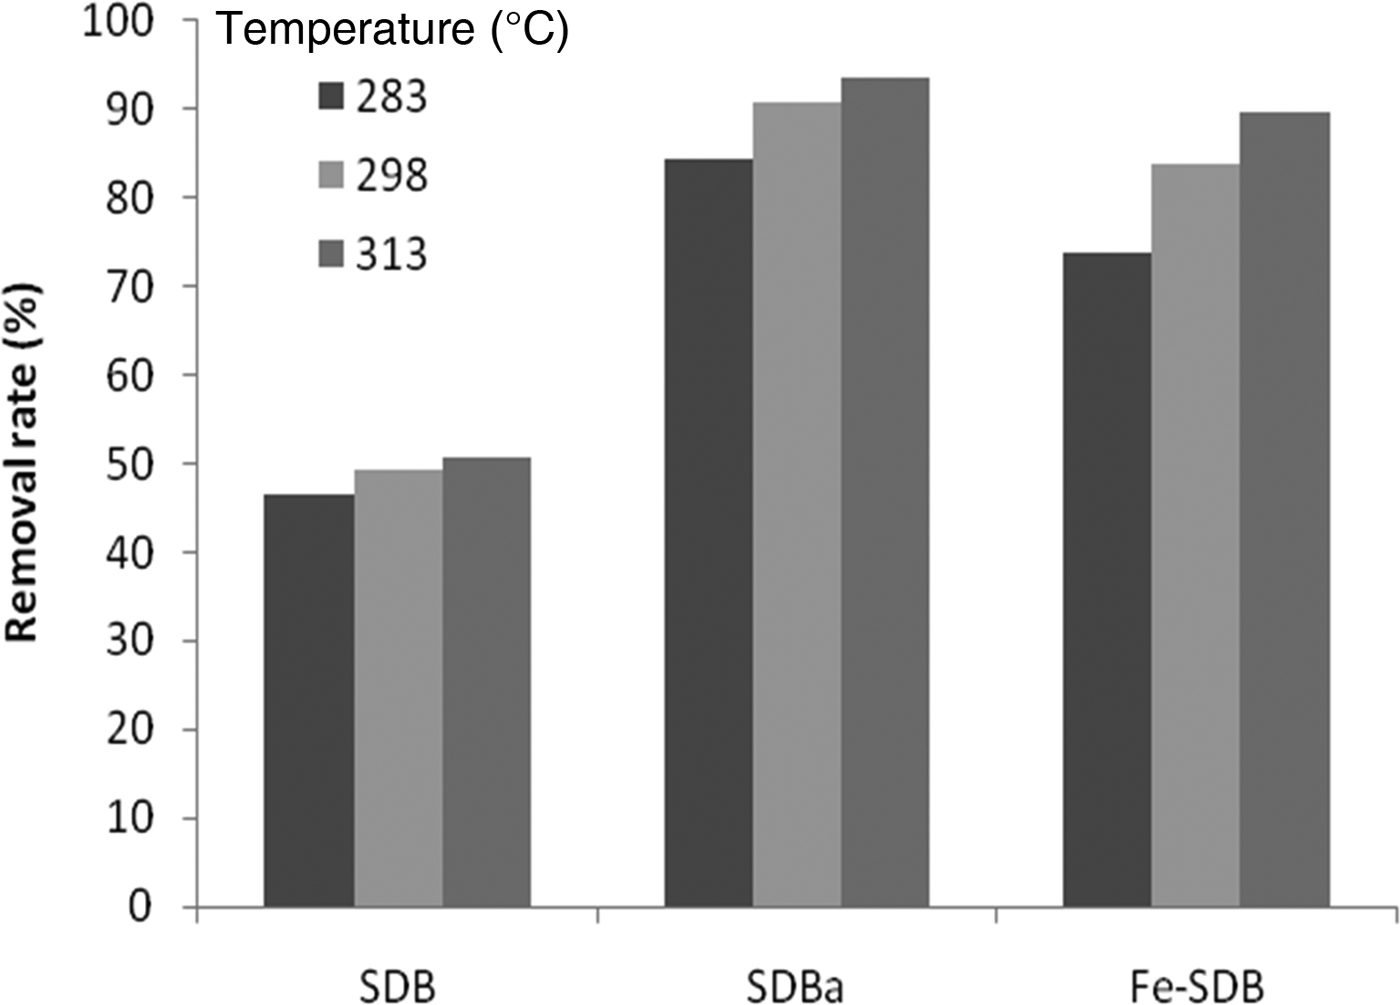
The effect of temperature on adsorption capacity was investigated by assessing adsorption isotherms at various temperatures (283, 298, 313 K) at pH 3, using an initial dye concentration of 200 ppm (Fig. 13). From 283 to 313 K, the adsorption capacity for Direct Orange 34 increased, especially of the modified sorbents (from 46.6 to 50.8% for SDB, from 73.8 to 89.7% for Fe-SDB and from 84.3 to 93.6% for SDBa). This improvement in the dye-retention rate by SDBa might be due to the partial destruction of the kaolinite structure (Gonzalez-Pradas et al. Reference Gonzalez-Pradas, Villafranca-Sanchez, Valverde-Garcia and Socias-Viciana1998), and the specific adsorption of H+ ions on the surface of kaolinite. As for Fe-SDB, the high retention rate might be attributed to the marked change in the surface charge caused by Fe impregnation (Fig. 7). With the modification of the clay-surface charge, the zeta potential increased from –2.4 mV to +39.6 mV at pH ≈ 3. Therefore, attractive forces between the adsorbent (Fe-SDB) and the dye molecules, and the number of available active sites, are expected to increase after impregnation of the Fe (Katranas et al., 2003).
Effect of the temperature on the adsorption rate of dye on clays.

The fact that the adsorption rate for Direct Orange 34 on unmodified and treated kaolinite increased with temperature should be due to an increase in the mobility of the dye with the increase in temperature (Singh, Reference Singh1998; Tsai et al., Reference Tsai, Lai and Hsien2004). An increasing number of molecules may also acquire sufficient energy to interact with active sites at the surface of the sorbent. This dependence on temperature of the amount of dye adsorbed may increase the ability of dye molecules (because of their larger diffusion coefficient) to approach the kaolinite surface. Therefore, it is suggested that the adsorption is an endothermic process (Dogan et al., Reference Doğan, Alkan, Demirbas, Ozdemir and Ozmetin2006; Hu et al., Reference Hu, Qiao, Haghseresht, Wilson and Lu2006). Similar behaviour was observed by Akgül (Reference Akgül2014) for the adsorption of the anionic dye, Congo Red, on clinoptilolite, and by Karaoğlu et al. (Reference Karaoğlu, Doğan and Alkan2010) for the adsorption of Reactive Blue 221 on kaolinite. However, these data contradict other studies (Chaari et al., Reference Chaari, Moussi and Jamoussi2015).
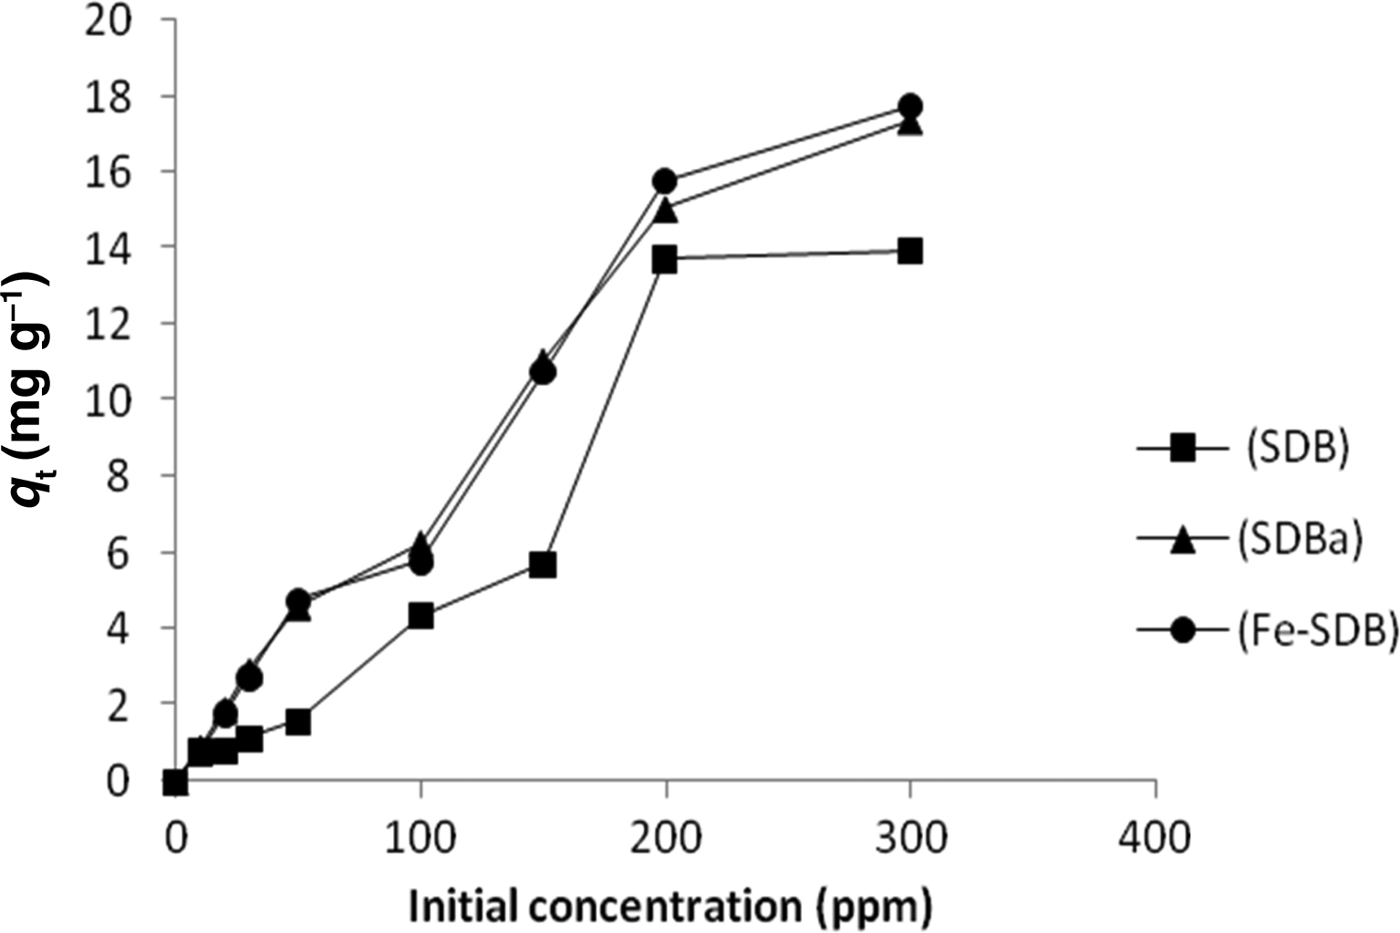
Initial dye concentration The removal efficiency of the materials decreased with decreasing dye concentration, close to the saturation equilibrium, to 14, 17.4 and 17.8 mg/g for SDB, SDBa and Fe-SDB, respectively (Fig. 14). At this level, greater competition between dye molecules at the active surface sites was reported at concentrations >200 ppm. Furthermore, in comparison to SDB, the acid-activated and Fe-impregnated sorbents exhibited more decolourization of the solution. With modification, the surface charge of the natural clay (SDB) became positive, as confirmed by the zeta potential (from –28 mV to + 39.6 mV at pH ≈ 3 for Fe-SDB). Therefore, the attractive forces between the adsorbent surface and the azo dye are expected to increase after incorporation of Fe (Katranas et al., Reference Katranas, Vlessidis, Tsiatouras, Triantafyllidis and Evmiridis2003).
Variation of the amount of dye adsorbed as a function of initial dye concentration.

Adsorption isotherms
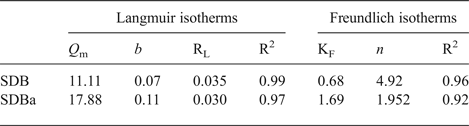
The calculated Langmuir and Freundlich parameters are reported in Table 3. The experimental data fit better with the Langmuir adsorption isotherm model, as the values of coefficients of determination (R2) are closer to 1. The Langmuir adsorption isotherm assumes that intermolecular forces decrease rapidly with distance, and that adsorption takes place at specific sites within the adsorbent. It is suggested that once the adsorbate occupies a site, no further adsorption takes place at that site (Bulut & Aydın Reference Bulut and Aydın2006). Moreover, the adsorbent surface is structurally homogeneous, with identical adsorption sites, and energetically equivalent (monolayer sorption onto a surface). The value of the coefficient, RL, indicates whether the isotherm is unfavourable (1 < RL), linear (RL = 1), favourable (0 < RL< 1) or irreversible (RL = 0). In the present study, the RL values of 0.035 for SDB and 0.03 for SDBa indicated the applicability of the Langmuir isotherm, and confirmed a monolayer coverage of the Direct Orange 34 dye on the surface of natural and acid-activated SDB clays.
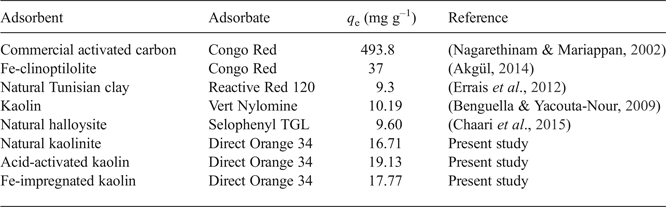
Adsorption capacities of some dyes on various adsorbents.

Langmuir and Freundlich isotherms.

Adsorption kinetics
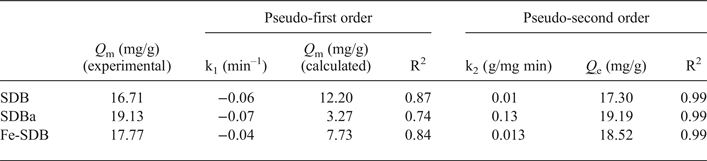
The parameters calculated for the various kinetic models are given in Table 4. A very good fit (R2 = 0.99) was obtained with the pseudo-second order model in relation to the linear variation of t/q t as a function of time t. The calculated amount of dye adsorbed at equilibrium (q e) is very close to the value obtained experimentally (Table 4). Thus, the adsorption of Direct Orange 34 on SDB, SDBa and Fe-SDB clays might be explained by the pseudo-second order kinetic model.
Adsorption kinetic parameters for the Direct Orange 34 dye.

The q m values of the adsorbents studied are also similar to, or greater than, those of the different dye-adsorbent systems listed in Table 2. However, the values are significantly smaller than the adsorption capacities achieved for commercial, coal-based mesoporous activated carbons (Nagarethinam & Mariappan, Reference Nagarethinam and Mariappan2002; Gupta et al., Reference Gupta, Mittal, Krishnan and Gajbe2004).
The best fit to the pseudo-second order kinetics indicates that the adsorption mechanism depends on the adsorbate and adsorbent (Vimonses et al., Reference Vimonses, Lei, Jin, Chow and Saint2009), and the rate-limiting step may be chemisorption, involving valence forces through sharing or exchange of electrons (Errais et al., Reference Errais, Duplaya, Elhabiri, Khodjac, Ocampod, Baltenweck-Guyote and Darragi2012; Natarajan et al., Reference Natarajan, Bajaj and Tayade2018). These results corroborate previous studies suggesting that kinetic adsorption of azo dyes on clay matches the pseudo-second order isotherm (Wang & Li, Reference Wang and Li2005; Li et al., Reference Li, Gao, Wu, Wang and Li2009). As expected and reported in the N2 adsorption-desorption isotherms study, the treated kaolins (SDBa and Fe-SDB) display greater uptake values resulting from the partial destruction of kaolinite, and modification of the clay-surface charge due to acid activation (Gonzalez-Pradas et al., Reference Gonzalez-Pradas, Villafranca-Sanchez, Valverde-Garcia and Socias-Viciana1998) or Fe impregnation (Katranas et al., Reference Katranas, Vlessidis, Tsiatouras, Triantafyllidis and Evmiridis2003).
SUMMARY AND CONCLUSIONS
The present study assessed the possible use of a Tunisian kaolin to remove Direct Orange 34, a common anionic dye, from aqueous solutions. The acid-activated kaolin (SDBa) and Fe-impregnated kaolin (Fe-SDB) are low-cost adsorbents for wastewater cleanup compared to other materials, such as activated carbon. Furthermore, Fe-SDB is relatively stable and can be reused as it can be recovered easily because of its magnetic properties. The untreated clay (SDB) retains slightly less dye than its modified counterparts. The removal of Direct Orange 34 by SDB and SDBa follows the Langmuir model. The greatest adsorption capacity achieved with modified SDB may be attributed to surface-protonation phenomena for SDBa, and to the charge reversal on the surface and the formation of new hydroxyl groups by the incorporation of Fe3+ for Fe-SDB. The adsorption kinetics of the reactive dye onto natural and modified SDB clay is quick, the equilibrium state being obtained after 15 min for SDBa and after 60 min for SDB and Fe-SDB. The adsorption profiles of all materials follow pseudo-second order models and may be described as chemisorption. The adsorption capacity increases with temperature suggesting endothermic binding phenomena between the adsorbate and adsorbents. The acidic pH enhances the dye removal due to electrostatic attraction, but >60% dye removal was still obtained at basic pH. This is indicative of the option to use the unmodified and modified SDB clays as alternative, low-cost adsorbents for the removal of Direct Orange 34 from industrial wastewaters (with pH 9–12). Thus, compared to the conventional adsorbents used, SDB clays are very promising from an industrial point of view due to their high capacity, local availability and low cost.
ACKNOWLEDGEMENTS
The authors are grateful to Wallonie-Bruxelles International, WBI, of Belgium for providing a grant as part of a cooperation project ‘Valorisation des argiles naturelles’ 2016–2018 (Axe 2 – projet 8). This work was co-financed by the MESRS (Tunisia) PJEC competetif Program - project 18PJEC02-03. B. Norberg, S. Davina Pierard, G. Rochez, B.-L. Su and V. Charles (University of Namur, Belgium), and S. Danthine and C. Bleeckers (University of Liège – AgroBioTech-Gembloux) are thanked for technical support. The authors also thank R.C. Pullar for improving the English in the manuscript.