1. Introduction
Quartzites commonly occur in various geological terrains in different parts of the world. Owing to their compositional homogeneity, they often do not develop axial planar fabric elements such as axial plane foliations on the mesoscopic scale. Moreover, if such quartzites undergo polyphase deformation (superposed folding), then analysing their superposed fold history is challenging, due to the absence of structures such as refolded secondary foliations at outcrop scale. The measurement of anisotropy of magnetic susceptibility (AMS) is a useful tool for petrofabric analysis (e.g. Hrouda, Reference Hrouda1982; Tarling & Hrouda, Reference Tarling and Hrouda1993; Zhang & Piper, Reference Zhang and Piper1994; Bouchez, Reference Bouchez, Bouchez, Hutton and Stephens1997; de Wall, Greiling & Sadek, Reference de Wall, Greiling and Sadek2001; Jayangondaperumal & Dubey, Reference Jayangondaperumal and Dubey2001; Borradaile & Jackson, Reference Borradaile, Jackson, Martín-Hernández, Lüneburg, Aubourg and Jackson2004; Mamtani & Greiling, Reference Mamtani and Greiling2005; Žák, Schulmann & Hrouda, Reference Žák, Schulmann and Hrouda2005; Kratinová et al. Reference Kratinová, Schulmann, Edel, Ježek and Schaltegger2007; Žák, Verner & Týcová, Reference Žák, Verner and Týcová2008; Mamtani & Sengupta, Reference Mamtani and Sengupta2009; Majumder & Mamtani, Reference Majumder and Mamtani2009, among others), and often deformations that do not leave mesoscopic-scale imprints can be recognized from AMS data (e.g. Stacey, Joplin & Lindsay, Reference Stacey, Joplin and Lindsay1960; Mamtani et al. Reference Mamtani, Greiling, Karanth, Merh, Radhakrishna and Piper1999; Mukherji, Chauduri & Mamtani, Reference Mukherji, Chaudhuri and Mamtani2004; Mamtani & Arora, Reference Mamtani and Arora2005). In the eastern part of India (~ 30 km SE of Jamshedpur; see inset of Fig. 1a for location) there are folded quartzites with fold axes plunging gently to the SE. On a regional scale these quartzites show superposed folding and shearing. The deformational history of the quartzites has been deciphered earlier (e.g. Naha, Reference Naha1959, Reference Naha1965; Mukhopadhyay & Sengupta, Reference Mukhopadhyay and Sengupta1971; Ghosh, Mukhopadhyay & Sengupta, Reference Ghosh, Mukhopadhyay and Sengupta2006), based on detailed structural analysis in different parts of the terrain (~ 200 km2). The western part of this region (around Galudih; see Fig. 1a for location) has folded quartzite bands that do not contain mesoscopic-scale manifestations of the regional superposed folding and shearing. The main objective of the present study is to perform AMS analysis of samples taken from various parts of the folded quartzites (limbs and hinges) over an approximately 10 km2 area and to test the robustness of the AMS data for detecting imprints of the regional superposed deformation.
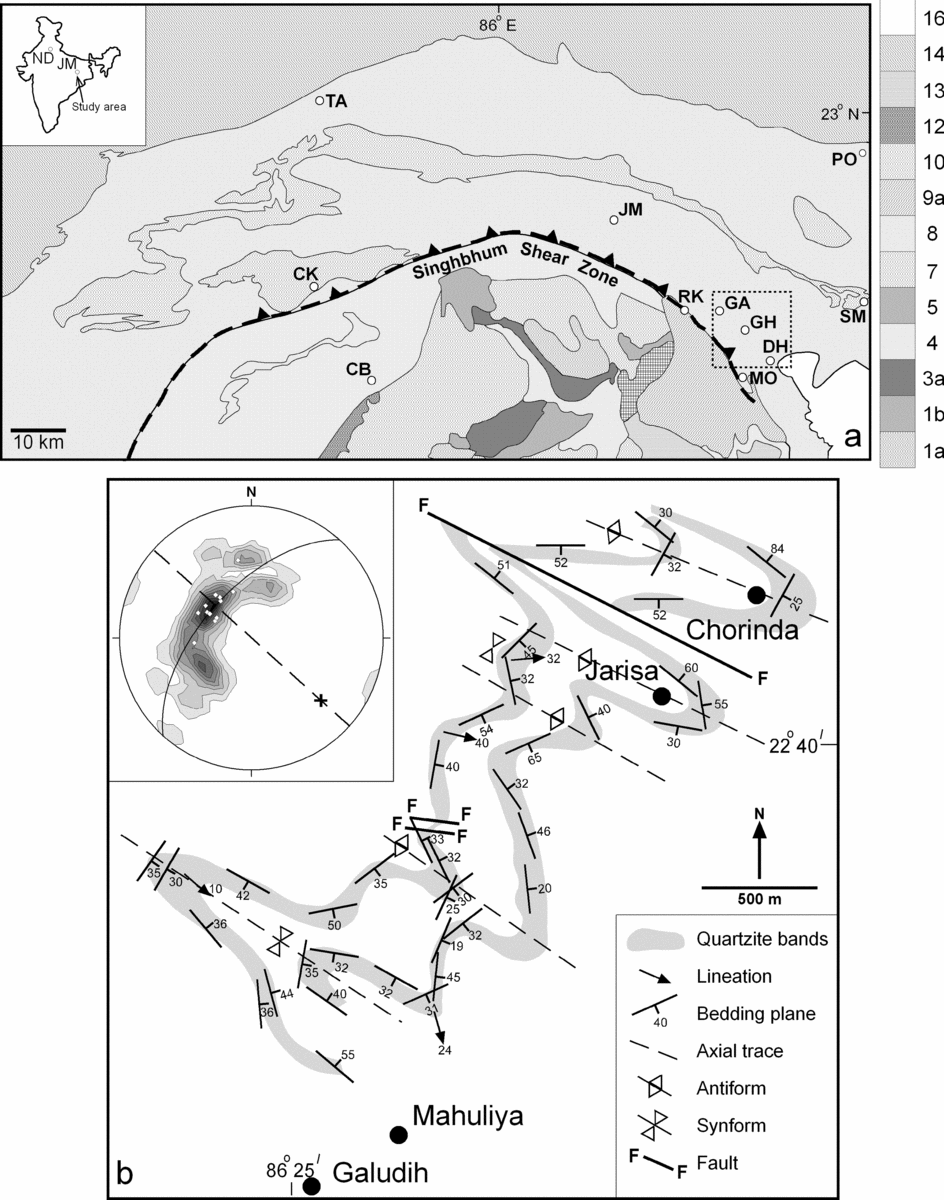
(a) Generalized lithological map of the area around Galudih, Ghatshila and Dhalbhumgarh (dotted box in the eastern part of the map). ND – New Delhi; JM – Jamshedpur; GA – Galudih; GH – Ghatshila; DH – Dhalbhumgarh; SM – Simulpal; TA – Tamar; CK – Chakradharpur; CB – Chaibasa; RK – Rakha Mines; MO – Mosabani; PO – Porapahar. Index: 1a – Older Metamorphic Group; 1b – Older Metamorphic Tonalite group; 2 – Pallahara Gneiss; 3a – Singhbhum Granite Phase I; 4 – Iron Ore Group Lavas; 5 – Iron Ore Group Shales; 7 – Singhbhum Granite Phase III; 8 – Singhbhum Group; 9a – Dhanjori Lavas; 10 – Dalma Lavas; 12 – Kolhan Group; 13 – Mayurbhanj Granite; 14 – Chotanagpur Granite Gneiss; 16 – Alluvium. (b) Structural map of the quartzite bands around Galudih. Inset in (b) is the lower hemisphere equal area projection of poles to bedding planes (S0; n = 42). White rhombs are poles to S0 at hinges of folds. Cross represents the π-axis (fold axis plunging 30° towards 132°). NW–SE-striking dashed line represents the average orientation of the axial plane. Bedding plane symbols indicate degree of dip.

2. Geology of the study area
The study area comprises metasedimentary rocks (quartzites and intercalated schists) that belong to the Proterozoic mobile belt of eastern India and lie between the Dalma synclinorium in the north and the Singhbhum Shear Zone in the south (Fig. 1a). The reader is referred to the work of Dunn & Dey (Reference Dunn and Dey1942) for an older account of regional geology of the area; a recent review has been given by Saha (Reference Saha1994). Structural geological investigations have been carried out by various workers (e.g. Naha, Reference Naha1959, Reference Naha1965; Mukhopadhyay & Sengupta, Reference Mukhopadhyay and Sengupta1971; Mukhopadhyay, Ghosh & Chattopadhyay, Reference Mukhopadhyay, Ghosh and Chattopadhyay2004; Mamtani et al. Reference Mamtani, Ghosh, Chaudhuri and Sengupta2004; Ghosh, Mukhopadhyay & Sengupta, Reference Ghosh, Mukhopadhyay and Sengupta2006). On a regional scale, imprints of three deformation events have been reported in the Galudih–Ghatshila–Dhalbhumgarh region (Fig. 1a for locations). The area comprises the Ghatshila syncline in the west and Dhalbhumgarh syncline in the east; a culmination separates the two depressions. In the vicinity of Galudih, two quartzite bands are clearly traceable, with the western one being older than the eastern one (Naha, Reference Naha1965; Fig. 1b). The quartzite bands are folded with the fold axis plunging moderately towards the SE and with vertically dipping NW–SE-striking axial planes (Fig. 1b). The quartzites are jointed and NE–SW-striking joints dominate. These have been considered as cross-joints (Mamtani et al. Reference Mamtani, Ghosh, Chaudhuri and Sengupta2004). The folds in these quartzites (vicinity of Galudih) were mapped as D1 structures by Naha (Reference Naha1965). Around Ghatshila (SE of Galudih), the fold axis plunges steeply to the NW defining a canoe-shaped geometry, which was attributed to variation in the configuration of the sedimentational trough (Naha, Reference Naha1965; see Fig. 2). In the eastern extremity of the area (around Simulpal; see Fig. 1a for location), Mukhopadhyay & Sengupta (Reference Mukhopadhyay and Sengupta1971) mapped a continuation of the quartzites of the Galudih–Ghatshila region as D2 structures. According to these authors, D1 structures are preserved as rootless isoclinal folds defined by quartzose lenses in schists. They also reported crenulation cleavage in the schists to infer that the major folds and axial planar foliation in the region belong to D2 folds.
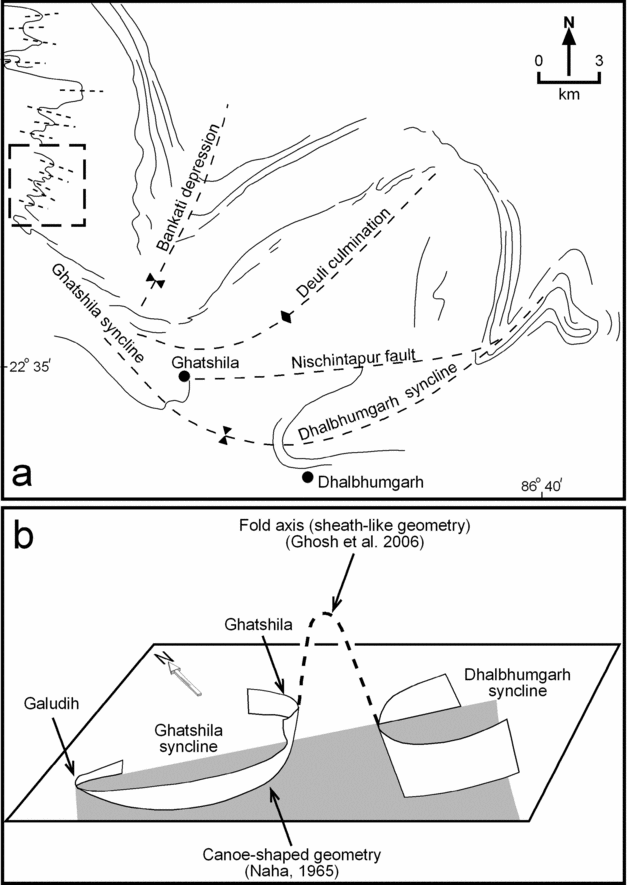
(a) Regional geological map of the study area showing the regional synclines as well as culminations and depressions (after Ghosh, Mukhopadhyay & Sengupta, Reference Ghosh, Mukhopadhyay and Sengupta2006). Dashed box in the western part of the map marks the area shown in Figure 1b that was investigated in the present study. (b) Schematic diagram showing the sheath-like geometry of the regional folds in the Galudih–Ghatshila–Dhalbhumgarh area (after Ghosh, Mukhopadhyay & Sengupta, Reference Ghosh, Mukhopadhyay and Sengupta2006). The folds around Galudih plunge due SE, while those around Ghatshila plunge due NW, thus resulting in a canoe-shaped geometry (Naha, Reference Naha1965). See text for discussion.

To the southeast of Ghatshila lies the Dhalbhumgarh syncline. The D2 folds here plunge steeply to the ENE with the schistosity striking ESE–WNW (Mukhopadhyay, Ghosh & Chattopadhyay, Reference Mukhopadhyay, Ghosh and Chattopadhyay2004). Ghosh, Mukhopadhyay & Sengupta (Reference Ghosh, Mukhopadhyay and Sengupta2006) have documented the presence of ductile shear structures such as shear bands and mylonitic foliations associated with D2 structures. From this evidence they concluded that ductile shearing occurred during the later stages of D2 deformation. The U-shaped synclinal fold closures of the Ghatshila and Dhalbhumgarh synclines face in opposite directions and have steep westerly and easterly plunges, respectively, defining an acute culmination of the D2 fold axis (Fig. 2). According to Ghosh, Mukhopadhyay & Sengupta (Reference Ghosh, Mukhopadhyay and Sengupta2006), this culmination and depression defines the overall geometry of the Dhalbhumgarh–Ghatshila region as a sheath-like fold (Fig. 2a, b) that developed due to movement on D2 schistosity. D2 was followed by D3 deformation that resulted in broad curving of D2 axial traces (Banakati Depression in Fig. 2a).
Thus, it is clear from the above description that the regional deformation history of the area is complex. The objective of the present investigation is to carry out AMS analysis of quartzites in the vicinity of Galudih (boxed area in Fig. 2a) and see the extent to which magnetic fabric of the rocks developed on a relatively small scale of an approximately 10 km2 area preserves evidence of the regional deformation events that can be deciphered from mesoscopic fabrics developed on a much larger scale over an approximately 200 km2 area.
3. AMS analysis of folded quartzites around Galudih
The analysis of AMS involves inducing magnetism in a sample in different directions and measurement of the induced magnetization in each direction. The results can be approximated in terms of an ellipsoid that is referred to as the AMS ellipsoid with three principal axes K1, K2 and K3 (K1 ≥ K2 ≥ K3). Subsequently, the mean susceptibility, [Km = (K1 + K2 + K3)/3], the strength of the magnetic foliation, [F = (K2 − K3)/Km], and strength of the magnetic lineation, [L = (K1 − K2)/Km], are calculated. Moreover, following Jelinek (Reference Jelinek1981), the degree of magnetic anisotropy P′ and shape parameter (T) are calculated as follows:

Here, η1 = ln K1, η2 = ln K2, η3 = ln K3 and ηm = (η1.η2.η3)1/3. While P′ is a measure of the eccentricity of the AMS ellipsoid, T defines the shape of the AMS ellipsoid. The latter varies from −1 to +1; a prolate shape yields a negative T value and oblate shape a positive value (Tarling & Hrouda, Reference Tarling and Hrouda1993).
In the present study, AMS was measured using the KLY-4S Kappabridge (AGICO, Czech Republic) in the Department of Geology & Geophysics, Indian Institute of Technology, Kharagpur (India). The instrument has an operating frequency of 875 Hz and the measurements were made in the spinner mode in a field intensity of 300 Am−1. In this spinner mode, the AMS of a spinning specimen fixed in the rotator is measured. The specimen rotates with a speed of 1 revolution per 2 seconds inside the coil of the Kappabridge and the susceptibility is measured 64 times during one revolution. The measurements are made along three perpendicular axes and the above-mentioned AMS parameters are calculated using the program SUFAR that runs the measurements. The sensitivity of AMS measurement in the spinner mode is 2 × 10⁻⁸ (SI units). Oriented samples from a total of 18 sites from different locations around the folded quartzite bands in the vicinity of Galudih were taken. Multiple cores (2.54 cm diameter, 2.2 cm length) were investigated from each site; a total of 108 cores from 18 sites were analysed. Data from all cores from a particular site were used to calculate the mean values of the various AMS parameters (Jelinek statistics: Jelinek, Reference Jelinek1981). The program Anisoft (version 4.2; AGICO, Czech Republic) was used for this calculation. The results of the analysis are described below.
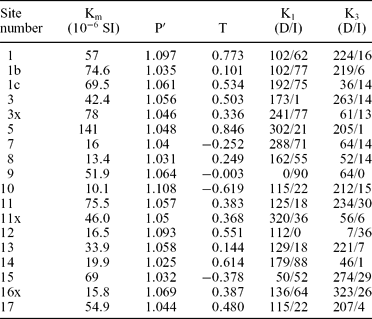
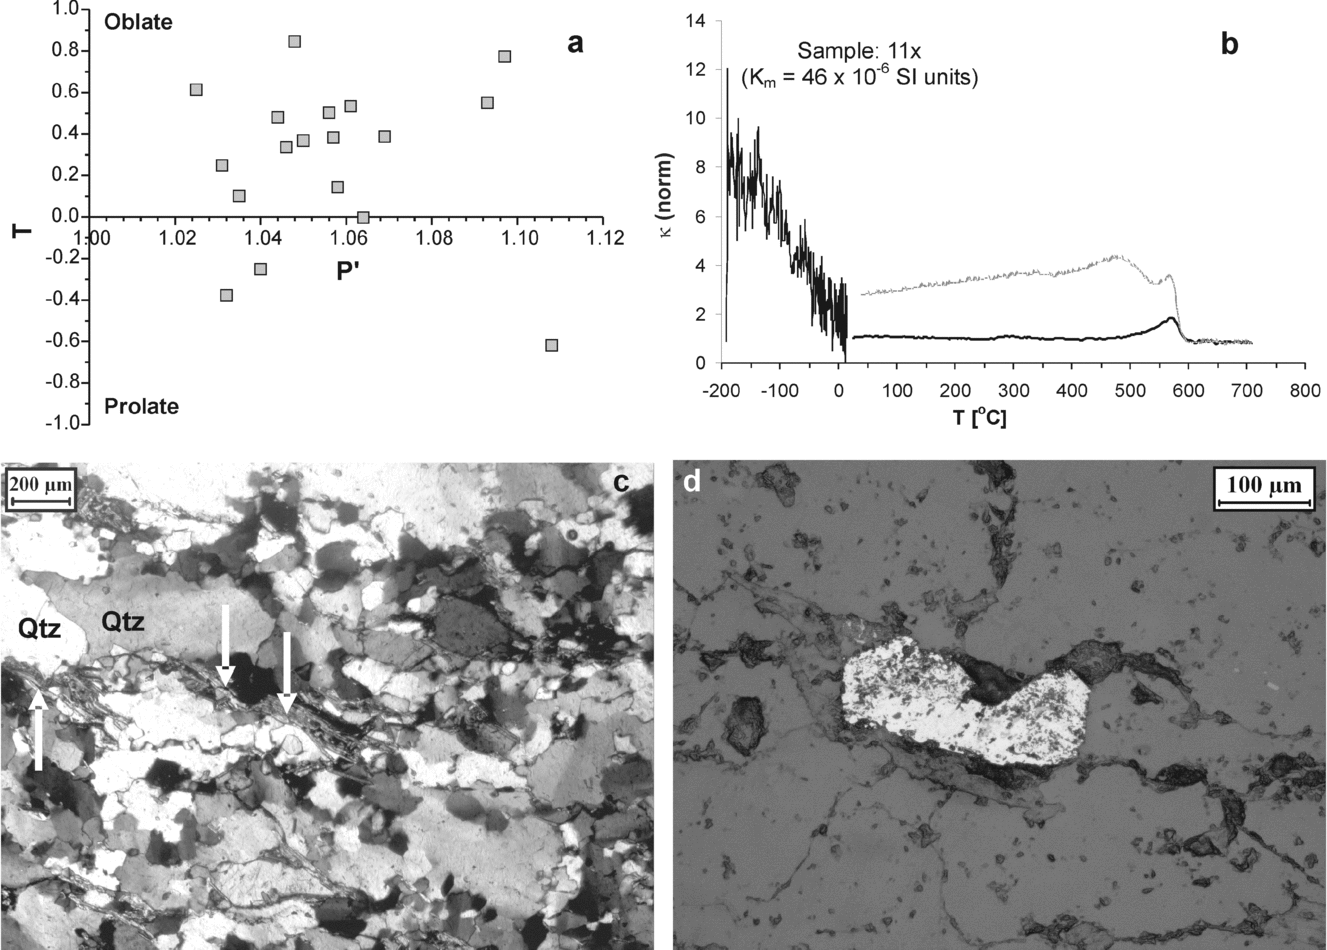
The quartzites have low Km values (between 10.1 × 10⁻⁶ SI for site 10 and 141 × 10−6 SI for site 5; Table 1). Figure 3a is the Jelinek plot (Jelinek, Reference Jelinek1981) for the samples, which indicates that the shape of AMS ellipsoid in most of the samples is oblate. Quartz, being diamagnetic, has a negative magnetic susceptibility (−13.4 × 10⁻⁶ SI units: Tarling & Hrouda, Reference Tarling and Hrouda1993). Positive Km values of the quartzites (Table 1) are indicative of the presence of some Fe-bearing minerals along with diamagnetic quartz. Temperature variation of magnetic susceptibility (κ−T) analyses were performed on powdered samples of some of the quartzites using the CS-3 furnace (from room temperature to 700 °C) and the CS-L cryostat (from −196 °C to 0 °C) attached to the KLY-4S Kappabridge in the magnetic laboratory of Universität Karlsruhe (TH), Germany. The κ−T curve (Fig. 3b) implies the presence of traces of magnetite. Further, it is noted that the susceptibility increases during heating (above 500 °C), which points to some formation of magnetite during the heating experiment. Transmitted light petrographic studies (Fig. 3c) revealed the presence of micas (muscovite and biotite). Moreover, ore petrography of polished thin-sections showed the presence of some magnetite grains (Fig. 3d) that have undergone martitization. Thus, it is confirmed that the positive susceptibilities of the investigated quartzites are due to traces of Fe-bearing minerals (magnetite and biotite).
AMS data of the quartzite samples analysed from the area around Galudih (eastern part of India)

Km, P′ and T are the mean susceptibility, (corrected) degree of magnetic anisotropy, and shape parameter respectively. D/I refers to the declination/inclination of the maximum (K1) and minimum (K3) principle axis of the AMS ellipsoid.
(a) Jelinek (P′ v. T) plot of the quartzites analysed in the present study. (b) Temperature variation of magnetic susceptibility (κ–T) curve of a quartzite sample. (c) Photomicrograph showing presence of mica (muscovite and biotite; white arrows) in the quartzite of the study area. Qtz – quartz. (d) Photomicrograph (polished thin-section; reflected light) showing magnetite in the quartzite sample. The magnetite is martitized (see text for details).

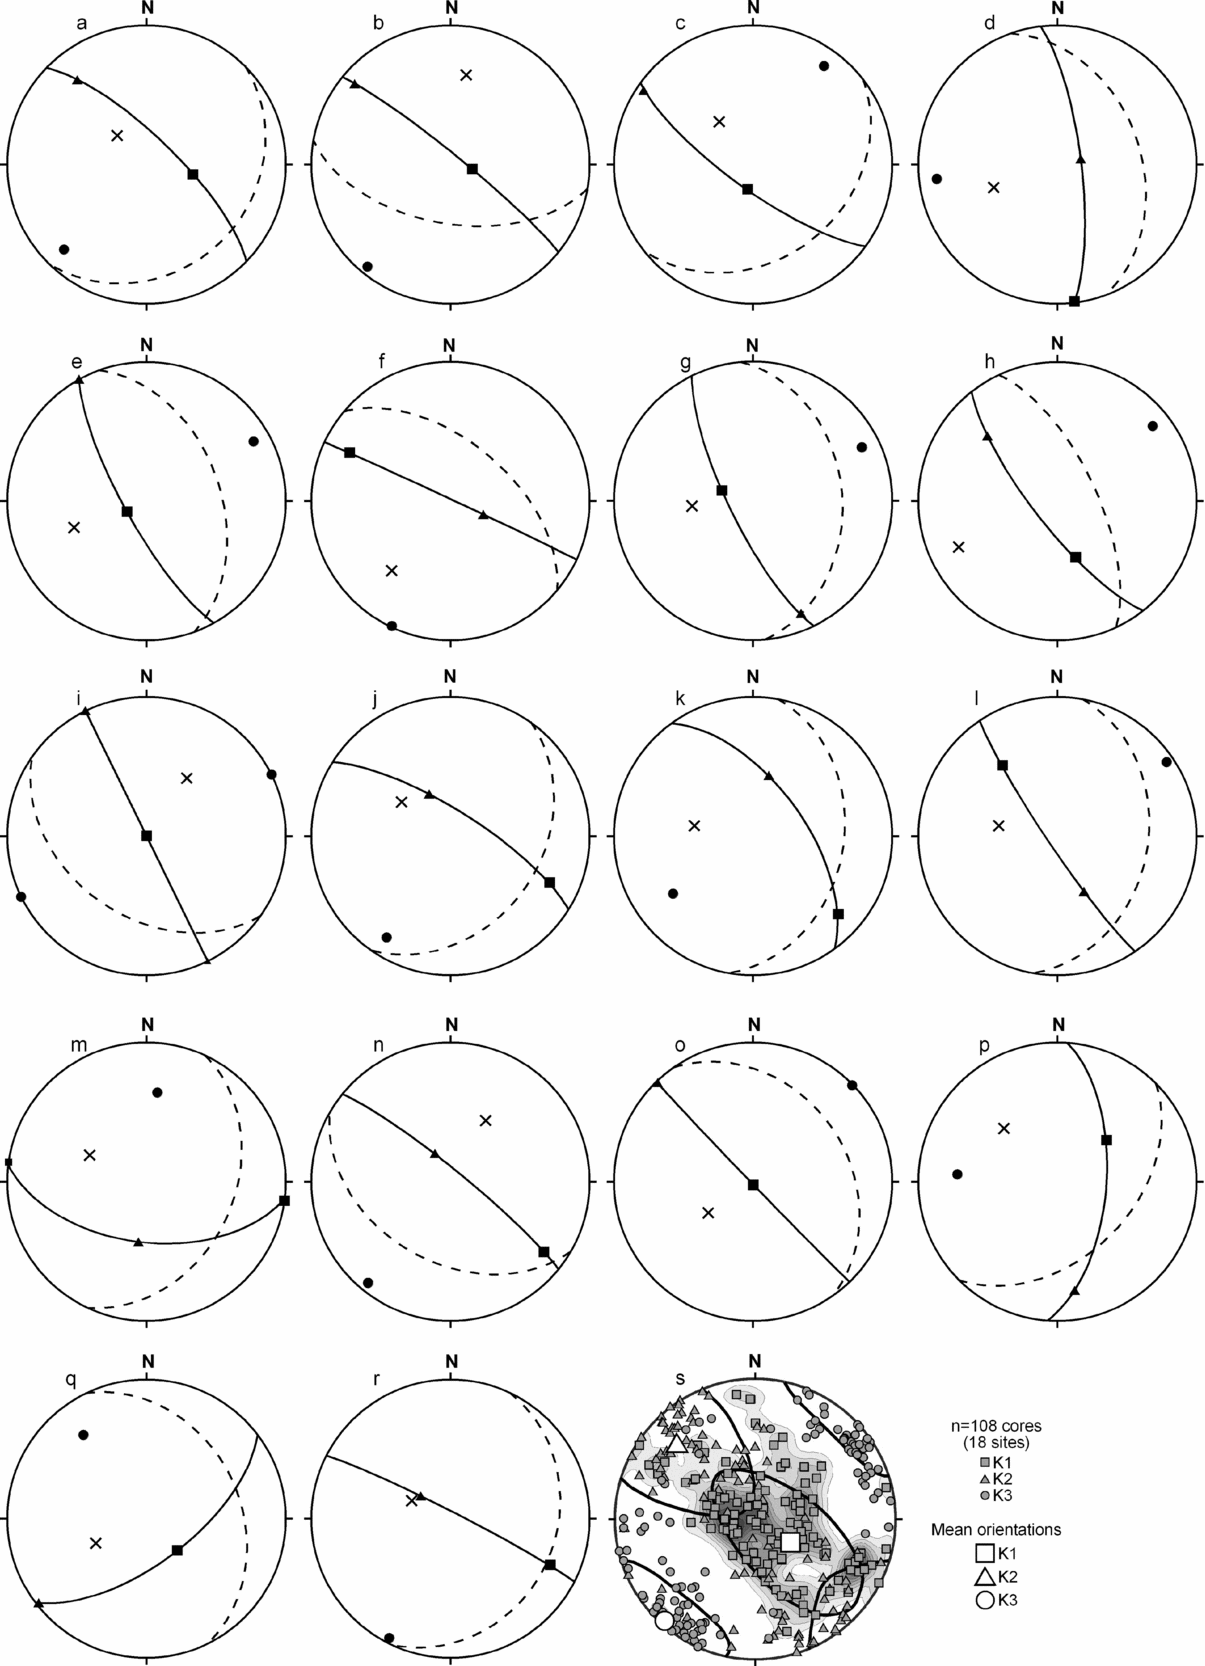
Parts a to r of Figure 4 show lower hemisphere equal area projections of mean K1, K2 and K3 orientations for the 18 sites investigated here. As stated above, mean values were calculated using Anisoft 4.2 (AGICO, Czech Republic). Magnetic foliation plane (K1K2 plane defined by common great circle containing K1 and K2) and bedding plane for each site (dashed great circle in Fig. 4a–r) are also plotted on each individual projection. It is noted that the magnetic foliation is dominantly NW–SE striking. The authors have also contoured K1 orientations as well as plotted K1, K2 and K3 orientations of individual cores (n = 108) for all the sites (Fig. 4s). This also reveals that the magnetic foliation is NW–SE oriented. It may be noted that the plunge of K1 varies from SE through vertical to NW. The significance of this variation is discussed in Section 4.
Lower hemisphere equal area projections of K1 (square), K2 (triangle) and K3 (circle) orientations recorded in the investigated quartzites. (a) to (r) show mean orientations for sampling site 1, 1b, 1c, 3, 3x, 5, 7, 8, 9, 10, 11, 11x, 12, 13, 14, 15, 16x and 17, respectively. Magnetic foliation (common great circle containing K1 and K2) is plotted in each projection. The orientation of the bedding plane at each site is also plotted as a pole (cross) as well as great circle (dashed). (s) Lower hemisphere equal area projection of K1, K2 and K3 for individual cores (n = 108 cores) studied from 18 sites. Mean orientations of K1, K2 and K3 calculated using Anisoft 4.2 (AGICO, Czech Republic) from data of all cores are also plotted. K1 orientations of individual cores were contoured and are also shown in the same diagram. Note that the magnetic foliation is NW–SE striking and the plunge of K1 varies from SE through vertical to NW. See text for discussion.

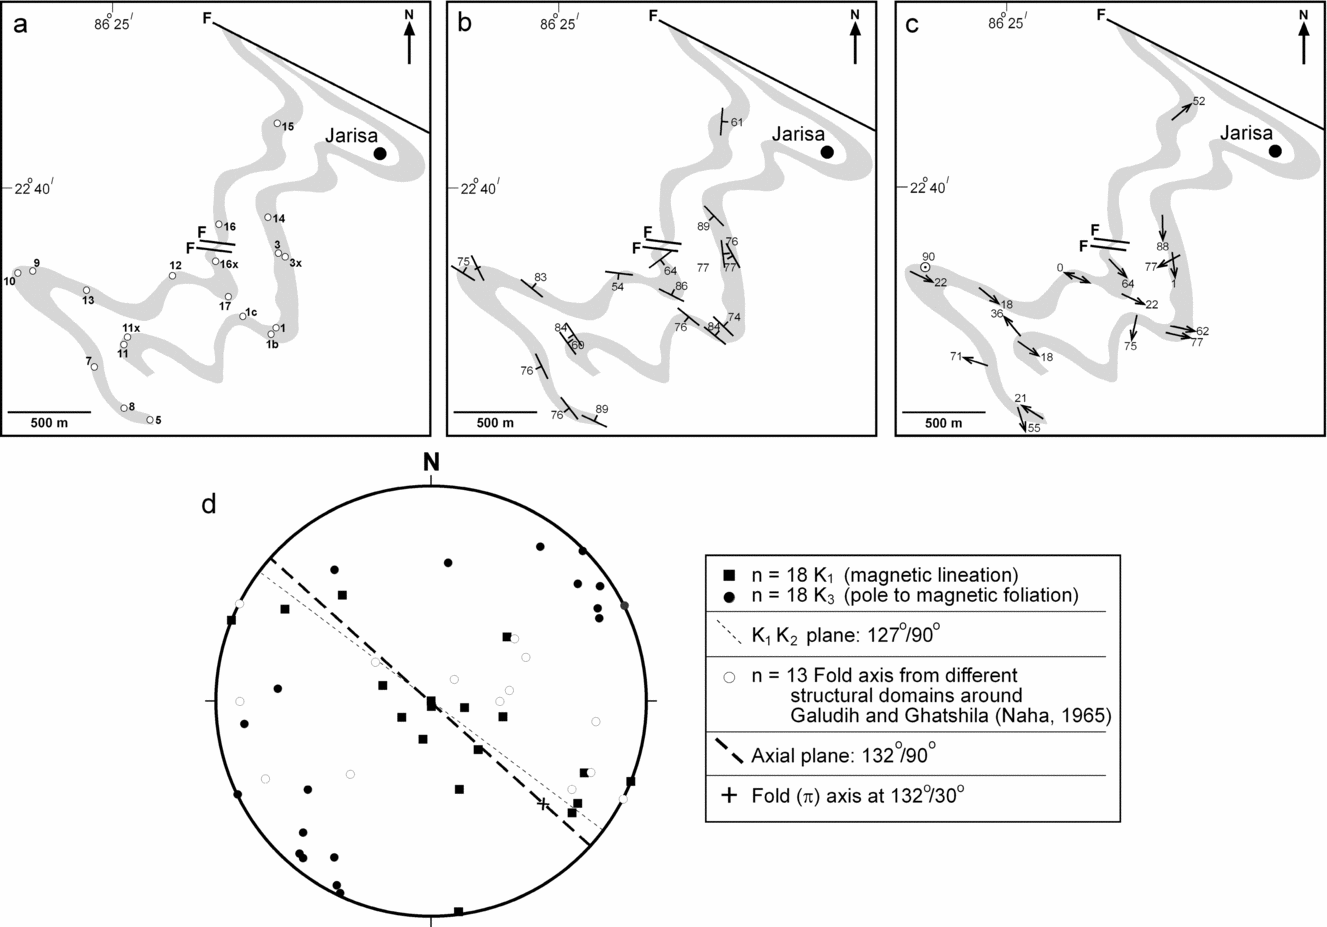
Figure 5b, c shows the magnetic foliation and lineation maps of the quartzite bands (see Fig. 5a for locations of AMS sampling sites). Figure 5d is a synoptic diagram showing the lower hemisphere equal area projection of the mean orientations of K1 (magnetic lineation) and K3 (pole to magnetic foliation) recorded in the samples. It is noted that on average the magnetic foliation (K1K2 plane) is vertical with a NW–SE strike. Naha (Reference Naha1965) divided the region in the vicinity of Galudih and Ghatshila into several domains and performed a detailed structural analysis of planar and linear structural elements. The orientations of lineations recorded in the different domains by Naha (Reference Naha1965) are also plotted in the same lower hemisphere equal area projection (Fig. 5d), the significance of which is discussed in the following Section.
(a) AMS sampling site map of the quartzites investigated. (b) and (c) are magnetic foliation and magnetic lineation maps, respectively, of the quartzites. (d) Lower hemisphere equal area projection of orientation of magnetic lineation (K1) and pole to magnetic foliation (K3) of the samples investigated. Index gives explanation of the symbols. See text for discussion.

4. Discussion
Hrouda (Reference Hrouda1986) discussed the problem of using AMS data from quartzites as a measure of magnitude of strain. Accordingly, the degree of magnetic anisotropy in quartzites may be used as a proxy of strain if Km > 50 × 10−6 SI. However, Hrouda (Reference Hrouda1986) stated that the orientations of K1, K2 and K3 can be used for structural geological interpretations even if Km < 50 × 10−6 SI. In the present study, many quartzites have very low susceptibilities (< 50 × 10−6 SI). Therefore, following Hrouda (Reference Hrouda1986), the authors have preferred to base their interpretations on orientations of AMS data.
4.a. Magnetic foliation and axial plane orientation
On the mesoscopic scale, the folded quartzites are largely devoid of axial planar fabric elements, such as axial plane cleavage. Using field planar data from limbs of the mesoscopic folds, the mean axial plane orientation of the folds is determined to be NW–SE striking with vertical dip (Fig. 1b; also see Naha, Reference Naha1965). The mean orientation of the magnetic foliation recorded in the Galudih quartzites is subparallel to the axial planar direction of the mesoscopic folds recorded around Galudih (Fig. 5d). This indicates that although the quartzites of the study area have not developed an axial planar foliation on the mesoscopic scale, there was development of fabric in the axial planar direction, which is recognized from the AMS analysis.
Naha (Reference Naha1965) stated that the folds in the study area developed as a consequence of flexural folding. Most of the samples produce an oblate shape of the AMS ellipsoid, which indicates a flattening strain. Moreover, the magnetic foliation is steep and is parallel to the axial plane direction of the folds. This indicates (a) shortening perpendicular to the axial plane direction and (b) apart from flexural folding, homogeneous shortening must have been dominant to result in the development of a magnetic fabric that is parallel to the axial plane direction. This supports the inference of Mamtani et al. (Reference Mamtani, Ghosh, Chaudhuri and Sengupta2004), who suggested that the interlayered sequence of quartzites and schists in the study area developed Class 1C geometry folds that were further enhanced by homogeneous shortening.
4.b. Magnetic lineations and superposed folding in Galudih quartzites
The rocks in the region around Galudih, Ghatshila and Dhalbhumgarh (see Fig. 1 for locations) have been extensively mapped in the past and, as discussed in Section 2, the superposed fold history on a regional scale is well established. On a regional scale, the rocks have undergone three episodes of deformation. All the mesoscopic folds in the quartzite bands around Galudih show a fold axis plunging uniformly to the SE. On a regional scale, there are culminations and depressions. Near Ghatshila (SE of the study area), the folds plunge steeply towards the NW, thus resulting in a canoe-shaped geometry, which was attributed to variation in the configuration of the sedimentational trough by Naha (Reference Naha1965), but is considered to be an indication of superposed deformation by Mukhopadhyay, Ghosh & Chattopadhyay (Reference Mukhopadhyay, Ghosh and Chattopadhyay2004) and Ghosh, Mukhopadhyay & Sengupta (Reference Ghosh, Mukhopadhyay and Sengupta2006). The latter workers have also demonstrated that to the southeast of Ghatshila, around Dhalbhumgarh, there is evidence of ductile shearing and the regional folds plunge towards the ENE. This variation in regional structure to the southeast of Ghatshila is due to a sheath-like regional folding. According to the present study, the AMS data from the Galudih quartzites provides evidence in favour of the regional sheath-like geometry and superposed deformation.
In the present study, AMS analysis was performed on samples from quartzite bands near Galudih, which lies in the western part of the region. The π-axis (fold axis) lies almost on the mean orientation of the magnetic foliation plane (Fig. 5d). Although a few magnetic lineations (K1) plunge gently to the SE, with orientations sub-parallel to the fold axis, most K1 orientations vary from SE through vertical to NW (Fig. 5d). This variation is also noted in Figure 4s, where K1 orientations from all the individual cores (n = 108) were plotted as well as contoured. The authors have plotted the orientations of fold axes in different structural domains in the region around Galudih and Ghatshila (as reported by Naha, Reference Naha1965) in the same lower hemisphere equal area projection along with the magnetic data (open circles in Fig. 5d). It is noted that the variation in orientation of K1 from quartzites around Galudih is similar to the variation of the fold axis orientations on a regional scale. This implies that although the Galudih area, which occupies the westernmost part of the terrain, did not develop mesoscopic-scale superposed folds, there was some influence of the regional deformation on the quartzites that is manifested in the variation of the magnetic lineations. This would also imply that the variation in orientation of the fold axis on a regional scale must be tectonic in origin and cannot be attributed to variations in basin configuration. It was suggested by Mukhopadhyay, Ghosh & Chattopadhyay (Reference Mukhopadhyay, Ghosh and Chattopadhyay2004) and Ghosh, Mukhopadhyay & Sengupta (Reference Ghosh, Mukhopadhyay and Sengupta2006) that regional D2 deformation was responsible for the development of superposed folds (culminations and depressions) as well as sheath-like geometry in the vicinity of Ghatshila and Dhalbhumgarh. We infer that the variation in the orientation of the K1 axis (from SE through vertical to NW) in the Galudih area is an imprint of this regional-scale superposed deformation. Thus, the present study indicates that the regional-scale superposed folding influenced fabric development in the quartzites around Galudih. Although this did not lead to a mesoscopic-scale superposition/variation of structures, it is manifested in the variation of magnetic fabric orientation data.
5. Conclusions
The present study demonstrates the robustness of measuring AMS to decipher superposed fabrics in quartzites that are devoid of mesoscopic-scale evidence of multiple deformation events. The analyses of quartzites from the folds in an approximately 10 km2 area around Galudih (eastern India) reveals that the fold axis plunges gently to the SE. However, the orientation of the magnetic lineation varies from SE through vertical to NW. This variation in the orientation of the magnetic lineation correlates well with the regional-scale variation in the fold axis in different structural domains located in an approximately 200 km2 area between Galudih, Ghatshila and Dhalbhumgarh (reported by earlier workers); this variation has been attributed to development of sheath-like geometry on a regional scale due to shearing related to D2 deformation (Ghosh, Mukhopadhyay & Sengupta, Reference Ghosh, Mukhopadhyay and Sengupta2006). Thus, it is concluded that the magnetic fabric developed in folded quartzites around Galudih preserves within it evidence of regional-scale superposed deformation and shearing.
Acknowledgements
The authors thank two anonymous referees for their comments that helped improve the paper. Discussions with D. Mukhopadhyay, Dilip Saha, Agnes Kontny and M. K. Panigrahi were found useful. However, the authors take all responsibility for the inferences made in this paper. Thanks are due to R. O. Greiling for extending laboratory facilities to perform temperature variation of magnetic susceptibility (κ−T) analysis during MAM's stay at Universität Karlsruhe (TH), Germany, which was funded by the Alexander von Humboldt Foundation under the ‘Resumption of Research Stay’ Alumni programme for Humboldt Research Fellows.