


Introduction
Continuous combustion of fossil fuels and land-use change raised the atmospheric CO2 concentration from 280 ppm in preindustrial era to 375 ppm at present, with a rate of increase unprecedented compared to the past 20 000 years (IPCC 2001). However, the increase of atmospheric CO2 is lower than expected. During the 1980s the discharge of CO2 due to the fossil fuel burning (5.4 ± 0.3 PgC yr-1) was higher than the accumulation of anthropogenic CO2 in the atmosphere (only 3.3 ± 0.1 PgC yr-1, Sarmiento & Gruber Reference Sarmiento and Gruber2002). According to these authors the difference, which amounts to 2.1 ± 0.3 PgC yr-1, is taken up by the ocean (1.9 ± 0.6 PgC yr-1) and by the biosphere (0.2 ± 0.7 PgC yr-1). Thus, the ocean is a key reservoir which buffers the accumulation of anthropogenic CO2 in the atmosphere. This means that how much CO2 remains in the atmosphere is in turn controlled by the amount taken up by the oceans (Chen & Drake Reference Chen and Drake1986).
The ocean absorption of atmospheric CO2 is not evenly distributed over the world ocean and is strongly influenced by circulation: the deepest penetration is associated with convergence zones at temperate latitudes, while low vertical penetration is generally found in upwelling areas (Sabine et al. Reference Sabine, Feely, Gruber, Key, Lee, Bullister, Wanninkhof, Wong, Wallace, Tilbrook, Millero, Peng, Kozyr, Ono and Rios2004).
Deep water formation is certainly one important pathway for the sequestration of atmospheric CO2 and its transport to the deep ocean. In particular Antarctic Bottom Water (AABW) formed in the Southern Ocean may provide a mechanism to transport anthropogenic CO2 into the ocean. The continental shelves of Antarctica are one of the two main sources of deep waters for the global ocean, along with the Nordic seas in the North Atlantic Ocean (Doney & Hecht Reference Doney and Hecht2001). AABW is formed at a limited number of locations along the Antarctic coast, where very dense and cold (θ < -1.7°C) near surface Shelf Waters are created by ocean-ice-atmosphere interaction. These waters then sink down along the continental slope as narrow and thin (tens of kilometres wide and 100–200 m thick) bottom boundary currents (Price & Baringer Reference Price and Baringer1994). The overflow of AABW is then counterweighed by the entrainment of warmer (θ > 0°C) Circumpolar Deep Water (CDW) (Orsi et al. Reference Orsi, Johnson and Bullister1999).
Anthropogenic carbon concentration cannot be measured directly. It can only be estimated using measured properties of seawater. Back calculation techniques allow the separation of the anthropogenic CO2 from the bulk of TCO2 (total inorganic carbon) in the water column, taking into account TCO2 variations due to circulation, remineralization and dissolution of calcium carbonate. Several back calculation techniques followed the first attempts by Brewer (Reference Brewer1978) and Chen & Millero (Reference Chen and Millero1979) to separate the anthropogenic CO2 signal, trying to lower the uncertainties associated with these methods (Shiller Reference Shiller1981, Broecker et al. Reference Broecker, Takahashi and Peng1985). Other authors proposed different models, such as the Mix method of Goyet et al. (Reference Goyet, Coatanoan, Eischeid, Amaoka, Okuda, Healy and Tsunogai1999), based on an optimum multiparametric mixing analysis (Tomczak Reference Tomczak1981, Mackas et al. Reference Mackas, Denman and Bennett1987) and the most recent TrOCA method proposed by Touratier & Goyet (Reference Touratier and Goyet2004a).
One of the key questions concerning the Southern Ocean's role in the anthropogenic carbon sequestration is whether this ocean, like the North Atlantic Ocean, is able to take up huge amounts of atmospheric CO2. Model based estimates have shown a large sink for anthropogenic carbon (Cant) in the Southern Ocean south of 40°S (Sarmiento et al. Reference Sarmiento, Hughes and Stouffer1998, Matear & Hirst Reference Matear and Hirst1999), while most data-based methods estimate very little storage of anthropogenic CO2 south of 50°S (Poisson & Chen Reference Poisson and Chen1987, Gruber Reference Gruber1998, Sabine et al. Reference Sabine, Key, Johnson, Millero, Poisson, Sarmiento, Wallace and Winn1999, Hoppema et al. Reference Hoppema, Roether, Bellerby and De Baar2001, Sabine et al. Reference Sabine, Feely, Gruber, Key, Lee, Bullister, Wanninkhof, Wong, Wallace, Tilbrook, Millero, Peng, Kozyr, Ono and Rios2004), amounting to only 9% of the global inventory (Sabine et al. Reference Sabine, Feely, Gruber, Key, Lee, Bullister, Wanninkhof, Wong, Wallace, Tilbrook, Millero, Peng, Kozyr, Ono and Rios2004). From this reconstruction, low anthropogenic CO2 concentrations are associated with Antarctic Bottom Waters, even though the exact estimate of the anthropogenic CO2 content of this water is hampered by the limited carbon data in regions where these bottom waters are formed. Moreover, anthropogenic CO2 uptake predicted for the Southern Ocean by models show a large variability (Matear & Hirst Reference Matear and Hirst1999). A contradiction exists between the low data based estimates of Cant and the significant concentrations of CFCs observed both along the continental slope and in Antarctic deep and bottom waters (Meredith et al. Reference Meredith, Watson, Van Scoy and Haine2001, Orsi et al. Reference Orsi, Smethie and Bullister2002, Rivaro et al. Reference Rivaro, Bergamasco, Budillon, Frache, Hohmann, Massolo and Spezie2004a). These factors highlight the need for new direct estimates in the Southern Ocean. Today, in fact, there are only scarce TCO2 measurements throughout the water column in the Ross Sea (Bates et al. Reference Bates, Hansell and Carlson1998, Gordon et al. Reference Gordon, Codispoti, Jennings, Millero, Morrison and Sweeney2000, Sweeney et al. Reference Sweeney, Hansell, Carlson, Codispoti, Gordon, Marra, Millero, Smith and Takahashi2000a, Reference Sweeney, Smith, Hales, Bidigare, Carlson, Codispoti, Gordon, Hansell, Millero, Park and Takahashi2000b, Sweeney Reference Sweeney2003) and in the Weddell Sea (Poisson & Chen Reference Poisson and Chen1987, Hoppema et al. Reference Hoppema, Fahrbach, Stoll and De Baar1998, Reference Hoppema, De Baar, Fahrbach and Bellerby2002), thus leading to very few studies of anthropogenic carbon distribution in these two areas of AABW formation (Poisson & Chen Reference Poisson and Chen1987, Lo Monaco et al. Reference Lo Monaco, Metzl, Poisson, Brunet and Schauer2005a, Reference Lo Monaco, Goyet, Metzl, Poisson and Touratier2005b).
This study is based on data collected during the summer 2003 (January–February) within the framework of the XVIII Antarctic Expedition of the Italian PNRA (National Program of Research in Antarctica) activities. The aim is to observe the inorganic carbon properties of the different water masses which characterize the western Ross Sea during the summer and to estimate their anthropogenic carbon content. The summer water masses of the Ross Sea are extensively described in literature (Jacobs et al. Reference Jacobs, Amos and Bruchhausen1970, Reference Jacobs, Fairbanks and Horibe1985, Reference Jacobs and Comiso1989, Carmack Reference Carmack, Angel and Deacon1977, Locarnini Reference Locarnini1994, Jacobs & Giulivi Reference Jacobs, Giulivi, Spezie and Manzella1999, Budillon et al. Reference Budillon, Tucci, Artegiani, Spezie, Faranda, Guglielmo and Ianora1999, 2003). They are represented by five main water types: High Salinity Shelf Water (HSSW), Ice Shelf Water (ISW), Circumpolar Deep Water (CDW), Modified Circumpolar Deep Water (MCDW), Antarctic Surface Water (AASW). Each of them can be identified by its total alkalinity (TA), total inorganic carbon (TCO2), dissolved oxygen (O2), nutrient and CFC concentrations, and different concentrations of anthropogenic carbon. For the estimation of anthropogenic carbon in the waters of the Ross Sea we applied two independent data-based methods with the aim of comparing the results obtained by the two approaches. Actually few comparisons exist between different methods (back-calculation techniques and/or models) to estimate anthropogenic carbon (Coatanoan et al. Reference Coatanoan, Goyet, Gruber, Sabine and Warner2001, Sabine & Feely Reference Sabine and Feely2001, Lo Monaco et al. Reference Lo Monaco, Goyet, Metzl, Poisson and Touratier2005b, Friis Reference Friis2006). This work presents the first estimate of anthropogenic carbon distribution in the Ross Sea using two independent methods which are compared with the anthropogenic CFC tracer. It further provides an estimate of the anthropogenic carbon uptake by the Ross Sea.
Materials and methods
Sampling and analysis
Within the framework of the XVIII expedition of the Italian National Program of Research in Antarctica, the CLIMA (Climatic Long-term Interactions for the Mass-balance in Antarctica) project cruise was conducted from 5 January–5 March 2003, in the Ross Sea on board the RV Italica. During this cruise 126 stations were sampled for the hydrology and water chemistry parameters. 570 discrete seawater samples were also collected for TA and TCO2 measurements at 86 of these stations (Fig. 1).
Map showing the location of stations in the general survey in the Ross Sea during the CLIMA cruise in January–February 2003. Only the stations where TCO2 and TA data were collected are shown. The zoom b. reports the stations of a mesoscale experiment performed across the shelf break in the area off Cape Adare. The stations labelled are the ones used for the section A–B–C studied in this paper. The crosses on the map indicate the extent of the Ross Ice Shelf.

Seawater samples and hydrographical data (depth, temperature, and salinity) were collected using a multiparameter CTD probe (SBE 9/11) equipped with two temperature and two conductivity sensors and with a SBE Carousel water sampler.
Samples for TA and TCO2 analysis were collected into 500 ml borosilicate glass screw cap bottles using standard sampling protocols (Dickson & Goyet Reference Dickson and Goyet1994) and poisoned with saturated HgCl2 solution to prevent modification in TCO2 due to biological activity. Most of the samples were analysed on board shortly after collection, while the remaining samples were stored in the dark at +4°C and analysed later at the Department of Chemistry of the University of Bologna.
TA and TCO2 were measured simultaneously by a potentiometric titration system using the method of Edmond (Reference Edmond1970) described in the DOE Handbook of Methods for CO2 Analysis (Dickson & Goyet Reference Dickson and Goyet1994). TA and TCO2 were estimated using a non-linear least-squares approach similar to that used by Dickson (Reference Dickson1981). The accuracy of the measurements (±4 µmol kg-1 for TA and TCO2) was monitored by routine analysis of Certified Reference Materials (CRMs, batch 58, provided by A.G. Dickson, Scripps Institution of Oceanography). The precision, evaluated using replicate analysis of surface and deep samples, was estimated to be ±3 and ±4 µmol kg-1 for TA and TCO2 respectively.
Dissolved oxygen was measured on board by Winkler method using automated micro-titrations (Grasshoff Reference Grasshoff, Grasshoff, Ehrhardt and Kremlig1983). Measurement precision was ±0.5 µmol kg-1.
Water samples for tracer analyses were collected from 12 L Niskin bottles, equipped with an epoxy coated stainless steel spring, in 60 ml glass ampoules avoiding any contact with air. All ampoules were flame sealed in Ultra Pure N2 atmosphere. The flame-sealed ampoules were stored in dark, cold conditions (+4°C). The CFCs were analysed with a specific purge and trap gas chromatographic system with a 63Ni electron capture as detector according to the methods described by Bullister & Weiss (Reference Bullister and Weiss1988) and Smethie et al. (Reference Smethie, Chipman, Swift and Koltermann1988). A 5090 Hewlett Packard GC was used with a pre-column of Porasil C and an analytical column packed with Carbograph 1 (60–80 mesh) phase, 183 cm in length. Measurement precision was about 6%.
Anthropogenic CO2 estimate
In order to estimate the anthropogenic CO2 in the Ross Sea we applied two independent methods. The first one, referred as MIX method, proposed by Goyet et al. (Reference Goyet, Coatanoan, Eischeid, Amaoka, Okuda, Healy and Tsunogai1999), is based on an Optimum Multiparametric Mixing Analysis. The second one, recently detailed in Touratier & Goyet (Reference Touratier and Goyet2004a, Reference Touratier and Goyet2004b), is based on the definition of the semi-conservative tracer TrOCA (Tracer combining Oxygen, inorganic Carbon and total Alkalinity).
These methods present the advantage of being independent and based upon very different assumptions. In addition they do not rely upon assumed preformed TA and TCO2 values, as most other methods do (Brewer Reference Brewer1978, Chen & Millero Reference Chen and Millero1979, Gruber Reference Gruber1998, Pérez et al. Reference Pérez, Álvarez and Ríos2002, Lo Monaco et al. Reference Lo Monaco, Metzl, Poisson, Brunet and Schauer2005a, Reference Lo Monaco, Goyet, Metzl, Poisson and Touratier2005b).
The MIX method
This method is based on an Optimum Multiparametric Mixing Analysis (OMPA) (Tomczak Reference Tomczak1981, Mackas et al. Reference Mackas, Denman and Bennett1987) to quantify the contributions of the different water sources to the observed data. The detailed description of the analysis is provided in several works (Mackas et al. Reference Mackas, Denman and Bennett1987, Tomczak & Large Reference Tomczak and Large1989, You & Tomczak Reference You and Tomczak1993), and this kind of analysis has previously been used in the Ross Sea providing a good estimate of the mixing process and of the circulation of the different water masses (Budillon et al. Reference Budillon, Pacciaroni, Cozzi, Rivaro, Catalano, Ianni and Cantoni2003).
The mixing coefficient (k j) of the (n) water sources are solved from the following system of equations:
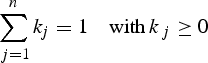
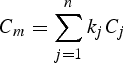
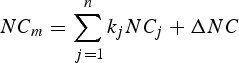
where the conservative tracers (C m) used are salinity and potential temperature and the non conservative tracers (NC m) are oxygen and total alkalinity.
The method used to estimate the concentration of anthropogenic CO2 in each water source is described in detail by Goyet et al. (Reference Goyet, Coatanoan, Eischeid, Amaoka, Okuda, Healy and Tsunogai1999). This method is based upon the assumption that, below the mixed layer depth, the measured TCO2 ⌊TCO2meas⌋ results from three contributions:

Where ⌊TCO2cir⌋ is the concentration resulting from mixing and circulation of the different water masses; ⌊TCO2bio⌋ is the concentration affected by the biological processes and ⌊TCO2ant⌋ is the concentration of anthropogenic CO2. ⌊TCO2cir⌋ is calculated from the mixing coefficient (k j) and the preanthropogenic concentration ⌊TCO2°⌋j in each of the n water source j
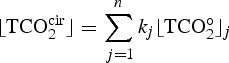
The term ⌊TCO2bio⌋ is computed as follow:

Where ΔO2 and ΔTA are evaluated from the OMPA analysis (Eq. 3).
In Eq. (5), the preindustrial concentrations of the source waters ⌊TCO2°⌋j are unknown. Only the sum ⌊TCO2ant + TCO2°⌋j is known. Therefore, Eq. (5) is not explicitly used.
For the calculation of each ⌊TCO2ant⌋ a sigmoid function (F j(z)) is introduced to take into account the fact that anthropogenic CO2 decreases with increasing depth as the age of each water source differs. Various sigmoid functions are used according to the geographical location and depth of the water source. Therefore, the ⌊TCO2ant⌋ of each water source is determined below the wintertime mixed layer from the following equation:
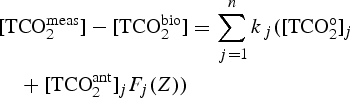
with the constraint:

The constants of the sigmoid and the values of ⌊TCO2ant⌋j are estimated iteratively by minimizing the residuals of Eq. (7) randomly around zero. Finally ⌊TCO2ant⌋ is calculated throughout the water column from the following equation:
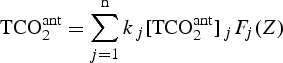
The water source characteristics (potential temperature, salinity, O2, TA and TCO2W) used here are summarized in Table I. The different sources of water masses in the studied area were typically identified using the two conservative tracers temperature and salinity by analysing the θ/S diagram for the hydrological stations sampled reported in Fig. 2. This figure indicates that five main different water sources were present: the Antarctic Surface Waters (AASW), the Circumpolar Deep Water (CDW), the Modified Circumpolar Deep Water (MCDW), the High Salinity Shelf Water (HSSW) and the Deep Ice Shelf Water (DISW). With the exception of MCDW, which is a modification of the water type CDW, all the other four water sources were considered in the analysis. The MCDW was not included into the multiparametric analysis because it did not change the results in terms of accuracy in the estimation of the mixing coefficients. Therefore, for the sake of simplicity, we used only four water masses. These water mass characteristics are similar to those described earlier by other authors (Jacobs et al. Reference Jacobs, Amos and Bruchhausen1970, Budillon et al. Reference Budillon, Pacciaroni, Cozzi, Rivaro, Catalano, Ianni and Cantoni2003, Sweeney Reference Sweeney2003). The definition of the different water sources in terms of depth, salinity and temperature was hence based on the analysis of the θ/S diagram in Fig. 2. The most significant difference from literature definitions of water masses was for AASW, since the presence of intense phenomena of melting during the cruise made surface waters colder and less saline than that reported by other authors (Jacobs et al. Reference Jacobs, Fairbanks and Horibe1985). For the non conservative tracers O2 and TA, the values used in the multiparametric analysis were those measured during the cruise.
Potential temperature versus salinity plot for all the stations sampled for TCO2 and TA. The black marks indicate the different source water type: they are Circumpolar Deep Water (CDW), Modified Circumpolar Deep Water (MCDW), High Salinity Shelf Water (HSSW), Deep Ice Shelf Water (DISW) and Antarctic Surface Waters (AASW). All of them except MCDW have been used in the Optimum Multiparametric Analysis.

Physical and chemical properties for the water source used in the multiparameter analysis defined from the θ/S diagram. Where, [TCO2W] represents the TCO2 measured in each water source “j”. a, b, c, d, e represent the coefficients of the sigmoid function Fj(Z). with: Fj(Z) = a–b / [1−e-(c (z−d))]e + b.

The mixed layer depth used for the analysis was 70 m. It corresponds to the maximum mixed layer depth calculated from the density gradient of 0.02 σθ as proposed by Price et al. (Reference Price, Mooers and Van Leer1978) and applied by Park et al. (Reference Park, Charriaud, Ruiz Pino and Jeandel1998) to Antarctic data.
The TrOCA method
This approach is based on the ‘quasi-conservative’ behaviour of the tracer TrOCA (see Eq. 10) in the same way as Broecker (Reference Broecker1974) did for the quasi-conservative tracers NO and PO. It has been shown that TrOCA deviates significantly from the conservative behaviour when waters are thought to be contaminated with anthropogenic CO2 (Touratier & Goyet Reference Touratier and Goyet2004a). The analogous tracer, with conservative properties, TrOCA0 is hence defined in the same way (Eq. 11), but it is free of any anthropogenic contribution, i.e. TrOCA0 is defined as the pre-industrial TrOCA. In the original paper (Touratier & Goyet Reference Touratier and Goyet2004b), TrOCA0 was computed only as a function of θ. Here we used an improved equation based on θ and TA (Eq. 12) (Touratier et al. 2007).



Since in Eq. (10) only TCO2 is significantly affected by the atmospheric increase of CO2, Cant concentration can be simply computed as follows:

where a represents the Redfield coefficient. Since TrOCA° has conservative property, the four parameters (a, b, c, d) are determined by minimizing the fit standard error of Eq. (12). Hence the anthropogenic carbon is estimated using the following equation:

The uncertainty associated with the TrOCA method is estimated by error propagation using the uncertainty on the measured parameters and the coefficients. For this work, the uncertainty on Cant is estimated to 4 µmol kg-1.
The original TrOCA method (Touratier & Goyet Reference Touratier and Goyet2004b) has previously been applied to the waters of the North Atlantic Ocean (Touratier & Goyet Reference Touratier and Goyet2004a), to the Equatorial Atlantic Ocean (Touratier et al. Reference Touratier, Goyet, Coatanoan and Andrié2005), to the Mediterranean Sea (Aït-Ameur & Goyet Reference Aït-Ameur and Goyet2006) and to the Southern Ocean along 30°E between South Africa and Antarctica (WOCE line I6) (Lo Monaco et al. Reference Lo Monaco, Metzl, Poisson, Brunet and Schauer2005a, Reference Lo Monaco, Goyet, Metzl, Poisson and Touratier2005b). The improved TrOCA° relationship was applied to the Indian Ocean (Touratier et al. 2007).
Results and discussion
Ross Sea hydrology
The Ross Sea can be defined as the area located in the Pacific sector of the Southern Ocean, bounded to the south by the Ross Ice Shelf and to the north-east by the 1000 m isobath (located at about 73°S) between Cape Adare (170°E) and Cape Colbeck (158°W) (Fig. 1).
Different water masses can be identified on or near the continental shelf of the Ross Sea based on their thermohaline properties (Fig. 2).
Circumpolar Deep Water (CDW) originates in the Antarctic Circumpolar Current (ACC) at depths below 2000 m, but reaches 200 m when it moves poleward (Locarnini Reference Locarnini1994). It exhibits the highest temperature (1.17°C) and is relatively salty (34.70). CDW episodically intrudes onto the shelf at specific locations related to bottom topography (Dinniman et al. Reference Dinniman, Klinck and Smith2003), providing heat to the shelf waters (Jacobs et al. Reference Jacobs, Fairbanks and Horibe1985, Locarnini Reference Locarnini1994, Jacobs & Giulivi Reference Jacobs and Giulivi1998, Reference Jacobs, Giulivi, Spezie and Manzella1999, Gouretsky Reference Gouretsky, Spezie and Manzella1999, Budillon et al. Reference Budillon, Fusco and Spezie2000). Once on the shelf it mixes with fresher and colder shelf waters and is hence distinguished as Modified Circumpolar Deep Water (MCDW) (Jacobs et al. Reference Jacobs, Amos and Bruchhausen1970), identifiable by a subsurface maximum temperature (-0.84°C) and minimum dissolved oxygen (Jacobs et al. Reference Jacobs, Fairbanks and Horibe1985, Budillon et al. Reference Budillon, Tucci, Artegiani, Spezie, Faranda, Guglielmo and Ianora1999, Rivaro et al. Reference Rivaro, Frache, Bergamasco and Hohmann2003). Its salinity is lower than CDW being around 34.54.
The Ross Sea shelf is an area where dense waters form. The High Salinity Shelf Water (HSSW) is the densest one, with salinity ranging from 34.75 to 35.00, increasing with depth and temperature close to the surface freezing point, between -1.95 and -1.75°C (Budillon et al. Reference Budillon, Gremes Cordero and Salusti2002). HSSW is formed during the winter in the western side of the Ross Sea, in the Terra Nova Bay polynya area, by continual formation and removal of new ice by the strong katabatic winds flowing down to the Antarctic plateau (Kurtz & Bromwich Reference Kurtz and Bromwich1983, Reference Kurtz and Bromwich1985, Jacobs et al. Reference Jacobs, Fairbanks and Horibe1985, Van Woert Reference Van Woert1999). This process increases seawater salinity by brine rejection during ice formation and, as a consequence, the water is denser and sinks. From there, one branch moves northward toward the shelf break in the area off Cape Adare, while another branch moves southward beneath the Ross Ice Shelf taking part to the production of Deep Ice Shelf Water (DISW) (Jacobs et al. Reference Jacobs, Fairbanks and Horibe1985). This latter is colder (-2.03°C) and less salty (34.68) than HSSW. The northward branch of HSSW reaches the continental shelf break where it mixes with the Modified Circumpolar Deep Water (MCDW) forming deep and bottom waters (Jacobs et al. Reference Jacobs, Amos and Bruchhausen1970, Gordon & Tchernia Reference Gordon and Tchernia1972, Rodman & Gordon Reference Rodman and Gordon1982, Budillon et al. Reference Budillon, Tucci, Artegiani, Spezie, Faranda, Guglielmo and Ianora1999).
Finally the Antarctic Surface Water (AASW) with lower salinity and relatively cold temperatures displays higher variability in its thermohaline fields, reflecting atmospheric influences. This water mass, in fact, shows an extremely variable behaviour, being influenced by ice melting and formation and by atmospheric precipitations (Jacobs et al. Reference Jacobs, Fairbanks and Horibe1985). During the 2003 cruise the stations located in the Terra Nova Bay polynya and on the right side of the iceberg B15 displayed typical thermohaline characteristics of AASW as found in literature with temperature ranging between -0.50 and 0°C and salinity > 34, while the remaining stations presented a much colder and less saline surface layer (T < -1.2°C and salinity < 34) resulting from massive melting of pack ice and/or local wind characteristics.
In this work we show the results obtained for thermohaline fields, carbon properties, dissolved oxygen, anthropogenic carbon and CFC 11 concentrations along a section starting from the tip of the iceberg B15, moving near the Ross Ice Shelf and re-ascending to the area off Cape Adare, in the north-western Ross Sea (Fig. 3).
Distribution of a. temperature (°C), b. salinity, c. dissolved O2 (O2, μmol kg-1), d. total alkalinity (TA, μmol kg-1), and e. total inorganic carbon (TCO2, μmol kg-1) along the A–B–C section from 0 to 2000 m showed on the map in Fig. 1.

In general the salinity profile (Fig. 3b) indicates a stratified water column with the highest values at the bottom (S > 34.70). This is indicative of the presence of a HSSW layer in most part of the continental shelf, identified by temperatures close to the surface freezing point (-1.9°C) also (Fig. 3a). In the B–C sector of the salinity plot we can observe a thin layer of water with salinity > 34.7 flowing down the slope, evidencing an active down slope process.
TCO2, TA and O2 distribution in the studied area
The different water masses described above and defined by their thermohaline field are also characterized by specific carbonate properties and oxygen concentrations. Table I summarizes the thermohaline properties together with O2, TA and TCO2 concentrations of the main water sources characterizing the investigated area as measured during the CLIMA cruise (January–March 2003). Next we will describe the distribution of TA, TCO2 and O2 on the section showed in Fig. 3c–e throughout the Ross Sea.
TA, TCO2 and O2 along this section show a gradient in their vertical distributions. TA and TCO2 increase with depth whereas O2 decreases with depth. TCO2 concentrations range from a minimum of 2148 µmol kg-1 to a maximum of 2270 µmol kg-1, with lower values near the sea surface reflecting high biological activity and a CO2 removal mainly by photosynthesis. TA concentrations range between 2278 and 2370 µmol kg-1g. Dissolved oxygen concentrations range from 385 µmol kg-1 at the surface to about 190–200 µmol kg-1 at intermediate depth, corresponding to the CDW intrusion on the shelf. CDW is well characterized on the B–C section (Fig. 3) at stations 92 and 93, in the area across the shelf break off Cape Adare. This water mass is characterized by high concentration in TA (2355 ± 5 µmol kg-1) and TCO2 (2261 ± 4 µmol kg-1) and low concentration in O2 (190 ± 5 µmol kg-1). These concentrations are due to the relatively older ventilation age of CDW compared to the recently formed shelf waters, so that the mineralization of organic matter increases its TCO2 concentration consuming O2. CDW intrudes onto the shelf and mixes with shelf waters rising Modified Circumpolar Deep Water (MCDW), characterized by a potential temperature subsurface maximum (-0.84°C) and a dissolved oxygen minimum (244 µmol kg-1). This mixing results in a lower TCO2 content (2250 µmol kg-1), which is very close to the typical TCO2 concentration of HSSW filling the bottom of the shelf, therefore these two water masses are not easily distinguishable based on their TCO2 concentrations.
HSSW is present on the bottom at several stations of the continental shelf. For instance, a strong signal is observed in Fig. 3a at casts 33 to 36 at the bottom (salinity > 34.8). Its TCO2 concentration is 2247 ± 3 µmol kg-1, TA is 2355 ± 2 µmol kg-1 and dissolved O2 289 ± 5 µmol kg-1.
Finally DISW was observed at casts 38, 39, 40, 48 as a thin layer at about 300–400 m depth characterized by a temperature minimum of -2.1°C, which is below the surface freezing point. Its TCO2 and TA concentrations (respectively 2242 ± 4 µmol kg-1 and 2339 ± 3 µmol kg-1) are lower than those of the HSSW. Since DISW originates from mixing of HSSW with fresh melting water from the base of the Ross Ice Shelf, this water appears colder and less saline than HSSW. The DISW is enriched in dissolved oxygen, reflecting the fact that it contains ventilated HSSW (Rivaro et al. Reference Rivaro, Frache, Bergamasco and Hohmann2003).
The TA, TCO2 and O2 concentrations here reported for the main water masses are in good agreement with the previous study of Sweeney Reference Sweeney(2003). Nevertheless, the total inorganic carbon presents more variation at the surface water. This could be explained by the fact that during the experiment the area was strongly covered with ice hence surface temperature was colder (-1.2 ± 0.4°C) than that reported by Sweeney Reference Sweeney(2003) (-0.96 ± 0.25°C).
Anthropogenic CO2 distribution
Anthropogenic carbon distribution has been estimated along the same section shown in Fig. 3 using both the MIX method and the recently developed TrOCA method. The results for the two approaches are shown in Fig. 4.
Anthropogenic CO2 (Cant) distribution in the water column, below the mixed layer depth (70–2000 m), along the A–B–C section showed on the map calculated respectively with a. TrOCA method (CantTrOCA, μmol kg-1), and b. MIX method (CantMIX, μmol kg-1). c. Represent the distribution of CFC-11 (pmol kg-1) on the same section between 70 and 2000 m.

The two methods display similar features. Both of them point out that in the Ross Sea the entire water column has already been invaded by anthropogenic carbon suggesting that the intense ice formation, brine release and vertical convection occurring during the winter in coastal polynyas, as previously observed by Jacobs et al. (Reference Jacobs, Fairbanks and Horibe1985), represent a pathway for anthropogenic carbon to reach the deepest layers of the oceans. As a result, no water mass in the studied area is sufficiently old to be free of anthropogenic carbon.
Normally the highest concentrations of anthropogenic carbon are found at the surface, because the gas exchange with the atmosphere occurs in the upper oceanic layers. Both the MIX method and the TrOCA method, like the other back calculation methods, cannot be applied in the upper mixed layer (here 0–70 m) where numerous biological processes and air-sea CO2 fluxes modify the upper ocean carbon content on a short (< week) time scale.
From a qualitative point of view the two methods gave similar distribution of anthropogenic carbon: Figure 4 illustrates the different water masses summarized in Table I. They are well distinguishable according to their Cant concentrations. The east–west gradient of anthropogenic CO2 revealed by the two methods clearly indicates that the shelf waters are more contaminated than the open sea. The vertical distribution on the shelf (section A–B) shows (for the two methods) an increase of anthropogenic carbon from the mixed layer to depth. In the shelf-to-slope area (section B–C) the two methods found the minimum anthropogenic carbon values in the CDW core and an increase at the bottom layer in correspondence with shelf water downflow.
The CDW intrusion onto the shelf is easily observed by both methods, as well as the outflow of dense shelf water down the slope and the presence of a layer rich in Cant on the shelf bottom.
From a quantitative point of view, anthropogenic carbon concentrations estimated using the TrOCA method are slightly higher than those estimated with the MIX model, the average difference being 2 µmol kg-1 with a standard deviation of ±7 µmol kg-1. This average is within the uncertainties associated with both methods, ±4 µmol kg-1 for the TrOCA method and ±7 µmol kg-1 for the Mix one.
The minimum concentration of anthropogenic carbon is found in CDW. For this water mass the MIX method estimates a concentration of 5 ± 1 µmol kg-1, and the TrOCA method 9 ± 3 µmol kg-1. The Cant concentration of this water mass can be estimated to be close to 6 µmol kg-1, which is in good agreement with previous estimates ranging from 5 to 10 µmol kg-1 for this water mass in the Weddell Sea sector (Lo Monaco et al. Reference Lo Monaco, Goyet, Metzl, Poisson and Touratier2005b).
In Fig. 4 the zoom of plot (b) on the B–C section, across the shelf break off Cape Adare, shows a core of low Cant concentration corresponding to the intrusion of CDW onto the shelf. The low concentration of anthropogenic carbon in CDW is not surprizing. In fact it stems from the long residence time of this water mass, segregated at mid-depths for a long time. It is composed of upwelled old deep waters of different origin (Atlantic, Indian and Pacific) in the Southern Ocean (Rintoul et al. Reference Rintoul, Hughes, Olbers, Siedler, Church and Gould2001). Its relative age, provided by CFC ratios measured in the same area, indicates that its ventilation occurred between 1973 and 1979 (Rivaro et al. Reference Rivaro, Bergamasco, Budillon, Frache, Hohmann, Massolo and Spezie2004a), when atmospheric CO2 was already about 50 ppm higher than its preindustrial concentration (280 ppm). CFCs are transient tracers with the characteristic of being entirely anthropogenic, biologically and chemically inert in the ocean. Therefore the oceanic CFC distribution provides valuable information about the rates and pathways of water mass ventilation processes (England & Maier-Reimer Reference England and Maier-Reimer2001). Moreover, since their global temporal evolution is similar to that of CO2, they are particularly interesting for the study of anthropogenic carbon invasion in the oceans, even though some differences exist in their exchange characteristics at the air-sea interface. The CFC distribution along the section (see Fig. 4c) shows a good agreement with the two anthropogenic CO2 estimates. They all increase from the mixed layer to the bottom on the shelf.
With both methods, the highest concentrations below the mixed layer are associated to HSSW, whose Cant content is estimated to be 26 ± 1 µmol kg-1 and 30 ± 4 µmol kg-1, with the MIX and TrOCA method respectively. The highest Cant concentration displayed by HSSW agrees with its maximum content in CFC11, up to 2.5 pmol kg-1 (Rivaro et al. Reference Rivaro, Bergamasco, Budillon, Frache, Hohmann, Massolo and Spezie2004a), and its enrichment in dissolved O2, resulting from its recent ventilation. It is in fact the most recently formed water mass in the investigated area. The CO2 excess reported by Chen (Reference Chen1994) in the HSSW around Cape Adare was 25 ± 10 µmol kg-1. The average is of the same order of magnitude as our result, however, the uncertainties associated with the back calculation method used (Chen Reference Chen1982) are larger than those determined here.
Along the Ross Ice Shelf, on the west part of the section between 100 and 300 km the TrOCA method revealed high concentrations in Cant from 70 m to the shelf bottom (700 m). This can also be observed on the CFC section showing high concentrations within the entire water column in that area. The surface seawater, influenced by the Ross Ice Shelf, is colder and less saline than the water around at the same depth (see Fig. 3). The cooling waters are very efficient in the uptake of anthropogenic CO2. The largest difference between the two methods occurs along the Ross Ice Shelf for the DISW, respectively 0.4 ± 0.3 and 22 ± 4 µmol kg-1 with the MIX and TrOCA method.
Flowing beneath the Ross Ice Shelf, HSSW starts melting the base of the ice shelf, releasing fresh water. The mixing between HSSW and this melting water produces DISW, whose characteristic CFC, O2, TCO2 and TA concentrations are slightly lower than those of the original HSSW, due to fresh water dilution. It's obvious to expect that the same happens for Cant concentration, which should be a little bit lower than that of HSSW. Moreover, CFC concentrations in the water column along the Ross Ice Shelf (Fig. 4) indicates that the water around 300 m is recently formed but is few years older than HSSW, supporting Cant concentration estimated by the TrOCA method.
The discrepancies observed on the calculated Cant of the DISW suggest that the use of salinity and temperature as conservative tracers together with TA and O2 as non-conservative tracers in the multiparametric analysis is not sufficient to accurately differentiate DISW from the other water masses and hence to accurately estimate the mixing coefficients used in the Cant calculation. This means that the signature obtained for DISW with the two couples of conservative and non-conservative tracers used in the MIX method is too close to those of HSSW and AASW. Therefore the DISW is not clearly distinguishable from the other water masses. Consequently the application of the MIX method in this area needs to be improved by adding other conservative tracers, e.g. NO and PO to get a better identification of the water masses.
The absorption of anthropogenic carbon by the young shelf waters at the moment of their formation in the Ross Sea is an important mechanism in CO2 sequestration. In these waters, the absorbed greenhouse gas is allowed to flow out of the shelf and contributes to the formation of Antarctic Bottom Waters (AABW), being in this way sequestered for a long time. The mechanism of formation of AABW involves CDW and the shelf waters: approaching the shelf, CDW mixes with young waters originated in the Ross Sea (HSSW or DISW) to form MCDW and Antarctic Bottom Water (AABW) which contributes to the ventilation of the Southern Ocean (Orsi et al. Reference Orsi, Smethie and Bullister2002).
In the B–C sector of Figs 3 & 4, it is possible to observe that the signal associated to the presence of HSSW at the shelf bottom is still present on the slope as a thin layer characterized by high salinity, low temperature, and high dissolved oxygen. Taking into account the good correlation between hydrographic parameters and dissolved oxygen (r 2 = 0.946) and applying a two component mixing approach, the HSSW relative fraction at the shelf break and along the slope was calculated (Rivaro et al. Reference Rivaro, Frache, Bergamasco and Hohmann2003). The results yielded a HSSW relative fraction at the shelf break of more than 90%, which decreases to about 50% at 1500 m, suggesting that an intense ventilation of the deep ocean was occurring during the 2003 CLIMA cruise (Rivaro et al. Reference Rivaro, Budillon, Massolo, Bergamasco and Spezie2004b).
On the same sector of Fig. 4 the same layer appears also characterized by relatively high concentrations of anthropogenic carbon. This indicates that the shelf waters overflow brings down anthropogenic carbon to the abyssal ocean. CFC measurements during the 2003 CLIMA cruise in the studied area give an approximate age of six years for HSSW found at the bottom of the shelf break, considering the transfer time between the sinking in the formation areas and the outflow at the shelf break. The atmospheric CO2 at the time when this water was in contact with the atmosphere (1997) was about 362 µatm. The anthropogenic carbon content in this water due to the increase of atmospheric CO2 between preindustrial time and 1997 is estimated to 37 µmol kg-1. This means that compared to preindustrial time in 1997 there was an excess of 37 µmol kg-1 of anthropogenic carbon in seawater. According to this estimate, the HSSW (26 ± 1 µmol kg-1 calculated by the TrOCA method) contributes to the uptake of about 70% of the anthropogenic carbon when it leaves the surface layer.
Relationships between the anthropogenic CO2 estimate and CFC-11
In this paper CFC-11 concentration is used to assess independently the relevance of the two anthropogenic CO2 estimates. CFCs are interesting anthropogenic tracers to study the anthropogenic CO2 invasion in the ocean since the temporal evolution of their concentrations in the atmosphere is somewhat similar. It must be kept in mind however that significant differences exist between them. The CFC-11 began to increase in the atmosphere in the 1930s in parallel with the outburst of the industrial activity (England & Maier-Reimer Reference England and Maier-Reimer2001) while anthropogenic CO2 has increased progressively since ∼130 years. Also, the source of emission of CFC differs with those of anthropogenic CO2 and the time of air-sea CFC equilibration is 10 times shorter (Broecker & Peng Reference Broecker and Peng1982).
The correlations between CFC and Cant estimates are analysed for depth ranging from 70 m (the maximum mixed layer depth) to 2000 m. The two estimates of anthropogenic CO2 show a good correlation with CFC-11, r = 0.80 and r = 0.68 for the Mix and the TrOCA approach respectively. For the Mix method the correlation is tested after removing the data corresponding to the DISW since they are not appropriate. These results are also in excellent agreement with the results obtained in the Indian Ocean using the WOCE data (Touratier et al. 2007).
Inventory of anthropogenic CO2
The individual estimates of anthropogenic carbon for each station were vertically integrated to determine column inventories. Since Cant calculations are not reliable in the upper mixed layer, it was assumed that the concentration in the mixed layer was constant and equal to that calculated at the base of this layer. This assumption introduces a potential bias in surface estimates of Cant that should not exceed 10 µmol kg-1. Integrating this error over 70 m (the mixed layer thickness) the error on the inventory results less than 1 mol m-2.
Figure 5 illustrates the column inventories at each station along the A–B–C section using the MIX and the TrOCA methods. Inventories calculated with the TrOCA method (ranging from 5 to 30 mol m-2 with an average of 15 mol m-2) are very similar or slightly higher than those calculated with the MIX method. The maximum difference (13 mol m-2) between the two methods corresponds to the stations located along the Ross Ice Shelf where the core of DISW was detected.
Cant inventory in the Ross Sea along the A–B–C section in mol m-2 estimated with the MIX approach (circles) and with the TrOCA method (triangles).

As discussed earlier, the two methods provide very different concentrations of anthropogenic carbon for this water mass, and a comparison with CFCs supports the TrOCA estimate. Excluding these stations the maximum difference between the two methods is 5 mol m-2. This inventory in the Ross Sea is also in good agreement with results obtained by Lo Monaco et al. (Reference Lo Monaco, Goyet, Metzl, Poisson and Touratier2005b). The deep water formation in the Antarctic polar region contributes actively to the sequestration of the anthropogenic carbon.
Conclusions
In this study we analysed the inorganic carbon system in the Ross Sea during the late summer 2003. We used two independent methods to estimate the anthropogenic CO2 distribution in the Ross Sea, the recent TrOCA approach and the MIX one. The results of these two methods were also compared with the CFC-11 distribution. The two back calculation methods lead to quite similar results for the distribution of anthropogenic carbon in the studied area. From a quantitative point of view the TrOCA method gave slightly higher concentrations than the MIX one, with an average difference of 2 ± 7 µmol kg-1. Nevertheless, these two independent methods provide profiles of similar shape and this is supported by the good correlation with the CFC. Comparing the easiness of the two methods, the TrOCA approch is very easy to use and needs only four parameters (TA, TCO2, θ and O2) to compute quickly and reliably the anthropogenic carbon distribution.
The main features of the Ross Sea circulation were clearly evidenced through the description of the inorganic carbon properties, dissolved oxygen distribution and Cant concentrations. Both methods reveal that in the Ross Sea the entire water column has been invaded by anthropogenic carbon: the maximum concentrations are associated to the recently ventilated HSSW and the minimum to the old CDW.
In the area across the shelf break off Cape Adare, in the north-western part of the Ross Sea, the bottom layer is enriched in anthropogenic carbon, since it contains recently ventilated HSSW. It is very interesting to observe that in this area an active outflow of shelf water is occurring bringing anthropogenic carbon to abyssal depths. Thus, bottom waters are supplied with anthropogenic carbon through mixing processes associated with sinking of dense shelf waters.
Our results differ from the first study carried on in this area concerning the sequestration of anthropogenic CO2 (Chen Reference Chen1994). Chen (Reference Chen1994) concluded, that the CO2 excess in the Cape Adare region does not penetrate deeper than a few hundred metres south of the Polar Front and that the Ross Sea was probably not a significant sink for CO2. Nevertheless, results here presented are in agreement with recent estimates in the Indian Pacific sector of the Antarctic continent (WOCE line SR3) (Sabine et al. Reference Sabine, Feely, Key, Bullister, Millero, Lee, Peng, Tilbrook, Ono and Wong2002) and between South Africa and Antarctica (WOCE line I6) (LoMonaco et al. 2005a). They further confirm that a significant amount of anthropogenic carbon penetrates in and is actually stored into the Southern Ocean. The use of independent methods and independent anthropogenic tracers like CFCs provide efficient tools to compare the available techniques to estimate anthropogenic carbon distribution.
Acknowledgements
This work was carried out as part of the Italian National Program for Antarctic Research (PNRA) CLIMA project, whose support in the field and laboratory activities is gratefully acknowledged.
Special thanks go to the crew of the RV Italica, who helped to overcome every practical problem. Figures 1–4 were produced utilizing the freeware software Ocean Data View produced by R. Schlitzer from AWI, Bremerhaven (http://www.awi-bremerhaven.de/GEO/ODV), to whom we are grateful. We thank the referees for their constructive and helpful comments.



