I. INTRODUCTION
Since Fujishima and Honda reported the first photoelectrochemical cell in 1972 using TiO2 as a photoanode, great efforts have been exerted on a semiconductor cell for water splitting and photocatalysis in dye degradation. Reference Fujishima and Honda1 TiO2 also boasts for its merit of nontoxicity, abundance, superior photocatalytic activity, and long-term chemical stability. Reference Hoffmann, Martin, Choi and Bahnemann2 But its characteristic of a large band gap and quick recombination of photo-generated electron–hole pairs impede its practical applications. Reference Kumar and Devi3 Therefore, pure TiO2 is not a good candidate; band gap engineering is needed if we want to use TiO2 as a higher efficiency catalyst under visible light illumination. Reference Li, Yu and Jaroniec4–Reference Samsudin, Hamid, Juan, Basirun and Kandjani6
To date, many approaches have been tried to improve the visible light absorption and prolong the electron–hole pairs’ separation lifetime. Reference Kumar and Devi3,Reference Ong, Tan, Chai, Yong and Mohamed7,Reference Seo, Noh and Seok8 Doping with heteroelements is one of the effective methods to tackle these challenges. Cations such as Rh3+, Mo4+, Os3+, Re5+, V4+, Mn3+, and Fe3+ were used as dopants to introduce mid-gap electronic states into the TiO2 forbidden band gap. Reference Inturi, Boningari, Suidan and Smirniotis9–Reference Li, Xia, Xu, Murowchick and Chen12 Non-metallic doping such as B/TiO2 Reference Giannakas, Antonopoulou, Daikopoulos, Deligiannakis and Konstantinou13,Reference Jaiswal, Patel, Dashora, Fernandes, Yadav, Edla, Varma, Kothari, Ahuja and Miotello14 , C/TiO2 Reference Giannakas, Antonopoulou, Daikopoulos, Deligiannakis and Konstantinou13,Reference Park, Kim and Bard15–Reference Ivanov, Barylyak, Besaha, Bund, Bobitski, Wojnarowska-Nowak, Yaremchuk and Kus-Liskiewicz17 , N/TiO2 Reference Giannakas, Antonopoulou, Daikopoulos, Deligiannakis and Konstantinou13,Reference Zhang, Fujitsuka and Majima18,Reference Zhang, Creatore, Ma, El Boukili, Gao, Verheijen, Verhoeven and Hensen19 , S/TiO2 Reference Ivanov, Barylyak, Besaha, Bund, Bobitski, Wojnarowska-Nowak, Yaremchuk and Kus-Liskiewicz17,Reference Qu, Zheng, Du, Zhou, Zhang, Li, Tan, Zhao, Xie and Sun20 , F/TiO2 Reference Zhang, Fujitsuka and Majima18,Reference Yu, Yu, Ho, Jiang and Zhang21–Reference Samsudin, Abd Hamid, Juan, Basirun and Centi23 were also tried. However, the introduction of heteroelements often enhanced the possibility of charge recombination and thermal instability. Recently, appealing approaches based on dopant-free, Ti3+ species self-doping in TiO2 have emerged as an effective approach to overcome this limitation. Reference Chen, Liu, Yu and Mao24–Reference Wang, Yang and Huang32
Several methods have been introduced to produce Ti3+ self-doped TiO2−x . Reference Chen, Liu, Yu and Mao24–Reference Chen, Li, Wang, Gan, Liu and Ju27,Reference Liu, Xu, Grabstanowicz, Gao, Lou, Wang, Huang, Dai and Xu33 The thermal reducing (CO or H2) treatment of TiO2 is a usual method to create Ti3+ on its surface to improve the surface and photoelectrochemical properties. Reference Chen, Liu, Yu and Mao24–Reference Chen, Li, Wang, Gan, Liu and Ju27 Physical methods of high energy particle bombardment (such as laser, Reference Ali, Ruzybayev, Yassitepe, Karim, Shah and Bhatti34,Reference Chen, Zhao, Liu, Wang, Liu, Li, Zhang and Shen35 electron, Reference Wang, Baer and Engelhard36 or Ar+Reference Zhou, Liu and Schmuki37 ) are alternatives to produce Ti3+ species in TiO2. However these methods were all limited by high cost and difficult in large scale production, in addition, Ti3+ created using these methods mainly scattered on the surface region and is not thermally stable enough in air or air saturated water solution. Reference Liu, Xu, Grabstanowicz, Gao, Lou, Wang, Huang, Dai and Xu33 Additionally, theoretical calculation demonstrated that only under high Ti3+ doping concentration can it form a continuous vacancy mid-gap band of electronic states Reference Chen, Liu, Yu and Mao24 and a low Ti3+ doping concentration on the contrary creates localized oxygen vacancy states that actually play as e–h pair combination sites and deteriorate the visible photoactivity. Reference Di Valentin, Pacchioni and Selloni38,Reference Justicia, Ordejon, Canto, Mozos, Fraxedas, Battiston, Gerbasi and Figueras39 Therefore methodology of high-concentration Ti3+ doping with low cost and volume production strategy should be developed to obtain bulk Ti3+ self-doped TiO2−x .
Recently, one oxidation-based method using TiH2 and H2O2 as starting materials has been reported to produce Ti3+ self-doped TiO2−x . It exhibits higher photocatalytic activity for photooxidation of methylene blue (MB). Reference Liu, Xu, Grabstanowicz, Gao, Lou, Wang, Huang, Dai and Xu33
In contrast to the above briefed method, we demonstrate herein a one-pot solvothermal method to produce Ti3+ self-doped TiO2−x mesocrystals with various tailored morphology. Mesocrystals are the assemblies of crystallographically oriented nanocrystals that were regarded as a new class of ordered nanoparticles. Reference Colfen and Antonietti40 We use TiCl3 and tetrabutyltitanate (TBT) as the starting materials, under solvothermal conditions, TiCl3, and tetrabutyltitanate hydrolysis individually in the acetic acid environment and then calcine at 400 °C to produce homogeneously distributed Ti3+ self-doped TiO2−x mesocrystals. This is a simple and cost-efficient process.
II. EXPERIMENTAL SECTION
A. Synthesis of Ti3+ self-doped TiO2−x
Ti3+ self-doped TiO2−x nanoparticles were prepared by a solvothermal method using TiCl3 and tetrabutyltitanate (TBT) as a precursor. Mix TBT and TiCl3 in a volume ratio of 5:0, 4:1, 3:2, 1:4, and 0:5 individually. In a typical preparation procedure, 1 mL of the above mixture was added into 50 mL acetic acid under vigorous stirring. The suspension was continuously stirred for 30 min at room temperature. After that, the resulting mixtures were transferred to a 100 mL dried, Teflon-lined autoclave and then kept at 200 °C for 24 h. After being cooled to room temperature, the precipitates were collected, washed thoroughly with deionized water and absolute ethanol several times, and then dried in an oven at 60 °C for 12 h. Titanate was then annealed in air at 400 °C for 2 h to obtain Ti3+ self-doped TiO2−x . Accordingly to the different volume ratio of TBT to TiCl3, the final products could be denoted as TiO2−x (5-0), TiO2−x (4-1), TiO2−x (3-2), TiO2−x (1-4), and TiO2−x (0-5), respectively.
B. Characterization
The crystalline structures of the prepared samples were measured by X-ray diffraction (DX-2700) (Dandong Hanyuan Instrument, Co., Ltd., Dandong, China). The morphologies of series TiO2−x were examined by a field-emission scanning electron microscope (FE-SEM; Hitachi S4800, Hitachi Corp., Tokyo, Japan) and a transmission electron microscope (TEM; JEM 2100, JEOL Ltd., Tokyo, Japan). X-Ray photoelectron spectroscopy (XPS) measurements were examined on a Kratos AXIS Ultra delay-line detector (DLD; Shimadzu Corp., Tokyo, Japan) (Al Kα monochromatic source). Adventitious C 1s peak (284.6 eV) was used as binding energies’ reference. The 488 nm laser excited Raman spectra were measured on a quartz sheet equipped with a triple monochromator (TriVista TR557, Princeton Instruments, Trenton, New Jersey) and an argon ion laser (approximately 30 mW on the sample). The charge coupled device (CCD) chip active area covers a wave number of 1089 cm−1 and the spectral resolution boasts for 2.5 cm−1. Electron paramagnetic resonance spectroscopy (EPR) was carried out under a xenon lamp. 5 mL 0.5 g/L TiO2 was mixed with 50 μL 20 mmol/L 5,5-dimethyl-1-pyrroline N-oxide (DMPO) for handshaking 5 s. The EPR measurements were started using a Bruker A300 spectrometer (Bruker Corporation, Rheinstetten, Germany). All measurements were performed at a microwave frequency of 9851 MHz and a microwave power of 20 mW. Measurements were done at a center field of 350.8 mT and a sweep field of 10 mT. The field modulation frequency was set to 100 kHz.
C. Photocatalysis experiments
The photocatalytic activities of samples were evaluated by the degradation rate of MB in aqueous under visible light irradiation. The experimental set up placed in a black box consisted of a 200 mL beaker irradiated by a 300 W, 220 V xenon lamp with a 400 nm cutoff filter (CEL-HXUV300, Beijing CEAULIGHT, Beijing, China). The distance between the lamp and the solution is 10 cm. The temperature inside the reactor was maintained at approximately 25 °C by means of a continuous circulation of water surrounding the reactor. In each experiment, 100 mL MB aqueous solution (10 mg/L) was mixed with 50.0 mg photocatalyst powder in the above 200 mL quartz reactor. Before irradiation, the suspension was stirred in the black box for about 30 min till it reached the adsorption–desorption equilibrium. After the photoreaction runs, samples of 4 mL were withdrawn from the suspension at regular time intervals during the irradiation and then centrifuged to separate the photocatalysts. The quantitative determination of remnant MB was conducted by measuring its maximum absorption at 665 nm with a UV-vis spectrometer (Varian Cary 50, Varian Inc., Palo Alto, California).
III. RESULTS AND DISCUSSION
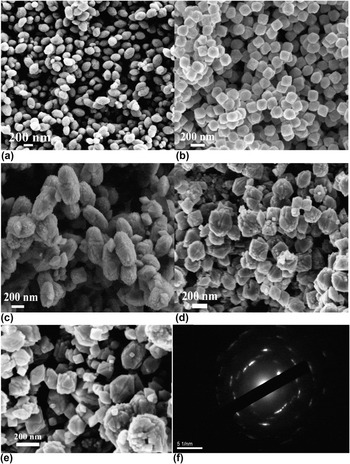
Fig. 1 shows the FE-SEM images of the synthesized Ti3+ self-doped TiO2−x . Figure 1(a) illustrates TiO2−x (5-0) with no Ti3+ doped that a large quantity of particles have formed with a uniform spindle shape and unique size. The lengths and diameters are mostly found to be 350–450 nm and 100–200 nm, respectively. These particles were recognized as anatase TiO2 mesocrystals and have been reported firstly with high visible light photocatalytic activity and extraordinary photocatalytic stability recently. Reference Han, Wang and Zheng41 Based on the same strategy, we synthesized the other Ti3+ self-doped TiO2−x . TiO2−x (4-1) image is shown in Fig. 1(b), from which we can see that a great deal of uniform tetragonal bipyramids with identical sizes were formed. With the decrease in the ratio of TBT to TiCl3 to 3:2, the catalysis shape of TiO2−x (3-2) changes to capsule-like morphology with a rough surface as is shown in Fig. 1(c). The mean lengths and mean diameters are statistically 540 nm and 325 nm, respectively. There are also some uniform tetragonal bipyramids scarcely scattered among the capsules. With the ratio reaching 1:4, the capsule turns into a round and an irregular size as shown in Fig. 1(d). Extremely when there is no TBT added, the morphology of TiO2−x (0-5) shown in Fig. 1(e) demonstrated that the catalysis is consisted of irregular shapes. The selective area electron diffraction (SAED) of TiO2−x (3-2) [Fig. 1(f)] shows well resolved diffraction spots indicative of a highly crystalline “single-crystal-like” anatase framework. It suggests that the whole assembly of the particle subunits is highly oriented, leading to the formation of the capsule-like particle elongated along the [001] direction. It is clear to see that the diffraction spots are slightly elongated, indicating that a mesocrystal structure was formed. Reference Chen, Cao, Li and Bian42,Reference Hong, Wei, Lan, Jiang and Cao43 The high oriented subunits caused the small lattice mismatch between the boundaries of the capsule-like particle when they are assembled in the same orientation.
FE-SEM images of the Ti3+ self-doped TiO2−x fabricated with different volume ratios of TBT to TiCl3. (a) TiO2−x (5–0); (b) TiO2−x (4–1); (c) TiO2−x (3–2); (d) TiO2−x (1–4); (e) TiO2−x (0-5); (f) selective area electron diffraction (SAED) of TiO2−x (3–2).

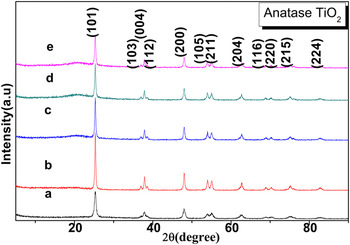
XRD measurements were carried out to investigate the crystal identity of TiO2 and the effect of doped Ti3+ on the crystal structure of TiO2−x . Figure 2 shows the XRD pattern of TiO2−x . The diffraction peaks at 2θ = 25.3, 37.0, 37.8, 38.6, 48.0, 53.1, 55.4, 62.7, 68.8, 70.2, 75.2, and 82.6 correspond to the (101), (103), (004), (112), (200), (105), (211), (204), (116), (220), (215), and (224) planes of anatase TiO2. All diffraction peaks of the calcined materials in Fig. 3 can be indexed as anatase TiO2 with standard values in agreement with that of JCPDS card No. 21-1272. The full width at half maximum (FWHM) of the (101) peak at 2θ = 25.3 has been measured individually for each sample. The FWHM of (a) to (e) is 0.519, 0.261, 0.267, 0.269, and 0.319 individually. Based on the Scherrer formula, the crystallite sizes of the corresponding TiO2−x could be easily calculated and listed accordingly, 15.5 nm, 30.8 nm, 30.2 nm, 29.9 nm, and 25.2 nm, respectively, from (a) to (e). It is easy to conclude that the crystallite sizes of the corresponding TiO2−x decreases with the decrease of the TBT volume ratio except for sample (a). The large size of spindle-like TiO2 mesocrystals shown in Fig. 1(a) is composed of many tiny crystallites (12 nm diameter), Reference Han, Wang and Zheng41 which is in good coincidence with the XRD determination. Considering the size from SEM shown in Fig. 1 and XRD shown in Fig. 2, we may conclude that all the samples are consisted of tiny crystallites and could be defined as mesocrystals. Judging from the XRD intensity and signal-noise ratio, (b) owns the most excellent crystallinity.
XRD patterns of Ti3+ self-doped TiO2−x fabricated with different volume ratios of TBT to TiCl3. (a) TiO2−x (5-0); (b) TiO2−x (4-1); (c) TiO2−x (3-2); (d) TiO2−x (1-4); (e) TiO2−x (0-5).

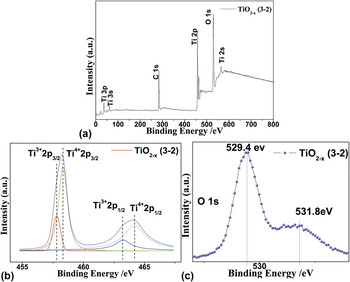
(a) Wide-scan XPS survey spectra for the TiO2−x (3-2) mesocrystal. (b) Ti 2p high-resolution XPS spectra from the TiO2−x (3-2) mesocrystal and (c) O 1s high-resolution XPS spectra for the TiO2−x (3-2) mesocrystal.

To determine the presence of Ti3+, the XPS measurement was conducted as shown in Fig. 3. The measurement was performed over the as-prepared samples of the TiO2−x (3-2) mesocrystal for confirming the surface composition. The Ti 2p XPS spectrum is shown in Fig. 3(a), which was composed by two peaks: the Ti 2p 3/2 located at 458.1 eV and the 2p 1/2 located at 463.9 eV. Compared with the literature data of TiO2, the Ti 2p 3/2 position of TiO2−x (3-2) shifts obviously from 458.7 eV to lower 458.1 eV, indicating multiple oxidation states of the Ti elements. This can be contributed to the different binding energies of Ti3+–O and Ti4+–O. According to the literature, Reference Liu, Xu, Grabstanowicz, Gao, Lou, Wang, Huang, Dai and Xu33,Reference Yang, Yang, Shiu, Chang and Wong44 the Ti3+ species has a lower 2p 3/2 binding energy than Ti4+, and as result, the increasing of the Ti3+ contents lead to that the peak of Ti 2p 3/2 shifts to the lower binding energy. Deconvolution of Ti 2p XPS data reveals that TiO2−x (3-2) has signals of both Ti3+ and Ti4+, appearing at 457.8, 458.3, 463.2, and 464.2 eV, corresponding to Ti3+ 2p 3/2, Ti4+ 2p 3/2, Ti3+ 2p 1/2, and Ti4+ 2p 1/2, respectively. Reference Liu, Xu, Grabstanowicz, Gao, Lou, Wang, Huang, Dai and Xu33,Reference Yang, Yang, Shiu, Chang and Wong44 It should be stressed that the presence of Ti3+ is essentially a defective site that captures the hole to prolong the electron hole separation lifetime and suppresses the recombination of electron–hole pairs.
As oxygen vacancies are usually produced with the generation of Ti3+ during the preparation process, O 1s XPS spectra were also investigated and shown in Fig. 3. The regions of O 1s XPS spectra are composed of a main peak with a binding energy of 529.4 eV and a minor peak with a binding energy of 531.8 eV. The peaks of 529.4 and 531.8 eV can be attributed to Ti–O in TiO2 and hydroxyl groups chemisorbed on the surface of the samples, respectively. Normally the O 1s peak of TiO2 is located at 530.0 eV, Reference Carley, Chalker, Riviere and Roberts45 but this of TiO2−x (3-2) red shifts to 529.4 eV; this red-shift has also been reported by Gyorgy et al., and they attribute this phenomenon to the oxygen deficiency in TiO2. Reference György, Pérez del Pino, Serra and Morenza46 The chemisorbed –OH at the binding energy of 531.8 eV is equivalent to surface defects (oxygen vacancies). These defects can act as hole traps to promote electron hole separation, suppress the recombination of electron–hole pairs, and consequently enhance the catalytic activity. Reference Liu, Xu, Grabstanowicz, Gao, Lou, Wang, Huang, Dai and Xu33,Reference Yang, Yang, Shiu, Chang and Wong44 Meanwhile, the abundant adsorbed –OH on the surface can potentially trap holes to form key oxidative ·OH for advanced oxidation of organic dyes. Reference Liu, Xu, Grabstanowicz, Gao, Lou, Wang, Huang, Dai and Xu33,Reference Yang, Yang, Shiu, Chang and Wong44
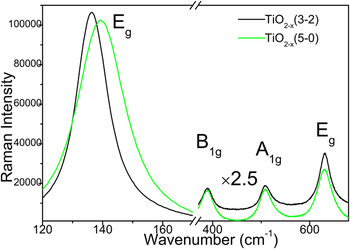
Raman spectroscopy is a sensitive tool for investigating the changes on the electrons and molecular structure information. To further identify the doped structure and crystallinity of the samples, Raman studies were performed in the range of 120–700 cm−1 which is shown in Fig. 4. The Raman peaks at 139.4, 389.0, 508.6, 630.0 cm−1 could be assigned to the Raman-active modes of anatase with symmetries Eg (O–Ti–O symmetric stretching), B1g (O–Ti–O wag), A1g, and Eg (O–Ti–O asymmetric stretching), respectively. Reference Han, Wang and Zheng41 No characteristic rutile or brookite phase Raman peaks were found, indicating the composition of pure anatase phase TiO2 mesocrystals. Interesting observations were that the Eg peak at 139.4 cm−1 gradually shifted to a lower wave number at 136.5 cm−1 as Ti3+ doped, and the Eg peak at 630.0 cm−1 shifted to the opposite direction at 631.1 cm−1. This indicates that there was an interaction between Ti3+ and Ti4+, and the created oxygen vacancies in the lattice structure of the TiO2−x mesocrystal increase with the enhancement of the Ti3+ content. Oxygen deficiency can transfer its extra two electrons to the adjacent two Ti4+ atoms to form Ti3+, and the presence of the oxygen vacancies lead to the change of atomic coordination numbers and bonding length of the Ti–O–Ti network in the Ti3+ self-doped TiO2−x mesocrystal. Therefore, it is not strange to see that the O–Ti–O stretching frequency shifted with increase in the Ti3+/TBT molar ratio. The oxygen vacancies can act as traps to capture photoelectrons, which make a contribution to inhibit the charge recombination. Thus, the XRD and Raman characterization of the TiO2−x mesocrystal demonstrate the high crystallinity of titania materials and the presence of the anatase phase.
Raman spectra of the TiO2−x (3-2) mesocrystal and TiO2−x (5-0) mesocrystal.

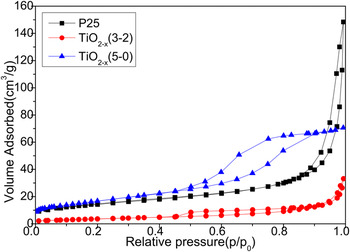
The nitrogen adsorption–desorption isotherms were carried out to characterize the specific surface area (S BET) and pore structure of the photocatalysts. According to the isotherms shown in Fig. 5, the isotherms for the P25 and TiO2−x (3-2) mesocrystal could be identified as type IV (IUPAC classification), which was a characteristic of mesoporous materials, while the isotherms for the TiO2−x (5-0) mesocrystal could be identified as type I, which was a characteristic of porous materials exhibiting a narrow distribution of relatively uniform (cylindrical-like) pores. In addition, the hysteresis loop resemble H3 in the IUPAC classification, indicating that the P25 and TiO2−x (3-2) mesocrystal comprised aggregates of nanorods (loose assemblages) exhibiting a narrow distribution of relatively uniform slit-like pores. The Brunauer–Emmett–Teller (BET) specific surface area is 73.7 m2/g, 52.6 m2/g, and 13.6 m2/g, respectively, for TiO2−x (5-0), P25, and TiO2−x (3-2).
N2 adsorption–desorption isotherms of the P25, TiO2−x (3-2) mesocrystal, and TiO2−x (5-0) mesocrystal.

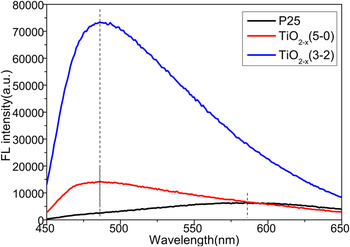
The fluorescence spectrum of Ti3+ self-doped nanoparticles presents a blue shift relatively to the spectra of P25 (Fig. 6). And the fluorescence intensity is enhanced after Ti3+ is doped to TiO2 composites. The emission wave length were 485 nm, 485 nm, 586 nm for the TiO2−x (3-2) mesocrystal, TiO2−x (5-0) mesocrystal, and P25, respectively. Obviously, the Ti3+ self-doping process greatly changed the crystal structure and the semiconductor energy band structure of TiO2 nanoparticles.
Fluorescence spectra of the P25, TiO2−x (3-2) mesocrystal, and TiO2−x (5-0) mesocrystal.

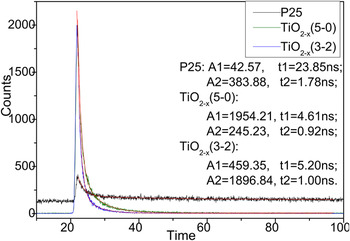
Figure 7 shows the fluorescence decay profile of the P25, TiO2−x (3-2) mesocrystal, and TiO2−x (5-0) mesocrystal. Their decay lifetime can be obtained by using exponential function fitting. We observed that the relaxation lifetime of photo-generated electrons in the P25 is about 23.85 ns, while that in the TiO2−x (3-2) mesocrystal and TiO2−x (5-0) mesocrystal is 5.20 and 4.61 ns, respectively, one in five of P25.
Fluorescence decay profile of the P25, TiO2−x (3-2) mesocrystal, and TiO2−x (5-0) mesocrystal dispersed in MeCN and their exponential function fitting data are shown in the figure.

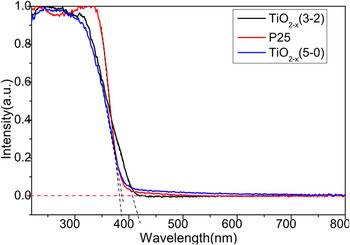
Light response properties were studied by UV–vis spectroscopy and the effect of Ti3+ doping content on UV–vis absorption property is revealed in Fig. 8. It shows that the absorption of blank P25 and TiO2−x (5-0) mesocrystal is only located at the ultraviolet (UV) region below 390 nm, whereas the absorption edge of TiO2−x (3-2) composites shows redshift to near 420 nm. The presence of Ti3+ narrowed the band gap. The pronounced low-energy absorption band at 420 nm is in good agreement with the reported values of Ti3+ self-doped nanoparticles.
UV–vis absorption spectra of the TiO2−x (3-2) mesocrystal and TiO2−x (5-0) mesocrystal composites, UV–vis absorption spectra of P25 also included for comparison.

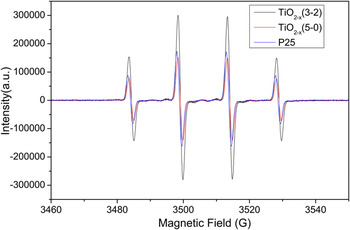
An EPR spin trapping study was conducted to verify the presence of radicals and identify radical species which may be responsible for the degradation of MB. The EPR spectra of the Ti3+–TiO2−x sample, MesoTiO2 sample, and P25 sample dispersed in water under UV irradiation are shown in Fig. 9 and the ESR spectra of the sample dispersed in methanol are shown in Fig. 10. The spectra (Fig. 9) showed a four-line EPR characteristic signal, with Hamiltonian parameters characterized by the hyperfine splitting for the 1:2:2:1 signal a N = a H = 1.48 mT, which are typical for the ·DMPO-OH adduct. Reference Fontmorin, Castillo, Tang and Sillanpaa47 Furthermore, the ESR spectra intensity of TiO2−x (3-2) was a little stronger than other two.
EPR spectra measured upon continuous irradiation of aqueous suspensions in the presence of DMPO (2 mmol/L) at TiO2−x (3-2) mesocrystal, TiO2−x (5-0) mesocrystal, and P25.

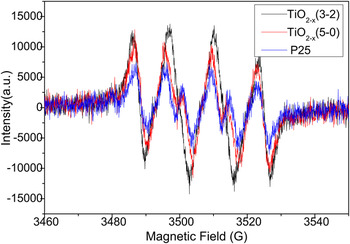
EPR spectra measured upon continuous irradiation of oxygen-saturated methanol suspensions in the presence of DMPO (2 mmol/L) at TiO2−x (3-2) mesocrystal, TiO2−x (5-0) mesocrystal, and P25.

The EPR spectra, monitored upon continuous irradiation of TiO2 suspensions dispersed in methanol (Fig. 10), demonstrate the formation of ·DMPO-OH simultaneously with a further six-line paramagnetic signal characterized by the hyperfine splitting a N = 0.790 mT, a H β = 1.12 mT and a H γ (2H) = 0.480 mT, which are typical for the DMPO oxidation product 5,5-dimethyl-1-pyrrolidone-2-oxyl (·DMPO-X, i.e., O2 −·/·OOH Reference Li, Cummings, Rothling, Buettner and Chignell48 ).
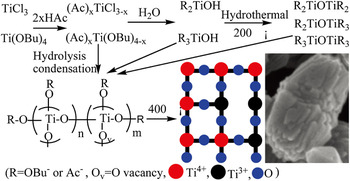
Based on the above results, a tentative mechanism is proposed, as illustrated in Scheme 1, to interpret the formation of the Ti3+ self-doped TiO2−x mesocrystal.
Schematic illustration of a tentative mechanism for the formation of the Ti3+ self-doped TiO2−x mesocrystal.

TiCl3 and Ti(OBu)4 are the most reactive species and easy to be hydrolyzed or coordinated with HAc. In the current solvothermal conditions at 200 °C, the coordination complexes (Ac) x Ti(OBu)4−x , (Ac) x TiCl3−x and hydrolysate R2TiOH, R3OH are unstable and easy to poly-condense. Subsequently, Ti–O–Ti bonds would form by co-polycondensation processes, leading to the formation of the Ti4+ and Ti3+ block copolymers. With the condensation processes continuing, the large copolymers crystallized and heated to break down gradually to release soluble nucleation species for the growth of anatase nanocrystals in the solution.
The anatase nanocrystals grew along one prevailing direction, together with minor attachment along some side facets, resulting in the formation of the anisotropic developed anatase mesocrystals elongated along the prevailing direction. With the increase of the Ti3+ content, the side facets’ attachment becomes equal with the main facet nanocrystals’ growth, resulting in round sphere morphology. It is well known that fast hydrolysis and condensation rate lead to the precipitation of amorphous TiO2; in our experiment acetic acids were used both as a stabilizing solvent and as a chemical modifier of titanium alkoxides to lower the reactivity of the precursors. Finally, 400 °C calcination subsequently removed the organic residuals and increased the nanocrystal size of anatase Ti3+ self-doped TiO2−x mesocrystals.
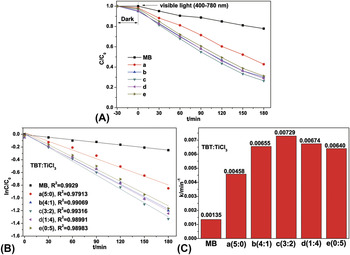
The photocatalytic degradation of MB in the aqueous phase was selected as the probe reaction to evaluate the photocatalytic activity of the Ti3+ self-doped TiO2−x mesocrystal. For comparison, the photocatalytic activity of every sample was tested under identical conditions. The change of MB concentration as a function of illumination time was shown in Figs. 11(A) and 11(B). Five different ratio samples (a, b, c, d, and e) showed 57%, 70%, 74%, 72, and 69% decolorization rates (1 − C/C 0), respectively, under xenon lamp illumination after 180 min. It can be seen that the TiO2−x (5-0) mesocrystal displays the lowest photocatalytic degradation rate under visible light irradiation due to its wide band gap, whereas, the TiO2−x mesocrystal with different Ti3+ doped contents demonstrated higher photodegradation efficiency. Through careful observation, the catalytic efficiency increased with Ti3+ doped, reached 74% utmost over the TiO2−x (3-2) mesocrystal, and then decreased with the further increase ratio of Ti3+ doping in the TiO2−x nanocomposite; the photocatalytic activity of the TiO2−x (3-2) mesocrystal shows the highest photocatalytic activity for the degradation of MB. On the basis of a simplified Langmuir–Hinshelwood model, the linear relationship of ln(C/C 0) versus time [see Fig. 11(B)] upon visible light irradiation indicates that MB degradation follows a pseudo first order kinetic, and the apparent rate constant (k) shown in Fig. 11(C) was calculated from the plot of ln(C/C 0) versus time. The highest apparent rate constant, obtained for the TiO2−x (3-2) mesocrystal, is 7.29 × 10⁻³ min−1, which shows 1.59, 1.11, 1.08, and 1.14-fold photocatalytic activity improvement over the TiO2−x (5-0), TiO2−x (4-1), TiO2−x (1-4), and TiO2−x (0–5) mesocrystals, respectively. The high efficiency performance could be ascribed to its unique doping structure and low band gap energy.
(A) Photodegradation of MB upon visible light irradiation over the TiO2−x mesocrystal fabricated with different volume ratios of TBT to TiCl3. (a) TiO2−x (5-0); (b) TiO2−x (4-1); (c) TiO2−x (3-2); (d) TiO2−x (1-4); (e) TiO2−x (0-5). (B) Kinetic linear fitting curves for the photocatalytic degradation of MB over the TiO2−x mesocrystal with different volume ratios under visible light irradiation. (C) Value of the rate constant k of the photodegradation of MB over the TiO2−x mesocrystal with different volume ratios.

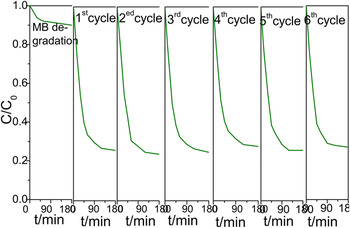
Durability test was performed to confirm the photocatalytic stability of the synthesized TiO2−x (3-2) mesocrystal, which was very important for the practical application. According to Fig. 12, the 10 mg/L MB was 75% degradated in 180 min for all the recycles for dye sensitized TiO2, keeping stable the catalysis performance with the original first run of TiO2−x (3-2) nanoparticles as shown in Fig. 11. The MB photodegradation efficiency changed a little after 6 recycles of the experiment under identical conditions, indicating that the photocatalyst has superior photocatalytic stability.
Stability study over TiO2−x (3-2) for MB photodegradation under visible light irradiation.

The incorporation of Ti3+ in the TiO2−x mesocrystal ameliorates the hydrophilic compatibility, which is significant for photocatalysis and super hydrophilic effects. However, theoretical work showed that for achieving high efficiency visible light activity, the Ti3+ doping concentration must be kept high enough to create large amounts of lattice disorder that could induce a continuous vacancy band of mid-gap electronic states which is largely (0.75–1.18 eV) below the conduction band (CB) edge of TiO2. Otherwise, a low Ti3+ doping concentration only produces localized single oxygen defect that actually deteriorates the electron mobility and exhibits a negligible visible photoactivity, or even worse to act as electron–hole pair recombination sites. The electronic transitions from mid-gap electronic states to CB, and from valent band (VB) to mid-gap electronic states, are responsible for the TiO2−x mesocrystal visible light activity. Furthermore the mid-gap states may trap the photo-generated electrons, prolong its lifetime, and enhance its transfer possibility to react with O2 adsorbed on the surface of TiO2. Therefore, the presence of appropriate amount of Ti3+ states in TiO2 results in the reduction of the electron–hole pair recombination rate and enhances visible light photocatalytic activity. Reference Yu, Yu, Ho, Jiang and Zhang21 However when the dopant concentration becomes too high (TiCl3 to TBT molar ratio of higher than 2:3), the recombination rate will increase because the distance between trapping sites in a particle decreases with the number of dopants. Reference Yu, Yu, Ho, Jiang and Zhang21 This discussion and theoretical explanation is account for our experimental visible light excited photocatalytic activity.
IV. CONCLUSION
In summary, a unique one-pot solvothermal method is used to prepare different Ti3+ content doped TiO2−x mesocrystals. Morphology varies from uniform spindle shape and tetragonal bipyramid to capsule-like shapes which can be tailored easily by tuning the precursor ratio of TiCl3 to TBT. SEM and XRD demonstrate that the catalysts produced in this method consist of tiny crystallites and could be classified as mesocrystals. The resulting Ti3+ self-doped TiO2−x mesocrystals show enhanced visible light-driven photocatalytic oxidation on MB, which is attributed to the presence of oxygen vacancies and Ti3+ species. TiO2−x (3-2) mesocrystals show the highest photocatalytic activity. This study demonstrates a simple and cost-efficient approach to narrow the band gap of TiO2 and develops a new effective method to prepare Ti3+ self-doped TiO2−x mesocrystals with high photocatalysis performance under visible light irradiation.
ACKNOWLEDGMENTS
This work was supported by grants from the National Natural Science Foundation of China (No. 21271155 and 21473161), Zhejiang Provincial Natural Science Foundation of China (LZ17B030001), Zhejiang Provincial Top Key Academic Discipline of Chemical Engineering and Technology, Alexander von Humboldt Foundation (No. 1141172), and Zhejiang SCI-TECH University for 521 distinguished scholar’s scheme.