Implications
This study found that supplementing lactating dairy cows grazing a high-quality pasture diet with black wattle tannin extract at about 0.6% of dietary dry matter (DM) was not detrimental to milk yield but higher dose rates (up to 2.9% dietary DM) decreased production. Higher concentrations of faecal nitrogen (N) were recorded at low levels of condensed tannins (CT) supplementation, suggesting a partitioning away from urinary N. Provision of CT in pellet form at about 1.2% of DM decreased palatability. The high astringency of CT from black wattle, suggests it could be used to mitigate environmental impacts of excess nitrogen from lactating dairy cows grazing pasture.
Introduction
Intensification has enabled the New Zealand dairy industry to increase production but this has come at increased environmental cost (Pinares-Patino et al., Reference Pinares-Patino, Waghorn, Hegarty and Hoskin2009). Ryegrass–white clover (Lolium perenne–Trifolium repens) pasture remains the cheapest feed source in New Zealand but reliance on high levels of nitrogen (N) fertiliser to increase the quantity of pasture grown is being discouraged. Furthermore, a lactating dairy cow grazing temperate pastures has a requirement for feed with an N concentration of about 3.0% of dry matter (DM), which is lower than the range in N concentration of 3.4% to 3.9% commonly found in New Zealand dairy pastures (Ledgard et al., Reference Ledgard, Sprosen, Penno and Rajendram2001). This in turn leads to between 75% and 90% of N ingested by the cow being excreted, with the proportion partitioned to urine increasing linearly with N intake (Pacheco and Waghorn, Reference Pacheco and Waghorn2008). Urinary N is predominately urea, which is rapidly (<24 h) hydrolysed to ammonia (Powell et al., Reference Powell, Wattiaux and Broderick2011) or nitrified to nitrate and leached or lost as nitrous oxide (N2O) emissions, and N contamination threatens ground and surface water quality (Monaghan et al., Reference Monaghan, Hedley, Di, McDowell, Cameron and Ledgard2007). In contrast, the organically bound N in faeces is relatively stable (Rotz, Reference Rotz2004). It breaks down more slowly than urinary N, so it is less readily available for denitrification. The high urinary N loss has raised concerns on the impact of dairying on the environment and the New Zealand dairy industry has targeted a 30% reduction in water, nutrient and greenhouse gas footprint by 2016 (Dairy Industry Strategy, 2010).
Condensed tannins (CT) are naturally occurring phenolic compounds and their effects on dietary protein utilisation have been extensively studied and reviewed (Min et al., Reference Min, Barry, Attwood and McNabb2003; Waghorn, Reference Waghorn2008). The CT form complexes with protein, upon cell rupture during chewing (Mangan et al., Reference Mangan, Vetter, Jordan and Wright1976), which slows the rate and extent of rumen protein degradation, reducing rumen ammonia concentrations (Wang et al., Reference Wang, Waghorn, Barry and Shelton1994) and the net absorption of ammonia from the rumen, which can reduce the excretion of urinary N. Feeding forages with 2% to 4% CT in the DM can increase live weight gain and milk production (Min et al., Reference Min, McNabb, Barry, Kemp, Waghorn and McDonald1999; Woodward et al., Reference Woodward, Waghorn and Laboyrie2004), but effects are dependent on both the diet and the astringency of the CT, and may impact on DM intake (DMI; Mueller-Harvey, Reference Mueller-Harvey2006; Waghorn, Reference Waghorn2008). Despite the research showing potential benefits of CT for nutrition, weak agronomic performance of tanniniferous temperate forages (e.g. Lotus spp., sainfoin (Onobrychus viciifolia Scop.), sulla (Hedysarium coronarium)) relative to grasses, has limited their use in intensive pastoral grazing systems. However, legislation affecting nutrient discharge has renewed interest in forages with CT, and extracts containing CT from trees and shrubs, for example, black wattle (Acacia mearnsii) and quebracho (Schinopsis spp.) (Carulla et al., Reference Carulla, Kreuzer, Machmuller and Hess2005; Grainger et al., Reference Grainger, Clarke, Auldist, Beauchemin, McGinn, Waghorn and Eckard2009) as dietary additives to mitigate greenhouse gas emissions and nutrient loss.
Black wattle extract is commercially available and the CT has previously been shown to have a significant negative impact on digestion and milk production of dairy cows fed a pasture/cracked triticale (x Triticosecale) grain ration (Grainger et al., Reference Grainger, Clarke, Auldist, Beauchemin, McGinn, Waghorn and Eckard2009). However, the most detrimental response in the study by Grainger et al. (Reference Grainger, Clarke, Auldist, Beauchemin, McGinn, Waghorn and Eckard2009) was observed when the dietary N concentration was marginal (16% CP) for the level of production, whereas New Zealand pastures frequently contain excess N (>20% CP). It is hypothesised that supplementation of lactating cow diets with black wattle tannin extract, up to about 2.9% of dietary DMI, will increase faecal N content without reducing milk production.
This study measured the response in milk yield and composition, as well as faecal N concentration, of dairy cows in early-mid lactation grazing good-quality ryegrass dominant pasture when black wattle tannin was given as either a drench or compounded with barley grain and fed as pellets. Faecal N concentration was measured because an increase in concentration in response to low doses/astringency of CT will indicate a reduced urinary N output, with minor effects on DM digestibility (Waghorn and Shelton, Reference Waghorn and Shelton1995). Direct measurement of urinary N output requires total collection from housed animals and was not practical in this study. The two types of administration were used because pelleting CT with supplements may be an easier management practice to supply CT than drenching.
Material and methods
Experimental site, treatments and animals
The study was undertaken at Scott Farm, DairyNZ, Hamilton, New Zealand (37°47′S, 175°19′E) during October to November 2010 and all procedures were approved by the AgResearch Ruakura Animal Ethics Committee (AEC no. 12119). Two experiments were conducted simultaneously over a 4-week period, comprising 4 days of covariate measurements followed by a 3-day adaptation period to CT administration, and a further 3 weeks of measurements. All animal parameters measured during the experimental period were also measured during the covariate period.
The Drenching experiment comprised 38 mixed-age multiparous Holstein–Friesian cows (mean live weight 466 kg, s.d. 47.3; days in milk (DIM) 82 days, s.d. 16.0), and treatment allocation was based on a balance of calving date, age, live weight and daily milk yield. There were four oral drench treatments: a control (not drenched, CONT, n = 20), low CT (111 g CT/day, LCT, n = 6), medium CT (222 g CT/day, MCT, n = 6) and high CT (444 g CT/day, HCT, n = 6). An additional 20 mixed-age multiparous Holstein–Friesian cows (mean live weight 463 kg, s.d. 44.7; DIM 77 days, s.d. 14.0) were used in the Pellet experiment, with 10 cows assigned to either a control (barley grain, CONTPEL) or tannin (barley grain and CT powder, TANPEL) treatment that supplied about 225 g CT/day. Cows were assigned to treatments based on a balance of calving date, age, live weight and daily milk yield.
The concentration of CT in the black wattle powder (Mimosa Central Cooperative Ltd, Pietermaritzburg, South Africa) was determined using the butanol-HCl method of Porter et al. (Reference Porter, Hrstich and Chan1985), and a purified extract from the same material as a standard. The powder contained 60.1% CT. For the drench treatments, the three groups of six cows were given either 185, 370 or 740 g CT powder dissolved in 500, 750 and 1000 ml water for the LCT, MCT and HCT treatments, respectively. Half of the daily dose was administered after each milking by gently pouring the mixture down the throat. Control cows were not drenched.
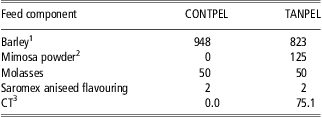
Ten cows in the Pellet experiment were offered 2.6 kg/day control pellets, and 10 were given 3.0 kg/day pellets with CT (2.30 and 2.68 kg DM/day, respectively), in two equal portions during morning and afternoon milking. The pellets were fed in individual feed bins in front of cows on the rotary milking platform, and refusals were weighed. The barley with or without CT pellets included small amounts of molasses and saromex aniseed flavouring (Table 1) and the amounts offered provided similar amounts of grain (and molasses) to cows in each treatment group.
Composition (g/kg as fed) of pellets without (CONTPEL) and with (TANPEL) CT, fed in the Pellet experiment
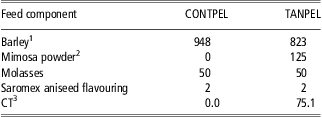
CT = condensed tannin; DM = dry matter.
1Barley 88% DM.
2Mimosa powder 94% DM.
3CT is 8.4% of pellet DM.
Pasture and cow measurements
All cows (Drench and Pellet experiments) grazed together as a single group on ryegrass–white clover swards, with the paddocks subdivided (electric fence) to provide a daily allowance of c. 45 kg DM/cow. Pasture was managed according to normal practice in New Zealand to maintain good quality (Holmes and Roche, Reference Holmes and Roche2007), and available DM mass was determined thrice weekly using a rising plate meter (Farmworks Electronic Plate Meter, Farmworks Ltd, Feilding, New Zealand). The meter was calibrated from six pre- and four post-graze, 0.2 m2 quadrats, cut to ground level at weekly intervals over the experiment, washed and oven-dried at 95°C for 48 h. Pre-grazing pasture mass was within the range 2400 to 3300 kg DM/ha and residuals after grazing were 1750 to 2200 kg DM/ha. Cows were weighed weekly after morning milking.
Hand plucked samples (n = 40) of herbage were taken twice weekly from the next paddock in the grazing sequence to determine DM content, pasture quality and composition. Pasture composition was determined by dissection of a 150 g sub-sample into perennial ryegrass, other grasses, white clover, weeds and dead matter, oven-dried at 95°C for 24 h and relative proportions determined. Twice weekly plucks were also dried at 60°C for 48 h, ground to pass a 1-mm diameter sieve and analysed for estimates of nutritive value (ADF, NDF, CP, ash and lipid) using near-IR reflectance spectrometry (NIRS; Corson et al., Reference Corson, Waghorn, Ulyatt and Lee1999).
Fluid milk yield (kg/day) was measured daily and samples were taken (bulked pm/am on a proportional basis) twice weekly to determine milk fat (%), milk CP (%), total protein, casein, lactose (%) and milk urea nitrogen (MUN; mmol/l) by IR spectrophotometry (Fossomatic™, Foss Electric, Hillerød, Denmark).
Faecal samples (c. 200 g wet weight) were collected (rectal grab sample) from each cow in the Drench experiment, once a week after morning milking and stored at −20°C. Faeces were later thawed, oven-dried at 60°C for 72 h, weighed for DM content and ground to 1 mm. The N concentration in faecal samples was analysed by total combustion (method 968.06; Association of Official Analytical Chemists (AOAC), 2005) using an N analyser (Leco, St Joseph, MI, USA).
Calculations and analyses
The number of cows in the Drench and Pellet treatments were calculated from a requirement to detect a 0.23% unit difference in faecal N concentration, based on data from cows fed increasing proportions of Lotus corniculatus with ryegrass pasture (Woodward et al., Reference Woodward, Waghorn, Watkins and Bryant2009). Means for each variable measured during the experimental period were calculated for each cow, and analysed using ANOVA in GenStat 14.1 (VSN International, 2011). As cows in both the Drench and Pellet experiments grazed together, all the data were combined in the one analysis. The ANOVA model included experiment (Drench and Pellet) and treatments within experiment, and cow was included as a random effect. A pre-experiment covariate was included in the model for milk production and live weight variables. Fisher's Protected Least Significant Difference was used to compare treatment means when the F-test was significant for the Drench or Pellet treatments.
Live weights were measured to determine if the tannin treatments affected live weight through increased gut fill, associated with slower rates of digestion as demonstrated in sheep by Waghorn et al. (Reference Waghorn, Shelton and McNabb1994a). Live weight change for each cow was calculated as the difference between the initial weekly live weight and the live weight measured at the end of the experimental period. In addition to weekly weighing of cows throughout the experimental period, weekly weights were also taken 4 weeks pre- and post-experiment, and using regression, estimates of the live weight change per day were derived to determine weight change over the experimental period.
DMIs were calculated from cow metabolisable energy (ME) requirements and the ME content of the diet. Cow ME requirements were estimated using the Standing Committee on Agriculture standards (SCA, 1990), based on age, live weight, live weight change and yield of milk, milk fat and CP and dietary ME by comparison with trials where similar pasture was fed to dairy cows and digestibility was measured.
Results
Pasture and DMI
The pasture on offer comprised (DM basis) 85% ryegrass, 9% clover and <1% dead matter. Average DM of the pasture over the 3-week measurement period was 16.5% and concentration of its constituents were CP 23.9%, s.d. 0.46; NDF 38.8%, s.d. 0.68; ADF 21.3%, s.d. 0.28; ash 10.4%, s.d. 0.15; lipid 3.7%, s.d. 0.09 and non-fibre carbohydrates were calculated to be 23.2% of the DM.
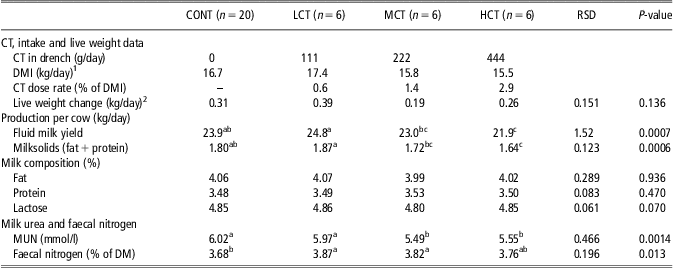
Interpretation of CT effects required the amount of CT to be expressed in relation to DMI, and the ME requirements for cows in the Drench and Pellet experiments were used to estimate DMI (Tables 2 and 3). The ME for the pasture eaten was determined as 0.82 multiplied by the organic matter digestibility (OMD; SCA, 1990) measured in lactating cows fed fresh pasture by Kolver and Aspin (Reference Kolver and Aspin2006) and Rius et al. (Reference Rius, Kittelmann, Macdonald, Waghorn, Janssen and Sikkema2012). The pasture in those studies had similar concentrations (% of DM) for NDF (41.0% and 36.4%) and CP (19.8% and 23.1%) and the DM digestibilities were 78.8% and 78.0%, respectively. Assuming pasture gross energy content to be 18.4 MJ/kg DM (SCA, 1990), a ME value of 12.1 MJ/kg was derived for pasture DM and 13.5 MJ/kg barley DM for calculations of DMI. The DMIs were 16.7 and 17.3 kg/day for CONT and CONTPEL cows in the Drench and Pellet experiments, respectively (Tables 2 and 3) and the calculated concentration of CT (% of DM) in the DMIs were 0.6 (LCT), 1.4 (MCT), 2.9 (HCT) and 1.2 (TANPEL) for Drench and Pellet experiments, respectively.
DMI, live weight change, milk production, MUN and faecal N concentration of cows grazing fresh pasture (CONT) and drenched with black wattle (Acacia mearnsii) CT extract at low (LCT), medium (MCT) and high (HCT) concentrations

DMI = dry matter intake; MUN = milk urea nitrogen; CT = condensed tannins; DM = dry matter.
Data are means for the 3-week measurement period in the Drench experiment.
1DMI (excluding CT) estimated by back-calculation using SCA (1990); assuming a dietary ME content of 12.1 MJ/kg DM.
2Based on regression of weekly live weights over 4 weeks preceding and succeeding the experimental period.
a,bValues within a row with same superscripts are not significantly different at 5% significance levels.
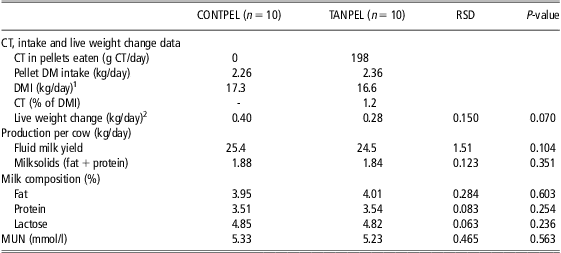
DMI, live weight change, milk production and MUN from cows grazing fresh pasture and supplemented with grain based pellets, with (TANPEL) and without (CONTPEL) CT extracted from black wattle (Acacia mearnsii)
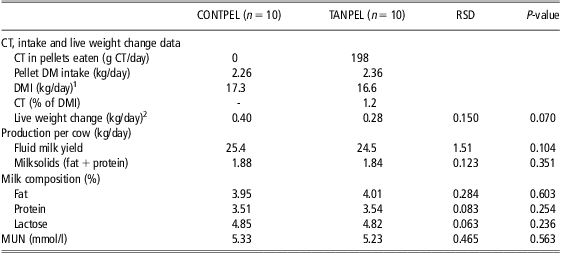
DMI = dry matter intake; CT = condensed tannins; DM = dry matter; MUN = milk urea nitrogen; ME = metabolisable energy.
Data are means for the 3-week measurement period.
1DMI (pasture and pellet) estimated by back-calculation using SCA (1990); assuming a dietary ME content of 12.1 MJ/kg DM.
2Based on regression of weekly live weights over 4 weeks preceding and succeeding the experimental period.
Drench experiment
Supplementation with either 111 or 222 g CT/day increased faecal N concentrations (P < 0.05) from 3.68 (CONT) to 3.82% to 3.87%, and the higher doses (222 and 444 g CT/day) also reduced (P < 0.01) MUN (Table 2). The effects on faecal N are indicative of a reduced dietary N digestibility and suggest a lower N excretion in the urine, whereas the lower MUN suggests reduced N absorption.
Average fluid milk yields were also affected by CT treatment (P < 0.001), with LCT cows producing 24.8 kg/day compared with 21.9 kg/day from those receiving the HCT treatment (Table 2). The increased yield (0.9 kg/day) from the LCT cows compared with the CONT cows did not reach significance. Milksolids (fat + protein; MS) followed a similar pattern (P < 0.001), with highest daily yields (1.87 kg/day) from LCT, and lowest (1.64 kg/day) from HCT. Concentrations of protein, fat and lactose were similar for all treatments (P > 0.05), so effect of CT on MS yields matched those of fluid milk (Table 2). Neither true protein nor casein concentrations in milk were affected by treatment (P > 0.05).
There were no treatment effects on cow live weight during the experiment, and although live weight data suggested the cows gained 19 to 26 kg over the 3-week experimental period (data not shown), these gains (0.9 to 1.2 kg/day) were greater than values determined from regression of live weight 4 weeks preceding and succeeding the experimental period (Table 2). The regression suggested true live weight gain ranged from 0.19 (MCT) to 0.39 (LCT) kg/day (P > 0.05), and the gain measured during the experimental period may have been a consequence of rumen fill, due to the high feed allowance in this trial.
Pellet experiment
Cows on the TANPEL treatment consumed 2.36 kg pellet DM/day (88% of offered) containing 198 g CT, and although this reduced fluid milk yield relative to CONTPEL cows (98% of pellets offered were eaten) by 0.9 kg/day the reduction in fluid milk yield was not statistically significant (P > 0.05). Mean MS production from cows in the Pellet experiment was not affected by treatment (P > 0.05; Table 3). Daily supplementation of pasture with 2.26 kg DM of grain-based pellets (CONTPEL) resulted in 1.5 kg more milk/day than the CONT cows in the Drench experiment (25.4 v. 23.9 kg/day, respectively).
The difference between CONTPEL and TANPEL treatments in milk yield was 0.78 kg/day after 1 week of treatment and 1.09 kg/day after 3 weeks, when MS production was 1.84 v. 1.79 kg/day for CONPEL and TANPEL treatments, respectively. Tannin supplementation in pellets did not affect the concentration or yields of milk fat, CP or lactose (P > 0.05; Table 3) or MUN (P > 0.05; Table 3).
Daily live weight gain calculated using weekly live weight averaged 0.85 kg for both groups during the treatment period, but regression based on 4 weeks of measurements preceding and succeeding the experiment showed much lower rates of gain, and averaged 0.40 and 0.28 kg/day for CONTPEL and TANPEL cows, respectively (P = 0.070; Table 3).
Discussion
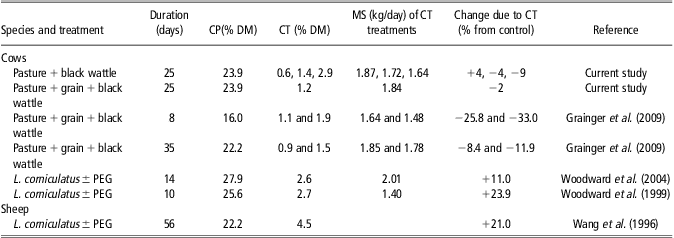
The hypothesis was proven in part, because the CT increased N concentrations in faeces, and although low concentrations of black wattle CT (0.6% of the DMI) increased milk production, higher concentrations reduced milk and MS yields. Pelleting the CT with barley reduced the acceptability of the grain, but the results did show that this is a potentially useful route for CT administration, and maybe more practical than drenching. The lower milk production in cows given about 1.4% v. 0.6% CT in the dietary DM, supported some of the findings by Grainger et al. (Reference Grainger, Clarke, Auldist, Beauchemin, McGinn, Waghorn and Eckard2009) who did not report any benefits of black wattle CT on production (Table 4). In contrast, significant benefits have been reported from the CT in L. corniculatus (Table 4) fed to lactating sheep and cattle. The increased N concentration in faeces of cows receiving low concentrations of CT suggests N apparent digestibility is reduced to a greater extent that DM digestion, but a total collection of urine was not possible at pasture and therefore the extent of re-partitioning of N away from urine could not be determined.
A summary of daily MS (fat + protein) production and effects of CT from either black wattle or in Lotus corniculatus when given to cows or sheep
MS = milksolids; CT = condensed tannins; DM = dry matter; PEG = polyethylene glycol.
The increased faecal N concentrations with CT (Table 2) were lower than the increase from 2.0% to 2.6% of faeces DM in sheep fed L. corniculatus with 2.17% CT in the DM (Waghorn et al., Reference Waghorn, Ulyatt, John and Fisher1987) and from 2.27% to 3.83% when Lotus pedunculatus with 5.5% CT in the DM was fed (Waghorn et al., Reference Waghorn, Shelton, McNabb and McCutcheon1994b). Carulla et al. (Reference Carulla, Kreuzer, Machmuller and Hess2005) reported an average reduction in N apparent digestibility of 11% when CT from black wattle was added (at 2.5% of the dietary DM) to either ryegrass, red clover (Trifolium pratense) or alfalfa (Medicago sativa) haylage fed to sheep, but OMD was only reduced by 2%, from 73.9% to 72.5%. These results, with similar findings from cows (Grainger et al., Reference Grainger, Clarke, Auldist, Beauchemin, McGinn, Waghorn and Eckard2009; Woodward et al., Reference Woodward, Waghorn, Watkins and Bryant2009) support the hypothesis that CT can increase faecal N concentration, and partition N excretion from urine to faeces, without necessarily lowering production. However, faecal N concentrations will not change if apparent digestion of both N and DM decreased by similar proportions. For example, Powell et al. (Reference Powell, Broderick, Grabber and Hymes-Fecht2009) found different levels of L. corniculatus fed with silage to dairy cows did not alter faecal N concentration, but the amount partitioned to faeces increased significantly, and this may have applied to the HCT treatment here. Powell et al. (Reference Powell, Wattiaux and Broderick2011) also showed reductions in MUN (as evident in the MCT and HCT treatments) were associated with reductions in urinary urea excretion and ammonia emissions from cows indoors (van Duinkerken et al., Reference van Duinkerken, Smits, Andre, Sebeck and Dijkstra2011), supporting the benefits of CT for reducing urinary N excretion.
The concentrations of dietary CT are poorly related to effects on digestion. For example, 7.2% CT in the DM of sulla fed to sheep (Stienzen et al., Reference Stienzen, Waghorn and Douglas1996) reduced apparent digestion of N by 19% (63.1% v. 77.7%) and DM by 3% (70.5% v. 72.5%), whereas 2.5% CT in carob reduced apparent N digestion by 23% (65.4% v. 84.6%) and DM digestibility by 19% (61.6% v. 75.9%) when fed to sheep (Priolo et al., Reference Priolo, Waghorn, Lanza, Biondi and Pennisi2000). Carulla et al. (Reference Carulla, Kreuzer, Machmuller and Hess2005) also showed 2.5% black wattle CT had a much greater effect on N than OM digestion, and similar findings have been reported in sheep fed Lotus spp. (Waghorn, Reference Waghorn2008). These variations in effects were probably due to structural differences (astringency) of the CT (Mueller-Harvey, Reference Mueller-Harvey2006) and differences in dietary N concentration.
The detrimental effects of low concentrations of black wattle CT on dairy cow production (Grainger et al., Reference Grainger, Clarke, Auldist, Beauchemin, McGinn, Waghorn and Eckard2009) appeared to be exacerbated by low concentrations of dietary CP (Table 4). They showed that supplementing a diet containing 22.9% CP with 0.9% and 1.5% black wattle CT, reduced MS production by 8% and 12%, respectively, and in the subsequent indoor feeding trial with 16% CP in the dietary DM, addition of 1.1% and 1.9% CT reduced DMIs by 13.2% and 26.4% and MS production by 26% and 33%, respectively. There is evidence that prolonged feeding of diets with CT can lead to reduced intakes in some situations, for example, after 2 weeks with sheep fed L. pedunculatus (Waghorn et al., Reference Waghorn, Shelton and McNabb1994a), and the reduction in DMIs of cows fed a diet containing 16% CP with black wattle CT may have been exacerbated by the prior 5 weeks of CT supplementation (Grainger et al., Reference Grainger, Clarke, Auldist, Beauchemin, McGinn, Waghorn and Eckard2009). These principal effects of CT are probably determined by concentrations of dietary N and CT, and astringency of the CT.
The lowest intake of CT in this study had no negative effects on MS production but increased faecal N concentration. This suggests 0.6% black wattle CT in the dietary DM did not reduce intake, but rumen proteolysis was reduced (Waghorn et al., Reference Waghorn, Ulyatt, John and Fisher1987 and Reference Waghorn, Shelton, McNabb and McCutcheon1994b). The pasture contained 23.9% of the DM, exceeding requirements for milk production, and therefore 0.6% black wattle CT was unlikely to limit amino acid availability for milk production, and when 1.2% CT was given, the detrimental effects on MS production were minor. In contrast, the benefits of CT in L. corniculatus for MS production in cattle (Woodward et al., Reference Woodward, Auldist, Laboyrie and Jansen1999 and Reference Woodward, Waghorn and Laboyrie2004) and milk yield in sheep (Wang et al., Reference Wang, Douglas, Waghorn, Barry and Foote1996), suggest Lotus CT had a lower astringency than black wattle, because concentrations were higher in the DM, and dietary CP concentrations were similar (Table 4) to those reported here.
Provided the CT does not reduce production, or efficiency of feed utilisation, any diversion of dietary N away from urine to faeces will have environmental benefits. An additional benefit of CT from black wattle is that low concentrations affected digestion, without detriment to milk yield. If costs of CT supplement were linked to environmental consequences of excessive urinary N, these may be recovered through the increased production reported here. Larger quantities of other CT sources (e.g. quebacho) would be required to lessen urinary N losses and are less likely to be cost-effective.
Conclusion
Supplementing lactating dairy cows grazing a high-quality pasture diet with black wattle tannin extract at about 0.6% of DM increased faecal N concentration, indicating a partitioning of dietary N away from urine. Low concentrations did not negatively impact on fluid milk or MS yield but higher dose rates (around 1.4 to 2.9% dietary DM) decreased production. When CT was pelleted with barley and provided at about 1.2% of dietary DM, pellet acceptability was reduced and fluid milk yield was 3.5% lower than controls. Comparison of these results with other studies confirms the high astringency of CT from black wattle. This source of CT provides a good option for reducing urinary N excretion because only small quantities need to be fed, but excess will lower milk production.
Acknowledgements
The authors thank the DairyNZ technical and statistical teams for assistance with the experiment and for statistical support, and Mike Tavendale (AgResearch, Palmerston North) for analysis to determine the CT concentration. Funding was provided by the MBIE Dairy Systems for Environmental Protection contract DRCX0802 and NZ dairy farmers through DairyNZ Inc.