I. INTRODUCTION
Higher data rates, an increasing variety of applications, and a rising number of subscribers are representatives of the continuously growing demands on today's wireless infrastructure. This requires communication standards (e.g. long-term evolution (LTE)) applying spectrum-efficient and flexible modulation schemes which optimize exploitation of the available limited bandwidth (e.g. wideband code division multiple access (WCDMA)). As a consequence, the most power consuming part in a base station, the radio-frequency (RF) power amplifier (PA), needs to be operated at high peak-to-average power ratios (PAPR) [Reference Fischer1]. Thus, efficiency is significantly reduced when using a common linear PA such as class-AB. Although having a much higher potential in terms of peak efficiency, the standard switch-mode concepts [Reference Shi2, Reference Raab3] do not show a better PAPR performance. In order to improve efficiency at usual power back-offs (e.g. 6 and 8 dB) one commonly applies the Doherty concept or a type of envelope tracking [Reference Kim4, Reference Moon5]. Also, outphasing has been explored [Reference Godoy6]. Moreover, binary coding schemes, e.g. types of delta-sigma, have been employed (e.g. [Reference Kim7, Reference Dupuy8]) to enhance the back-off efficiency.
Targeting a complete digital transmitter with flexible frequency usage, large signal bandwidths, and high overall efficiency, the class-S PA concept is a promising candidate, well-proven in the low-frequency range. However, the publications in the microwave frequency range so far show either reasonable output powers up to the 10 W range [Reference Wentzel, Meliani and Heinrich9, Reference Wentzel, Meliani and Heinrich10], but are limited to single-tone input signals, or they present characterization results with standard communication signals (CDMA and WCDMA), but at an output power level below 0.1 W [Reference Hung11, Reference Maier12]. Along with these class-S realizations [Reference Wentzel, Meliani and Heinrich9–Reference Maier12] different modulation approaches (e.g. band-pass delta-sigma and pulse-width modulation) have been tested in order to improve efficiency under back-off conditions.
In this paper a new approach is presented: an envelope delta-sigma modulator (EDSM) [Reference Hori13], realized by NEC in a 90 nm CMOS process, converts the analog input signals into digital bit streams which feed the Ferdinand-Braun-Institut (FBH's) GaN voltage-mode class-S (VMCS) PA [Reference Wentzel, Meliani and Heinrich10]. This architecture offers for the first time a full VMCS PA line-up and allows us to characterize it using realistic broadband communication signals (here: WCDMA), which is the focus of this work. As the coding efficiency has been identified as a critical parameter when optimizing (back-off) efficiency [Reference Wentzel, Meliani and Heinrich10], the EDSM concept is a promising candidate to optimize overall PA performance [Reference Hori13].
The paper is organized as follows: Section II describes the digital transmitter architecture and its parts. Section III presents and discusses the measurement results for single-tone and single-carrier as well as a four-carrier WCDMA downlink input signal. Section IV concludes the article.
II. EDSM DIGITAL TRANSMITTER
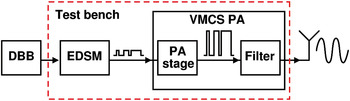
This section describes complete digital transmitter architecture and its parts in detail. The block diagram in Fig. 1 illustrates the transmitter structure.
Block diagram of the digital transmitter architecture realized including EDSM and VMCS PA.

A given analog input is converted into an I/Q signal by a baseband signal generator (DBB in Fig. 1). This signal feeds the realized test bench (see dashed box in Fig. 1). The amplifier chain investigated in this paper consists of an EDSM [Reference Hori13] and a VMCS PA [Reference Wentzel, Meliani and Heinrich10] for a highly efficient amplification of the RF signal. The modulator is connected to the VMCS PA via (50 Ω) sub-miniature version A (SMA) cable. The EDSM generates the envelope ΔΣ-modulated input signal for the VMCS amplifier, which includes a proper band-pass filter to restore the analog signal. The following subsections explain the realized parts in more detail.
A) Envelope ΔΣ-modulator
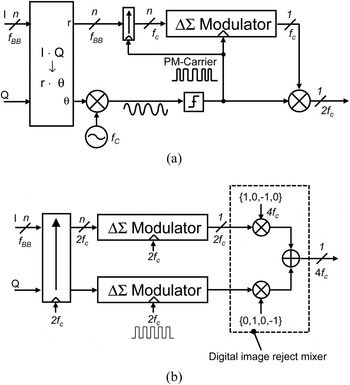
In the proposed transmitter architecture the 1-bit pulse train is generated by an EDSM using phase-modulated carrier clock (PMC–EDSM) shown in Fig. 2(a) [Reference Hori13]. While the architecture is similar to the conventional EDSM architecture [Reference Dupuy8], the proposed PMC–EDSM primarily features an EDSM whose sampling clock is synchronized with the PM-carrier. The phase information is represented by the pulse positions in the pulse train, which is generated by synchronously multiplying the ΔΣ-modulated envelope and the PM-carrier. Thus, the phase information is preserved as a pure analog signal with no quantization noise, leading to a higher signal-to-noise ratio (SNR), compared with the standard band-pass ΔΣ-modulation (BPDSM) architecture in the all-digital circuit topology shown in Fig. 2(b) [Reference Frappe14].
Block diagrams of 1-bit modulators in the proposed PMC–EDSM (a) and standard BPDSM (b) architecture.

As the focus of this work is a highly efficient PA operation with standard communication signals such as WCDMA, i.e., at high power back-offs, this section analyzes PA drain efficiency as a function of coding efficiency comparing standard BPDSM with the proposed EDSM (PMC–EDSM), for the case of a VMCS PA.
The drain efficiency η D of the switching amplifier is determined by the coding efficiency η C and switching loss P loss:
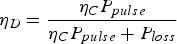 $$\eta _D = \displaystyle{\eta_C P_{pulse} \over \eta_C P_{pulse} + P_{loss}}$$
where P pulse represents the pulse power. At the saturated point in PMC–EDSM, the pulse train is identical to the phase-modulated carrier and thereby the envelope is 4/π times larger than half the pulse height, corresponding to η C of 81%. On the other hand, η C of the BPDSM architecture is about 40% since the envelope cannot exceed the pulse height and is further decreased by sinc filtering. Thus, assuming that P pulse and P loss in PMC–EDSM are equal to those in BPDSM, the η D of PMC–EDSM at the saturated point is higher than that of the BPDSM due to higher η C.
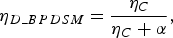
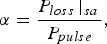
The P loss is mainly dominated by power loss due to the charge/discharge cycle process onto the parasitic output capacitor (C p). Thus, P loss is proportional to the switching rate. The switching rate in the PMC–EDSM is equal to the carrier frequency at the saturated point and decreases proportionately to the square root of the output power, or η C, in the back-off region [Reference Hori13]. In contrast, it is always equal to the carrier frequency in the BPDSM case. Thus, the η D of the PMC–EDSM, η D_PMC−EDSM, and BPDSM, η D_BPDSM, are respectively expressed as:
 $$\eta_{D\_PMC - EDSM} = \displaystyle{\eta_C \over \eta_C + \alpha \sqrt{\eta_C /0.81}}\comma \;$$
 $$\eta_{D\_BPDSM} = \displaystyle{\eta_C \over \eta_C + \alpha}\comma \;$$
 $$\alpha = \displaystyle{P_{loss} \left\vert_{sa} \right. \over P_{pulse}}\comma \;$$
where P loss|sa represents the switching loss for a periodic square-wave signal.
Figure 3 shows the theoretical dependence of drain efficiency on coding efficiency for the VMCS PA reported in [Reference Wentzel, Meliani and Heinrich10]. The points P1 and P2 in Fig. 3 are the saturated points in PMC–EDSM and BPDSM, respectively. The drain efficiency at P1, where the input signal is a periodic square-wave, is 85% as reported in [Reference Wentzel, Meliani and Heinrich10]. For a WCDMA downlink signal with a PAPR of 7.5 dB, the drain efficiency with PMC–EDSM is more than twice the BPDSM value as shown at P3 and P4 in Fig. 3.
Simulated drain efficiency (η D) of the used VMCS PA as a function of coding efficiency (η C) for PMC–EDSM and BPDSM.

Our investigations show that PMC–EDSM, compared to BPDSM, leads to a higher drain efficiency of the switch-mode PA due to higher coding efficiency and lower average switching rate. Thus, EDSM is a suitable candidate to significantly enhance efficiency, also at high power back-offs.
B) GaN VMCS PA
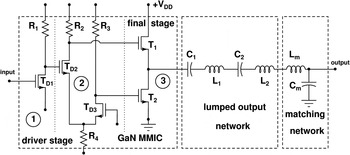
The VMCS PA consists of a GaN power switch monolithic microwave integrated circuit (MMIC) with final stage in push–pull configuration (gate width: 4 × 250 µm) for highly efficient amplification of the bit sequences and a hybrid output network including a band-pass filter to filter out the wanted signal from the amplified bit stream and a matching network to 50 Ω. The schematic of the amplifier is comparable to the one published in [Reference Hori15] and is shown in Fig. 4. The parts are described in the following two subsections (Sections II(B)(1). and II (B) (2)).
Schematic of the VMCS PA module for the 450 MHz band consisting of GaN power-switch MMIC, band-pass filter (C 1/2, L 1/2), and matching network (L m, C m).

1) GAN POWER SWITCH MMIC
The power switch MMIC (GaN MMIC in Fig. 4) was fabricated using FBH's coplanar GaN-HEMT (High electron Mobility Transistor) MMIC process. The final stage of the voltage-mode switching amplifier consists of two transistors (T 1 and T 2) in push–pull configuration with 4 × 250 µm gate-width each. Circuit design including large-signal time-domain simulations was performed using the Chalmers (Angelov) transistor model, modified for application to AlGaN/GaN HEMTs on SiC in the time domain [Reference Angelov16].
The driver stage consists of two parts, 1 and 2 (cf. Fig. 4): a common-source amplifier (1) with a passive load (R 1) of around 20 Ω and a differential amplifier (2) with the passive loads R 2 and R 3. Note that all the driver impedances (R 1 − R 3) have to be realized through broadband, which makes it impossible to apply classical reactive impedance matching.
The common-source configuration (1) amplifies the single-ended input signal (small amplitude: ≈ 1.8 V pp) and feeds one input of the differential amplifier (T D2). The second input (T D3) is RF-grounded. Moreover, the connected sources of T D2 and T D3 are fed symmetrically with a constant current through R 4.
The differential amplifier (2) generates the input voltage for the final stage ((3) in Fig. 4). The signal V in_up at the gate of the upper final-stage transistor T 1 ranges between a voltage lower than the pinch-off voltage V P (typically –4 V) and V DD (in our case: max. 40 V). Thus, a very high input voltage swing (−10 V ≤ V in_up ≤ 40 V) is present at the gate of T 1. A comparatively small voltage swing needs to be generated at the input of T 2 (−10 V ≤ V in_low ≤ 1 V). Here, 1 V is enough to switch T 2 in the “on-state”.
2) HYBRID OUTPUT NETWORK
The output network was designed with two L–C parts (C 1/2 and L 1/2 in Fig. 4) in series for band-pass filtering and a simple L–C low-pass network (L m, C m) for matching to 50 Ω. The band-pass filter as well as the matching network are realized with lumped inductors (Q > 100) and capacitors (Q > 10 000).
The complete network was fabricated on RO 4003 printed circuit board (PCB) laminate (ɛr = 3.55) with 0.81 mm substrate thickness and a conductor thickness of 70 µm. It was mounted on a copper heat sink. To minimize parasitic capacitances of the interconnections, backside metallization was removed under the band-pass filter structure. The chips are mounted on the heat sink and connected to the board by wire-bonding.
In addition to the circuit simulations of the filter, we performed electromagnetic (EM) simulations to account for all layout parasitics. The simulated overall insertion loss of the output network is about 0.8 dB. Accurate measurements of the filter could not be performed because of calibration problems due to different interconnect types, on-wafer at the input (for bond-wire connection to the hybrid board), and SMA at the output.
An important parameter to be optimized is the impedance Z in presented by the output network to the final stage. At the signal frequency of 400 MHz, it should assume an optimum value Z opt which is derived from the maximum voltage/current rating of the final-stage transistors used. Here, the lumped output network was designed to present a Z opt of about 40 Ω at 400 MHz to the final-stage devices, in this case two 4 × 250 µm GaN-HEMTs. Moreover, below 100 MHz and above 700 MHz the impedance is higher than 100 Ω which should lead to an acceptable suppression of higher-order harmonics (2f S· 5f S).
One should note that for optimization of the output circuit the drain-source capacitance C ds of the final-stage GaN HEMTs T 1 and T 2 (see Fig. 4) as well as the inductance of the connecting bond-wires between the MMIC output and the circuit board have been taken into account. This is important since the resulting L–C network (bond-wire: L; C ds: C) de-tunes the circuit.
It is important to note that the realized VMCS PA does not use freewheeling diodes to protect the final-stage GaN-HEMTs against backward currents, which occur when using non-periodic signals such as ΔΣ-modulated ones. This leads not only to higher efficiencies as the diode's capacitance is a considerable loss mechanism of the VMCS topology, but also the device can be destroyed because of backward currents through the transistors. It turned out that FBH's transistors are robust enough to handle these short-term transients. Additional information about the VMCS PA can be found in [Reference Wentzel, Meliani and Heinrich10].
III. MEASUREMENT RESULTS
This section presents and discusses the measurement results of the VMCS PA for different input signals encoded in BPDSM and envelope ΔΣ-modulation using PMC (PMC–EDSM; cf. Section II(A)). PMM–EDSM will be referred to as EDSM in the following. The signal frequency (f S) is 400 MHz for all measurements. First, single-tone signals are applied.
A) Influence of coding efficiency
According to the investigations in Section II(A) and [Reference Wentzel, Meliani and Heinrich10] the behavior of the VMCS PA regarding drain efficiency as a function of coding efficiency is analyzed for BPDSM and EDSM input signals having a (narrowband) single tone at f S and varying power back-offs (0 … 10 dB) encoded. This indicates the amplifiers’ potential regarding maximum efficiency and output power at respective power back-offs.
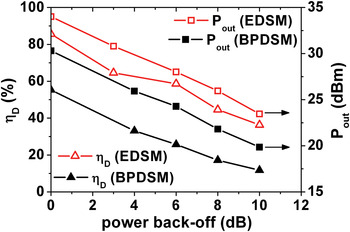
It is important to note that the generation of the BPDSM bit sequences is a pure software action while the EDSM pattern are generated by the modulator realized by NEC (cf. Section II(A), [Reference Hori13]). This leads to different measurement setups with regard to pattern generation. The RF amplifier part is in both setups represented by the VMCS PA. In the BPDSM setup a pulse pattern generator feeds the PA input with the stored pattern while in the EDSM case this is realized by NEC's modulator. Figure 5 shows the measured P out and η D as a function of power back-off (0–10 dB) for a fixed drain supply voltage (V DD) of 30 V at the final stage of the VMCS PA.
Measured output power (P out) and drain efficiency (η D) as a function of power back-off for single-tone BPDSM and EDSM input signal; V DD: 30 V.

The output power for EDSM is around 4 dB higher than for BPDSM over the entire back-off range because of higher coding efficiency (cf. Section II(A)). More importantly, however, this translates into significantly higher drain efficiency. The EDSM data exceeds the BPDSM case by about 30% over the full range. Starting with 86% at full-scale (0 dB back-off) the EDSM efficiency stays above 36% in a 10 dB power back-off range, which, in terms of efficiency values, compares well with other concepts such as Doherty. For example, in [Reference Kim4] the Doherty amplifier achieves a final-stage drain efficiency of around 56% for a 8.5 dB power back-off 10 MHz WiMAX input signal (1 carrier), though this was reached at a higher signal frequency of 2.555 GHz than in this work (400 MHz). For the usual UMTS back-off, range of 6 dB efficiency is about 60%. These results compare well with the values achieved with test signals for different pulse-width modulation approaches published in [Reference Wentzel, Meliani and Heinrich10]. Overall, the results reveal the great potential of the PA when using EDSM input signals.
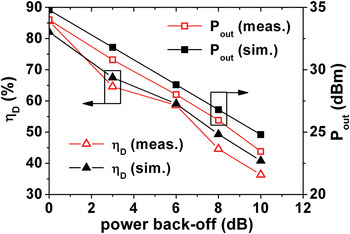
As an example, in order to prove the suitability of the simulations used to design the PA, Fig. 6 compares the simulated and measured results for the single-tone EDSM input signal versus power back-off (cf. Fig. 5) at a drain supply voltage V DD of 30 V. All simulations have been performed in Agilent's ADS.
Comparison of simulated (sim.) and measured (meas.) output power (P out) and drain efficiency (η D) as a function of power back-off for single-tone EDSM input signal; V DD: 30 V.

The simulation setup corresponds with the test bench marked in Fig. 1, i.e. EDSM provided by NEC and VMCS PA including output filter topology realized by FBH (see Section II(B), [Reference Wentzel, Meliani and Heinrich10]). The I/Q data from the digital baseband signal generator (DBB in Fig. 1) were provided in a text file by NEC and used to feed the EDSM in the simulation.
From Fig. 6 one observes good agreement between the simulated and measured results for both output power P out and drain efficiency η D. Maximum variations in the range of 3% and 0.8 dB for η D and P out are achieved, respectively. The P out in the simulation exceeds the measured values over the full back-off range, but shows a similar characteristic. Possible reasons for higher simulated output power could be on one hand inaccurate models of the lumped elements (L, C) used in the output network. Thus, different impedance characteristics and higher losses compared to the simulation may result in lower measured P out. On the other hand, the FBH GaN HEMT model used is not yet fully optimized for time-domain simulation, which may cause slight deviations of the waveforms at the inputs and outputs of the GaN HEMTs.
B) Single-carrier WCDMA downlink signal
In order to benchmark the realized VMCS PA for standard communication signals, it is characterized with a single-carrier downlink WCDMA signal. The PAPR is 7.5 dB and RF channel bandwidth around the f S of 400 is 5 MHz (chip rate: 3.84 Mcps). As our previous investigations (Sections II(A) and III(A)) indicated clearly the superior properties of EDSM; the WCDMA signal is modulated with the EDSM provided by NEC.
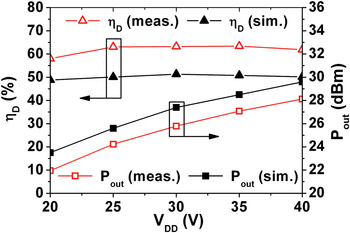
First, Fig. 7 presents the simulation (sim.) and measurement (meas.) data of drain efficiency (η D) and channel output power (P out) of the VMCS PA, for the WCDMA input signal as a function of the drain supply voltage V DD at the final stage. Here, η D denotes the ratio between signal channel power at the output after the filter (bandwidth: 5 MHz) and the DC power consumption of the final stage of the voltage-mode PA.
Simulated (sim.) and measured (meas.) output power (P out) and drain efficiency (η D) as a function of drain supply voltage (V DD) for EDSM single-carrier WCDMA downlink input signal; PAPR: 7.5 dB.

Regarding the measured values, the VMCS PA shows a maximum η D of around 64% and a maximum channel power (f S = 400 MHz) of nearly 0.7 W for a V DD of 40 V. Efficiency stays almost constant above 60% in the 6 dB output power range (V DD = 20–40 V). This indicates that the output power can be controlled without degradation in efficiency. These results demonstrate the high potential of the VMCS PA operated with an EDSM input signal as the values achieved are competitive with well-established concepts like Doherty or envelope tracking [Reference Kim4, Reference Moon5]. Moreover, the achieved values are comparable with more linear types of PAs applying EDSM [Reference Kim7, Reference Dupuy8]. For example, a class-J PA exhibits around 60% of final-stage drain efficiency at 2.6 GHz for a 3 G LTE 10 MHz input signal having a back-off of 8.5 dB encoded [Reference Kim7] (cf. also Section III(A)). For VMCS operation, this is the best performance ever achieved at this power level in the microwave frequency range.
Comparing the simulated with the measured characteristics in Fig. 7, they show almost the same behavior for both quantities, output power, and drain efficiency. However, looking at the quantitative data, the simulated values are significantly different from the measurements. P out and η D show maximum deviations of 1.5 dB and 13%, respectively. Although the simulated output power is higher than the measured one over the whole V DD range (cf. also Fig. 6), the corresponding drain efficiency shows lower values compared to measured ones. This is caused by a significantly higher simulated DC current (almost 2 times the measured I dc) through the final stage transistors. All other DC currents of different PA stages in the simulation agree well with the measured values.
One reason for this could be the differences between simulated and actual impedance characteristics of the output network, which are due to model inaccuracies of the lumped elements (cf. Section III(A), Fig. 6). If the actual impedance is higher than expected in the simulation, the measured current is lower in case of the same V DD applied to the final stage. Thus, measured P out is lower than predicted as well. This was observed already for single-tone input (max. −0.8 dB, see Fig. 6) and adds up when using a more broadband signal (−1.5 dB) because of a wider channel with more frequency components. This leads to lower DC power consumption in the measurement case because less (DC) current flows through the HEMTs. Moreover, small variations in DC current (≈10 mA) at low P out's (max. 0.7 W) translate into big differences in drain efficiency.
The factors described above explain the variation between measurement and simulation. However, these differences have to be analyzed in more detail to fix them in future work.
To check the linearity and thus the distortions arising from the VMCS PA, the adjacent channel leakage ratios (ACLR) at 5 MHz (ACLR5) and 10 MHz (ACLR10) offset from f S (400 MHz) of the amplifier are measured at the output and compared to the values of the appropriate input signal (EDSM output). One must note that no linearization techniques were applied.
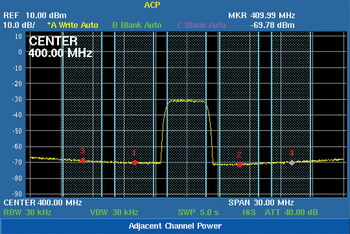
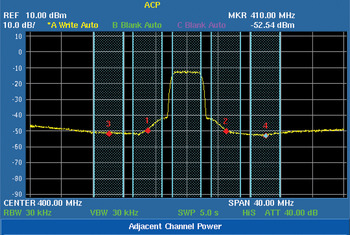
While Fig. 8 presents the signal spectrum at the input of the VMCS PA, i.e., the EDSM output (cf. Fig. 1), Fig. 9 shows the output spectrum of the VMCS PA for a fixed V DD of 40 V, i.e., for maximum output power. Note the different resolutions of input (30 MHz) and output signal (40 MHz) in terms of frequency span.
Measured spectrum of the EDSM single-carrier WCDMA downlink signal at the input of the VMCS PA; PAPR: 7.5 dB; span: 30 MHz; channel power: 9.7 dBm; f S: 400 MHz.

Measured output spectrum for EDSM single-carrier WCDMA downlink input signal; PAPR: 7.5 dB; V DD: 40 V; span: 40 MHz; channel output power: 28.1 dBm; f S: 400 MHz.

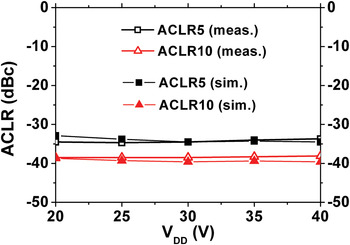
Figure 10 illustrates the simulated and measured ACLR characteristics at the PA's output as a function of V DD. The measured ACLR at 5 and 10 MHz frequency offset were almost constant around −34 and −38 dBc in the V DD range from 20 to 40 V, respectively.
Simulated (sim.) and measured (meas.) ACLR of output signal as a function of drain supply voltage (V DD) in 5 MHz (ACLR5) and 10 MHz (ACLR10) offset; f S: 400 MHz; input: single-carrier WCDMA downlink; PAPR: 7.5 dB.

From Fig. 10, one observes that simulation predicts the ACLR characteristics well. Maximum variations in the range of 1.5 dB (V DD = 40 V) represent good accuracy of simulation in terms of linearity analysis of the PA. Hence, the differences between simulated and measured P out and drain efficiency (see above) cannot be related to significant variations in ACLR.
The 3 Generation partnership project (GPP) linearity requirements for WCDMA downlink are not fulfilled by the realized amplifier. This is because on the one hand the EDSM itself does not fulfill the requirements as the signal frequency of 400 MHz is not the optimum operation region [Reference Hori13]. Here, a maximum ACLR of −40 dBc has been achieved at the PA input. On the other hand, the digital VMCS PA further distorts the broadband input signal leading to significantly developed “shoulders” (spectral leakage) at 5 MHz frequency offset (see Fig. 9), which are not observed in the input spectrum (cf. Fig. 8).
Further work has to be performed for investigating this effect in more detail. Moreover, new linearization techniques dedicated to the class-S case are to be developed.
C) Four-carrier WCDMA downlink signal
To analyze the impact of a multi-carrier input and thus signals with wider bandwidth, the realized VMCS PA is characterized by means of a 4-carrier WCDMA downlink signal. Again, the signal is modulated with NEC's EDSM, signal frequency f S is 400 MHz, RF channel bandwidth per carrier is 5 MHz, thus we have 20 MHz total signal bandwidth, and PAPR is 7.5 dB.
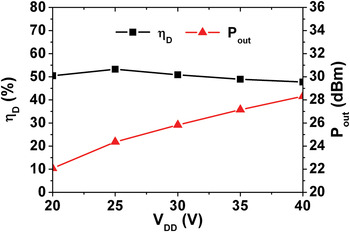
Figure 11 presents drain efficiency (η D) and measured channel output power (P out) versus drain supply voltage V DD of the final stage of the PA. The drain efficiency is calculated similar to Section III(B), however here there are 4 carriers contributing to P out according to the input signal. In terms of P out, first the value for one carrier was determined and then 6 dB added which is compliant when increasing the number of carriers by a factor of 4.
Measured output power (P out) and drain efficiency (η D) as a function of drain supply voltage (V DD) for EDSM 4-carrier WCDMA downlink input signal (PAPR: 7.5 dB).

Using a 4-carrier WCDMA downlink input signal the PA reaches a maximum output power of about 0.7 W (V DD = 40 V) and a maximum drain efficiency of 53%. The characteristics shown in Fig. 11 are comparable to the single-carrier measurements presented in Fig. 7. Also, total channel power is equal to the 1-carrier case (max. 0.7 W). However, one should note that the maximum efficiency is reduced by about 10% when using the 4-carrier input signal. This is due to a 5 mA-difference in the DC current flowing through the final stage transistors.
One possibility to explain the decrease of drain efficiency when increasing the number of carriers may be the lack of headroom for oversampling. The quantization noise in a 4-carrier signal around f S is larger than in the single-carrier case. This may lead to a decrease of η D since more quantization noise falls into the pass-band of the band-pass filter at the output of the PA and thus causes additional loss.
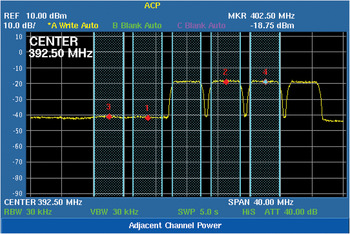
Figure 12 shows the output signal of the VMCS PA for the 4-carrier input in a frequency span of 40 MHz around a center frequency of 392.5 MHz. This setting was used to measure the lower-band ACLR of the multi-carrier signal. The drain supply voltage V DD at the final stage is 40 V which corresponds to maximum output-power operation. The measured channel power for one carrier is about 22.3 dBm, which results in 28.3 dBm for four carriers. This P out value is comparable to the power achieved with a single-carrier input at a V DD of 40 V (cf. Figs 7 and 9).
Measured output spectrum for EDSM 4-carrier WCDMA downlink input signal; PAPR: 7.5 dB; V DD: 40 V; span: 40 MHz; channel output power: 28.3 dBm (four carriers); f S: 400 MHz.

Comparing the data in Fig. 12 to the respective ACLR values at the output (not shown here) one observes a significant reduction when increasing the number of carriers. The PA shows a maximum ACLR (5, 10 MHz) of about −24 dBc at the output when using a 4-carrier WCDMA input signal. This means that the ACLR is decreased by about 14 dB compared to single-carrier operation with a maximum of −38 dBc (ACLR10). Clearly, this needs to be improved to achieve efficient broadband operation with high linearity.
One reason for the lower ACLR in the four-carrier case is that, in contrast to a single-carrier signal, the nonlinearity of the PA causes mixing of more than one carrier, which increases the intermodulation terms within the adjacent channels. Thus, the added power in the lower and upper channels decreases ACLR compared to the single-carrier case. Moreover, the reduced linearity of the PA due to wider bandwidth may affect efficiency (see Figs 7 and 11).
In summary, although not yet directly satisfying the 3 GPP linearity specifications, the VMCS PA topology is a promising alternative to be used in future base stations. Since the class-S PA concept differs basically from the more common ones, the sources of nonlinearities as well as appropriate linearization techniques need further investigation and optimization.
IV. CONCLUSIONS
A digital transmitter architecture including an EDSM from NEC and a VMCS PA from FBH for the 450 MHz band has been realized and characterized in a joint experiment.
Single-tone measurements using standard BPDSM and EDSM excitation show that higher coding efficiency of the EDSM translates into a much higher output power (+4 dB) and drain efficiency over the full back-off range from 0 to 10 dB. At full scale, maximum power is increased to 2.5 W at 86% drain efficiency and an efficiency improvement at 10 dB power back-off from 12% (BPDSM) to 36% is achieved, respectively.
For a standard single-carrier WCDMA downlink signal (PAPR: 7.5 dB) the amplifier shows a maximum drain efficiency of up to 64% and a channel output power of 0.7 W. Exciting the PA with a more broadband 4-carrier signal (20 MHz bandwidth) having the same PAPR encoded efficiency leads to a drop of 53%. The ACLR at the output of the PA has not yet fulfilled the 3 GPP linearity requirements and needs further investigation.
This is the first complete VMCS PA chain characterized with standard communication signals encoded in envelope delta-sigma modulation. The results document the potential of the VMCS PA driven by EDSM to be used in future base stations.
 Andreas Wentzel received the Dipl.-Ing. and the Ph.D. degree in electrical engineering from the Technical University of Berlin, Germany, in 2006 and 2011, respectively. He is presently a post-doc in the microwave department of Ferdinand-Braun-Institut (FBH) in Berlin, Germany. His research activities focus on the design of novel transmitter architectures including advanced switch-mode power amplifier concepts realized on GaN, especially in class-S and class-D operation, as well as on optimized modulation schemes and filter structures suitable for these types of PAs.
 Shinichi Hori received the B.E. degree in mechanics and the M.E. degree in electronics from the University of Tokyo, Japan, in 1998 and 2000, respectively. He joined NEC Corporation in 2000 where he has been engaged in the research and development of RF CMOS circuits for wireless communication. In 2008, he was a visiting scholar in the Center for Integrated Systems, Stanford University. His current interests include high-efficiency power amplifier architecture and IC/module implementation for mobile base stations, and multi-mode/multi-band transceiver ICs for software-defined-radio systems. Mr Hori is a member of IEEE Solid-State Circuits Society, and Institute of Electronics, Information and Communication Engineers (IEICE), Japan.
 Makoto Hayakawa received the B.E. degree in electrical and electronics engineering and the M.E. degree in electrical and mechanics engineering from Chiba University, Japan, in 1999 and 2001, respectively. He joined NEC Corporation in 2001 where he has been engaged in the development of RF Power amplifiers for wireless communication systems.
 Kazuaki Kunihiro received the B.S. and M.S. degrees in applied physics from Tokyo Institute of Technology, Tokyo, Japan, in 1988 and 1990, respectively, and the D.E. degree in quantum engineering from Nagoya University, Nagoya, Japan, in 2004. In 1990, he joined NEC Corporation, Kawasaki, Japan, where he has been engaged in device simulation, modeling, and circuit design of GaAs FETs, InGaP/GaAs HBTs, and GaN FETs for wireless communication. From 1995 to 1996, he was a visiting researcher at Technical University of Berlin, Berlin, Germany, where he studied nonlinear modeling of III–V compound semiconductor devices. His current interests include high-efficiency power amplifier architecture, such as envelope tracking and digital transmitter, and their IC/module implementation for mobile base stations, and multi-mode/multi-band transceiver ICs for software-defined-radio systems. Dr Kunihiro is a member of the Institute of Electronics, Information and Communication Engineers (IEICE), Japan.
 Wolfgang Heinrich received the Dipl.-Ing., Dr.-Ing. and habilitation degrees in 1982, 1987, and 1992, respectively, all from the Technical University of Darmstadt, Germany. Since 1993, he has been with the Ferdinand-Braun-Institut (FBH) at Berlin, Germany, where he is the head of the microwave department and deputy director of the institute. Since 2008, he has also been a professor at Technical University of Berlin. His present research activities focus on MMIC design with emphasis on GaN power amplifiers, mm-wave packaging, and electromagnetic simulation. Prof. Heinrich has authored or coauthored more than 250 publications and conference contributions. He served as Distinguished Microwave Lecturer for the term 2003–2005, as chairman of the German IEEE MTT/AP Chapter from 2002 to 2007, as chair of the MTT-12 Committee on interconnects, packaging, and manufacturing from 2006 through 2008, and as Associate Editor of the IEEE Transactions on MTT from 2008 until 2010. Since 2010, he has been President of the European Microwave Association (EuMA).