Flint’s water crisis has brought renewed⸺and needed⸺attention to the importance of safe drinking water in the United States. For nearly eighteen months, from April 2014 to October 2015, the City of Flint delivered inadequately treated Flint River water to residents, exposing them to a range of water contaminants: 40% of Flint homes and a number of schools were found to have elevated lead levels and persistently elevated levels of trihalomethanes (a disinfection byproduct), and an outbreak of Legionnaires’ disease killed at least twelve people (Zahran et al. Reference Zahran, McElmurry, Kilgore, Mushinski, Press, Love, Sadler and Swanson2018). The drinking water contamination in Flint has been linked to elevated blood lead levels in children and higher rates of infertility and miscarriage in pregnant women, with poor children and families particularly affected (Hanna-Attisha et al. Reference Hanna-Attisha, LaChance, Sadler and Schnepp2015; Kennedy et al. Reference Kennedy, Yard, Dignam, Buchanan, Condon, Brown and Raymond2016; Zahran, McElmurry, and Sadler Reference Zahran, McElmurry and Sadler2017). The contamination has also placed new financial burdens on low-income households seeking alternative water supplies. More than five years later, the city’s residents still do not have consistent access to safe drinking water (Holden, Fonger, and Glenza Reference Holden, Fonger and Glenza2019). Most recently, there are concerns that the city’s school district is not able to adequately address learning and behavioral challenges in children exposed to lead in the drinking water (Green Reference Green2019).
The Flint water crisis has gained national and international attention, providing an important opportunity to take stock of the challenges facing communities throughout the United States. Nationally, between 15 and 22 million people have either a full or partial lead service line connecting their home to the city’s water supplies (Cornwell, Brown, and Via Reference Cornwell, Brown and Via2016). Since the Flint water crisis, cities such as Baltimore, Newark, Portland, Pittsburgh, and Detroit have faced their own problems with elevated lead levels in their drinking water. Investigative reporting has revealed that many cities are not following the drinking water testing and monitoring procedures recommended by the U.S. Environmental Protection Agency (Milman and Glenza Reference Milman and Glenza2016). At the same time, U.S. cities are confronting water infrastructure investments needs in the billions of dollars (U.S. EPA 2018). Many experts and commentators have warned that Flint is the “canary in the coal mine” and that “there are other Flints lurking in the United States” (Loiaconi Reference Loiaconi2016). Given the severity of the Flint water crisis, and the ubiquity of the challenge of providing safe drinking water in U.S. cities, what insights can be gained from a closer examination of this case?
This task⸺of diagnosing the causes of the Flint water crisis and the lessons they provide⸺has been taken up by state and federal decision makers (Michigan Civil Rights Commission 2017; Flint Water Advisory Task Force 2016; U.S. House Committee on Oversight and Government Reform 2016) and a number of academics (e.g., Pauli Reference Pauli2019; Nickels Reference Nickels2019; Roy and Edwards Reference Roy and Edwards2019; Baum, Bartram, and Hrudey Reference Baum, Bartram and Hrudey2016; Gostin Reference Gostin2016; Highsmith Reference Highsmith2016). Pinpointing a single “cause” of the Flint water crisis is impossible: there are numerous possible explanations for what happened, ranging from poor decision making on the part of local officials to the unaddressed consequences of industrial decline, disinvestment, and white flight. These factors all had a role to play in causing the water crisis and offer their own entry points for improving the safety and reliability of drinking water in Flint and cities across the United States.
My aim is to draw out more explicitly the role that rationalized policy played in motivating, facilitating, incentivizing, and allowing the mistakes and decisions that most proximately led to the Flint water crisis. Rationalized policy is policy (and its implementation) that is framed or supported as politically neutral or purely technical in nature and consequently facilitates decision-making that fails to protect communities or the public interest. I argue that the rationalization of two specific policy domains facilitated the Flint water crisis: drinking water protection via the federal Safe Drinking Water Act’s (SDWA) Lead and Copper Rule (LCR) and municipal financial distress response via Michigan’s Local Financial Stability and Choice Act (PA 436). Elected officials and administrators in both domains failed Flint residents by prioritizing the technical and financial merits of their decisions, policy goals, and implementation strategies over the public interest. This dual and compounded policy rationalization led to and allowed the decisions that produced the extended contamination of the Flint’s drinking water. My argument builds on and extends existing analyses of the Flint water crisis, drawing on thirteen semi-structured interviews with local activists, decision makers, scientists, journalists, and scholars working in or with the City of Flint and a review of reports, testimony, news articles, and secondary demographic and financial data.
This perspective provides two critical insights. First, viewing the Flint water crisis as the product of multiple forms and sources of rationalized policy reveals the broader structural vulnerability of poor and minority communities to such a crisis in the United States. These communities are more likely to be targeted for state intervention and austerity measures, suppressing local voices, and to drink water that fails to meet safe drinking water standards. The Flint water crisis reveals the particularly devastating consequences of exposure to multiple forms and sources of rationalized policy.
Second, the response to the Flint water crisis reveals the deep entrenchment of rationalization in these policy domains, or more specifically the interests benefitting from rationalization, and its ongoing threat to safe drinking water provision. At both the state and federal levels the primary response to the Flint water crisis has been to strengthen drinking water safety standards and monitoring practices. However, these revisions fail to counteract the effects of rationalization to expand the “scope of risk protection” (Hacker Reference Hacker2004) provided to communities. Further, the Flint water crisis demonstrates that safe drinking water provision is only partly a technical problem; it is also a fundamentally social and political one that requires funding and supporting local government in ways that ensure their capacity to build and maintain infrastructure, provide reliable services, and sustain meaningful dialogue and engagement with their residents. Michigan (and other states) continue to address municipal financial distress through technocratic and rationalized policies that do not account for the broader structural challenges facing cities or mitigate the now-readily apparent local impacts of austerity measures (Peck Reference Peck2012; Weaver Reference Weaver2017; Pill Reference Pill2020).
If we are to view Flint as the “canary in the coal mine,” then learning from the Flint water crisis requires counteracting and confronting the marginalizing effects of rationalized policies and the declining scope of risk protection that these provide to our communities. Lessons can be found in alternative strategies for preventing and addressing municipal financial distress and in more holistic approaches to ensuring safe drinking water provision. Future research can further examine the construction, operation, and effects of rationalized policy on safe drinking water provision; alternative policy approaches and their political potential; and the strategies used by city governments and communities to counteract the marginalizing effects of rationalized state and federal policies.
Rationalized Policy: What It Is and What It Does
As described earlier, rationalized policy is policy (and its implementation) that is framed or supported as politically neutral or purely technical in nature and consequently facilitates decision-making that fails to protect communities or the public interest. Techno-rational approaches to policy and policymaking hold a certain appeal, promising more effective decision-making that eschews politics in favor of evidence and managerial concerns. However, too often technocracy cloaks decisions and priorities in the language of rationality and science while failing to consider the public’s preferences. Rationalizing narratives and frames often serve the purpose of “justifying or legitimizing past and future state commitments” rather than addressing the public interest (Sá, Geiger, and Hallacher Reference Sá, Geiger and Hallacher2008). Rationalized urban policy in particular has a long history (Michael Reference Michael1965). The strategy of casting social and financial challenges facing cities as technical problems of mismanagement rather than predictable outcomes of tax or industrial policy, has been used strategically to advance interventionist and managerial solutions sometimes referred to as “austerity urbanism” (Clark and Walter Reference Clark and Walter1991; Weaver Reference Weaver2017; Hackworth Reference Hackworth2019). The simultaneous rise of data-driven decision making and evidence-based policy in cities gives legitimacy to technical fixes and prioritizes metrics or standards over outcomes less amenable to immediate quantification (Kitchin, Lauriault, and McArdle Reference Kitchin, Lauriault and McArdle2015).
Explanations for the failure of policies to protect public health or promote well-being typically emphasize cognitive, technical, and administrative limitations rather than politics and power, and the cumulative effects on vulnerable communities of multiple failures are rarely considered (Dunleavy Reference Dunleavy1995; Busenberg Reference Busenberg2004; Birkland and Waterman Reference Birkland and Waterman2008). While the impulse behind rationalized policy is nominally to remove politics from the policymaking process, in practice rationalized policy prioritizes and empowers some while marginalizing and disempowering others (Hughes, Tozer, and Giest Reference Hughes, Tozer, Giest, Van Der Heijden, Bulkeley and Certoma2019). Rationalized policy poses what Ashley Nickels and Deborah Stone have called a “policy paradox,” in which rationalized policies not only fail to be politically neutral but also create new politics through the process of their development and implementation (Stone Reference Stone2011; Nickels Reference Nickels2019), even to the point of changing the relationship between elected leaders and the public (Bovens Reference Bovens2010; McConnell Reference McConnell2011, Reference McConnell2015).
Whether intentional or not, rationalized policy often shapes decisions in ways that disadvantage poor and minority communities. Ideas and attitudes about race consistently predict the scope of risk protection provided by state and local governments (Spence Reference Spence, Dilworth and Weaver2020), and lead to a framing of the problems facing urban residents not as the result of poorly designed policies but as products of “profligacy and moral decay,” or a “tax and spend mentality,” that require the steady, rational hand of the state to correct (Hackworth Reference Hackworth, Dilworth and Weaver2020; Weaver Reference Weaver2017). While there are material consequences of such marginalization (e.g., income inequality or incarceration rates), environmental hazards such as poor air and water quality are also more prevalent in poor and minority communities (Konisky and Reenock Reference Konisky and Reenock2013; Konisky Reference Konisky2009). The impacts of these hazards are exacerbated by simultaneous physical and social vulnerabilities (Morello-Frosch et al. Reference Morello-Frosch, Zuk, Jerrett, Shamasunder and Kyle2011).
While local drinking water may often be highly politically salient (e.g., Mullin Reference Mullin2009), the Flint water crisis makes clear that the policies shaping local drinking water outcomes are not designed to meaningfully account for the varied preferences or priorities of communities. As Yanna Lambrinidou (Reference Lambrinidou2018) explains, “interventions privileging expert-led technical fixes over community-led technical and structural fixes often reduce complex societal problems into narrow technical ones and result in suboptimal public health protection and limited, if any, social change.” The critical examination of policies behind the Flint water crisis that follows⸺leveraging a “policy-focused” approach to political analysis (Hacker and Pierson Reference Hacker and Pierson2014)⸺reveals the deeply political nature of safe drinking water provision in the United States. The policy tools, criteria, and standards used to measure and protect both public health and the financial health of our cities reflect the features and strategies of rationalized policy and they contribute to the continued marginalization of poor and minority communities.
Rationalized Policy and the Flint Water Crisis
This research project began in 2018 with funding from the Canadian Social Sciences and Humanities Research Council (SSHRC). The aim of the project was to identify the economic, political, and regulatory conditions that contributed to the Flint water crisis in order to determine the extent to which other U.S. and Canadian cities were vulnerable to a similar type of public health crisis. Answering these questions involved a thorough review of the published literature on the Flint water crisis and of the numerous reports, public testimonies, and news articles relevant to understanding the crisis. I also conducted thirteen semi-structured interviews with local activists, decision makers, scientists, journalists, and scholars working in or with the City of Flint during the fall and winter of 2018–2019. Interviewees were chosen based on having direct engagement with the crisis through activism, policy making, collaborative research, providing testimony, or providing media coverage. The interview questions focused on four broad themes: the causes of the water crisis; the response to the crisis; lessons from Flint’s experience for Michigan cities; and lessons for other cities in the United States and Canada.
The literature, secondary source analysis, and interviews produced a laundry list of more and less proximate causes of the Flint water crisis: poor decision making, corruption, racism, an under-resourced public sector, poor accountability mechanisms between levels of government, economic and political interests, and the challenges stemming from deindustrialization and disinvestment. However, two policies were consistently referred to as producing the decisions and conditions that precipitated and perpetuated the water crisis: the federal Safe Drinking Water Act’s (SDWA) Lead and Copper Rule (LCR) and state support for municipal financial distress via Michigan’s Local Financial Stability and Choice Act (PA 436). These policies were also referred to as evidence that other cities were similarly vulnerable to a drinking water crisis, particularly cities facing systemic and structural disinvestment.
What these two policies have in common is that they reflect fully the characteristics and consequences of rationalized policy. Both policies rationalize complex problems (safe drinking water, municipal financial distress) by providing purely technical solutions, and the weaknesses of each reinforced and magnified the harmful consequences of the other for the residents of Flint. The risk-tolerant, technology-driven LCR combined with urban austerity measures to produce one of the worst environmental disasters in U.S. history. As a poor, majority-black community, Flint was particularly vulnerable to the marginalizing effects of both policies.
PA 436: Michigan’s Local Financial Stability and Choice Act
All interviewees, and notably the governor-appointed Michigan Civil Rights Commission (Michigan Civil Rights Commission 2017), emphasized the role played by Michigan’s Local Financial Stability and Choice Act (PA 436) in producing and extending the Flint water crisis. The two primary aims of PA 436 are to “safeguard and assure the financial accountability of local units of government and school districts” and “preserve the capacity of local units of government and school districts to provide or cause to be provided necessary services essential to the public health, safety, and welfare.” The policy, developed and championed by former governor Rick Snyder, places cities deemed by the state to be experiencing fiscal distress under the control of a state-appointed Emergency Manager. Michigan’s PA 436 grants both broad powers and legal immunity to Emergency Mangers, with the goal of balancing city budgets by renegotiating contracts, laying off staff, cutting wages and benefits, and privatizing services (Wang, Crosby, and Casey-Dunn Reference Wang, Crosby and Casey-Dunn2016).
The harmful effects of the techno-rational approach to municipal financial distress embedded in PA 436 are well documented. While many states have policies in place for addressing municipal fiscal distress, Michigan’s PA 436 is unique in its emphasis on local financial mismanagement and its lack of any accompanying state financial support for distressed municipalities (Sapotichne et al. Reference Sapotichne, Rosebrook, Scorsone, Kaminski, Doidge and Taylor2015). The sweeping powers of the Emergency Manager and mandate to balance the budget by any means necessary create new decision-making contexts in Michigan cities, “wherein political struggles over conflicting values are often obscured by a discourse of rational decision making, short-term fiscal stability is pitted against local democracy, and new-liberal market solutions are valued over democratic principles of participation and deliberation” (Nickels Reference Nickels2019, 8). Emergency managers were presented as “technocratic ‘financial experts’ who brought hard-nosed no nonsense solutions to public policy with problem-solving skills fine-tuned in the corporate world of law or finance” (Stanley Reference Stanley2016, 2). The implementation of PA 436 has primarily targeted majority-black cities in the state, which has also been tied to its rationalization of municipal financial distress. As Louise Seamster writes, “the ideological framing of emergency management as ‘neutral,’ and Black politics as ‘corrupt’ or ‘self-interested,’ provides the logic to blame Black governance for structural disinvestment and White-led extraction” (Seamster Reference Seamster2018a).
The link between emergency management under PA 436 and the Flint water crisis is also well established by scholars (see Pauli Reference Pauli2019; Nickels Reference Nickels2019; Fasenfest Reference Fasenfest2019; Stanley Reference Stanley2016) and activists. There has been significant political opposition to PA 436 in Flint, including local organizing that led to a recall effort for former Governor Snyder, a successful direct ballot repeal of PA 4, and legal challenges in state and federal courts. At least one community organization, the Flint Democracy Defense League, emerged in direct opposition to Public Act 4 and then Public Act 436,Footnote 1 and has been effective in helping to destabilize the long-term policy effects of emergency management in Flint (Nickels, Clark, and Wood Reference Nickels, Clark and Wood2019). The rationalization of Flint’s financial distress by elected and appointed leaders in Michigan, and the subsequent prioritization of financial risk to the state and creditors over health risks of city residents, led to decisions that ultimately proved lethal.
Flint first came under emergency management in 2011 through the predecessor to PA 436 (Michigan Public Act 4) and then in 2012 through the provisions of PA 436. Flint’s emergency managers made or forced decisions about the city’s water supplies and treatment protocols against the wishes of City Council, residents, and city staff (Anderson Reference Anderson2011; Pauli Reference Pauli2019). These decisions were ostensibly made in service to the goal of reducing costs for the city and resulted in thousands of residents being exposed to elevated lead levels and the deadly Legionella virus. For example, as late as January 2015, the Detroit regional water system (the city of Flint’s previous, safe source of drinking water) offered Flint a deal to reconnect to the regional water system that was rejected by then-Emergency Manager Jerry Ambrose as being too expensive. In the legal challenge to the policy’s constitutionality, plaintiffs argued that “the lead-poisoning of the Flint water supply . . . exemplifies the gross failures of PA 4 and PA 436 to actually solve the problems they are purportedly designed to address” (Guyette Reference Guyette2016). In his written testimony submitted to the Michigan Civil Rights Commission hearings on the Flint water crisis, law professor Peter Hammer writes that, “Flint residents had knowledge of the water crisis almost immediately upon the switch to the Flint River, but they lacked the power to influence the decision making of the Emergency Managers, Treasury, DEQ or the Governor” (Hammer Reference Hammer2016). One interviewee pointed out that, “no community that governs itself would choose to do this.”Footnote 2
The shortcomings, or perhaps political purposes, of PA 436 are evident in its failing to achieve its purported aim of preserving the city of Flint’s capacity to provide essential services, which include safe drinking water. While the decisions made by emergency managers in Flint between 2011 and 2015 may have addressed some short-term budget shortfalls, the policy fails to address the larger context of the city’s financial distress. Despite significant reductions in city spending, including deep cuts to city services and pension funds, Flint was only able to end emergency management with the help of a $7 million loan from the state. The city continues to operate at half the administrative capacity it had in 2000 (Reckhow, Downey, and Sapotichne Reference Reckhow, Downey and Sapotichne2018) and is rated as one of the worst run cities in the United States (McCann Reference McCann2019). The experience of the Flint water crisis and the perception of government accountability has led to demonstrably reduced trust in government among city residents (Morckel and Terzano Reference Morckel and Terzano2018).
As one interviewee described Public Act 436, it is “an accounting solution to a structural problem.”Footnote 3 In addition to any contemporary issues of budgetary mismanagement, Flint’s financial troubles are the product of historical and structural economic disinvestment, loss of manufacturing jobs, and steep decline in population (Highsmith Reference Highsmith2015). The loss of wealth and industry in the city was coupled with a loss of state revenue sharing. From 2002–2012 Michigan was the only state in the United States where revenue sharing to cities fell, a trend that has resulted in a loss of over $100 million for Flint (Michigan Municipal League 2017). Prior to PA 436 being passed in 2012, the state had also initiated stringent limitations on local revenue tools. Michigan’s combination of revenue and expenditure pressures on local governments “have structured local fiscal policymaking in a way that effectively incubates financial distress” (Sapotichne et al. Reference Sapotichne, Rosebrook, Scorsone, Kaminski, Doidge and Taylor2015). Interviewees, scholars, and observers posit that the true aim of PA 436 is to protect bondholders who would be harmed by municipal bankruptcy (e.g., Fasenfest Reference Fasenfest2019) rather than ensuring continued and high-quality public service delivery for city residents.
LCR: The Federal Safe Drinking Water Act’s Lead and Copper Rule
The development and implementation of safe drinking water standards through the federal Lead and Copper Rule under the Safe Drinking Water Act (SDWA) was seen by most (nine of thirteen) interviewees as a cause of the Flint water crisis, and was the target of blame of Governor Snyder and others in state government, including the governor-appointed Flint Water Advisory Task Force (Flint Water Advisory Task Force 2016).
The goal of the SDWA is to “protect public water supplies from harmful contaminants,” a goal that was clearly not met in the Flint case. Passed in 1974, the SDWA, and specifically the Lead and Copper Rule (LCR), provides two important sets of criteria: water quality standards and treatment and testing protocols for lead and copper in drinking water systems. The enforcement of these standards relies on a decentralized monitoring and reporting system. The SDWA requires that local water utilities monitor and test their water supplies and report their results to the state government. State agencies review these reports and do their own testing and monitoring and are then required to report all data to the U.S. Environmental Protection Agency (EPA). Actions can be taken at the state and federal levels to address noncompliance, but the federal EPA is ultimately responsible for ensuring compliance with the SDWA.
There is clear evidence that officials at the federal, state, and local levels failed to comply with many of the requirements of the LCR related to water sampling protocols, corrosion control requirements, and public notification. Federal standards for lead in drinking water are 15 parts per billion (ppb); lead levels of up to 1,000 ppb were detected in Flint homes during the water crisis but enforcement actions were not triggered: “the EPA was largely inactive in the distribution of fines and penalties throughout the years of contaminated water” (Sokolow Reference Sokolow2017). When Flint switched its drinking water source to the Flint River in April 2014, the Michigan Department of Environmental Quality failed to require that the city treat the water with anti-corrosive materials as would be necessary to meet SDWA standards (Pieper, Tang, and Edwards Reference Pieper, Tang and Edwards2017). At the local level, officials in Flint were themselves resistant to changing water treatment protocols despite mounting evidence of water contamination because of the costs implied.
By at least January 2015, the EPA was made aware of inadequate water treatment protocols in the city. A whistle blower within the EPA Region IV office attempted to bring the lack of anti-corrosives in Flint’s water to his superior’s attention (after being alerted to the fact by local water activists) and his concerns were dismissed (Clark Reference Clark2018). Throughout the summer of 2015 city, state, and federal officials insisted Flint’s drinking water was safe. By September of 2015, expert analyses conducted by Hurley Hospital and Virginia Tech University researchers confirmed lead exposure levels were significantly beyond federal limits as a result of the city failing to follow required anti-corrosive measures during water treatment. In October of 2015 the National Resources Defense Council filed a formal petition with the EPA to intervene in Flint; the EPA responded in December saying that Michigan and Flint were taking steps to improve the situation and a response from the EPA wasn’t necessary (Wilson Reference Wilson2019).
The failure of the LCR and its implementation at federal, state, and local levels has eroded trust in government among Flint residents and leaders.Footnote 4 The EPA has declared the city’s water safe to drink, but many in the city⸺including former Mayor Karen Weaver⸺do not trust this information and continue to use in-home filters and bottled water (Pinchin Reference Pinchin2019). According to both personal interviews and statements made by the former mayor, many Flint residents will only trust the drinking water after a full pipe replacement for the city. One resident says, “I do not trust the water and . . . I probably will never trust the water again. I’ve lost all trust in our government⸺federal, state, I have lost trust in everyone” (Taylor Reference Taylor2018). The government is no longer a trusted source of public health and safety for many Flint residents.
The fact that such systemic and prolonged non-compliance, and clear evidence of a threat to public health, failed to trigger regulatory action by the EPA calls into question the adequacy of public protections embedded in the SDWA and LCR. Closer examination reveals that in much the same way that PA 436 is a rationalized approach to municipal financial distress, the SDWA and LCR are rationalized approaches to protecting public health. The provisions and standards in the LCR create a policy environment that facilitates decision-making that is reactionary, prioritizes cost-effectiveness, excludes the public, and tolerates risk. The LCR has “no enforceable health-based standard”: the action level of 15 parts per billion is a screening tool and reflects detection technologies and cost effectiveness of lead removal treatments rather than any discernible threshold of risk or health impacts (Katner et al. Reference Katner, Pieper, Lambrinidou, Brown, Hu, Mielke and Edwards2016). The LCR does not protect any individual or household from exposure to elevated lead levels, as corrective action is not triggered until more than 10% of the sampled service area is affected. In reality there is no safe level of exposure to lead.
A central issue is that the LCR standards and protocols and their implementation are guided by risk-minimization and compliance goals for drinking water utilities rather than a commitment to ensuring safe drinking water for all people. As a result, utilities have often had an outsized influence on the drinking water standards and reporting requirements. The standards set in the LCR rely on self-directed representative and regular testing and monitoring with minimum requirements. The LCR requires utilities to provide only 100 drinking water samples per year, and in some cases as few as 50 samples every three years, with no requirement or expectation that utilities sample in high-risk areas. In Flint’s case, state and local officials would often flush people’s taps before testing lead levels, increasing the chance that lead levels were below the federal threshold, a practice that is allowed under the LCR despite it being problematic from a public health perspective. The city also developed sampling strategies that neglected neighborhoods and households most likely to have elevated lead levels in their drinking water, a practice that is also allowed under the LCR. Information that is collected about water lead levels is not readily available to residents, “which robs communities of basic information they would need to protect themselves, participate in technical discussions, advocate for effective solutions, and hold accountable wrongdoers and harm doers” (Lambrinidou Reference Lambrinidou2018).
The Flint case reveals the extent to which both the standards and protocols of the LCR, and the implementation environment that has developed around them, reflect a rationalized approach to public health protections that minimizes public concerns in favor of technical and economic considerations. The rationalization of public health protections in the LCR leaves poor and marginalized communities like Flint particularly vulnerable. Each year the EPA issues, on average, nearly fifty violations related to the LCR (Allaire, Wu, and Lall Reference Allaire, Wu and Lall2018), but failed to do so in response to mounting evidence of water contamination in Flint. In e-mails made public after the Flint water crisis, EPA Region 5 Water Division Branch Chief Debbie Baltazar wrote in September of 2015 that “I’m not so sure Flint is the community we want to go out on a limb for” (Libby 2016).
The Flint Water Crisis in National Context
Flint is not the first, nor the last, U.S. city to have contaminated drinking water left unaddressed. From 2001–2004 drinking water lead levels in Washington, DC, were elevated as a result of new treatment protocols (Edwards, Triantafyllidou, and Best Reference Edwards, Triantafyllidou and Best2009), but these levels were not acted upon by the city officials or the EPA until residents, the Washington Post, and an outside whistleblower exposed the problem (Roy and Edwards Reference Roy and Edwards2019). New evidence indicates officials in Newark, New Jersey⸺where the city is currently working to address elevated lead levels in the drinking water⸺were made aware of problems with the water disinfection practices there as early as 2014 (Yi Reference Yi2019). However, the problems were never significant enough to trigger strong state or federal intervention. Many cities have found elevated lead levels in drinking water in schools (Sathyanarayana et al. Reference Sathyanarayana, Beaudet, Omri and Karr2006), but the LCR does not require water testing in schools and therefore does not have response protocols in place. As lead contamination has gained a greater national profile, it is increasingly clear that testing for lead in homes and schools is not a regular practice in most cities or required by most states.
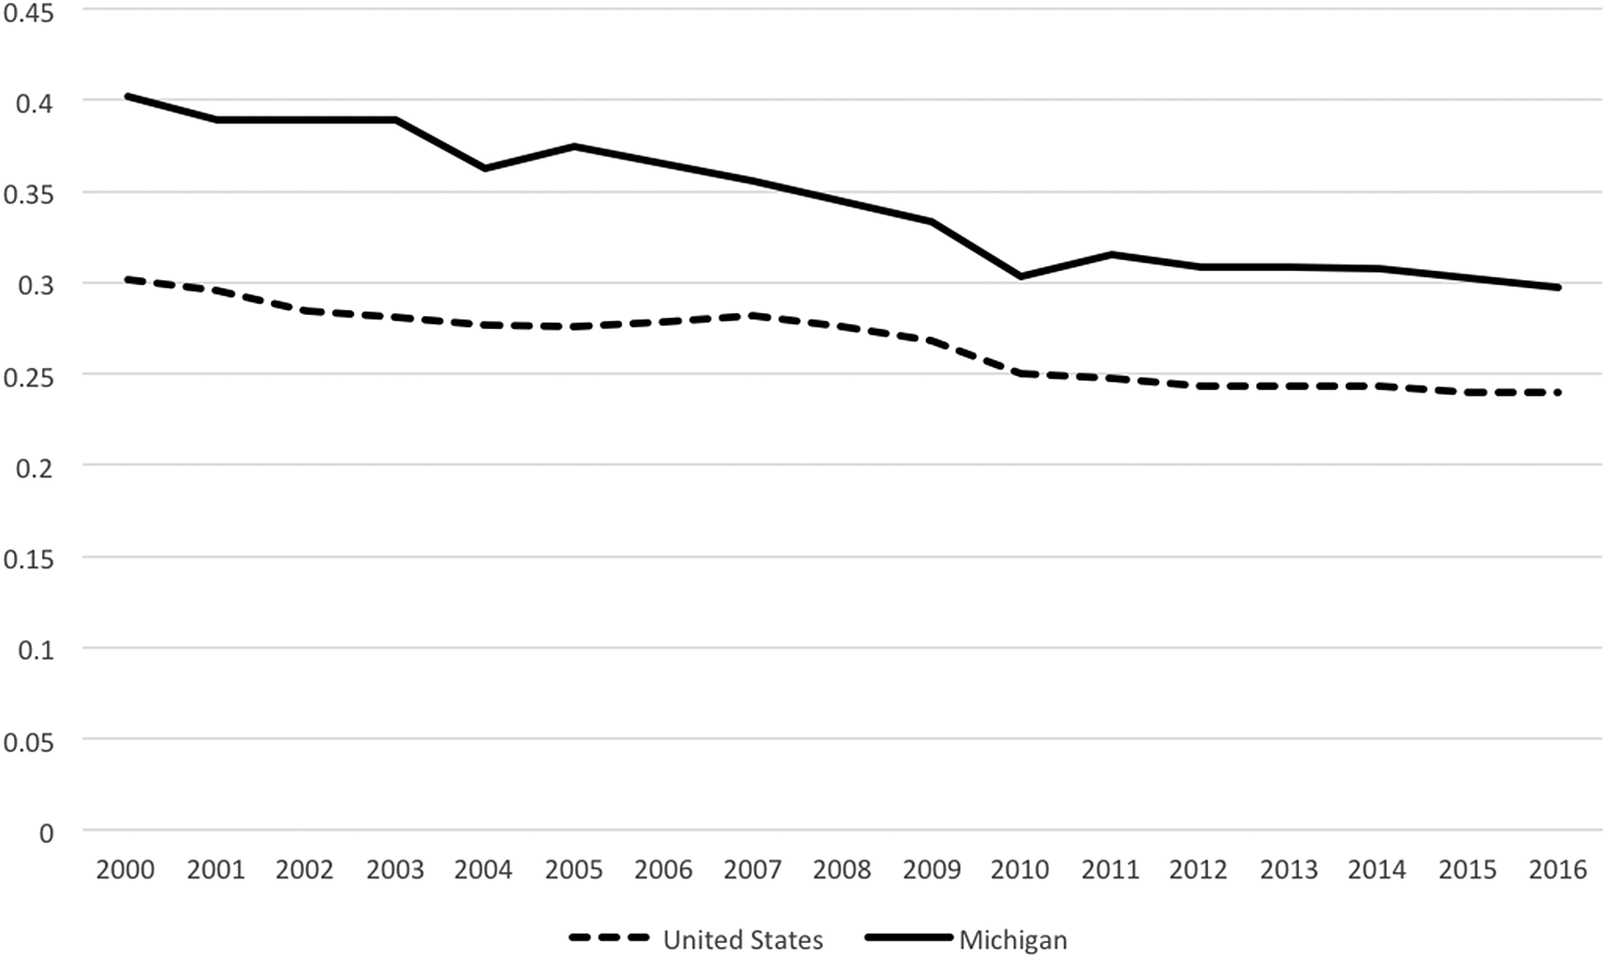
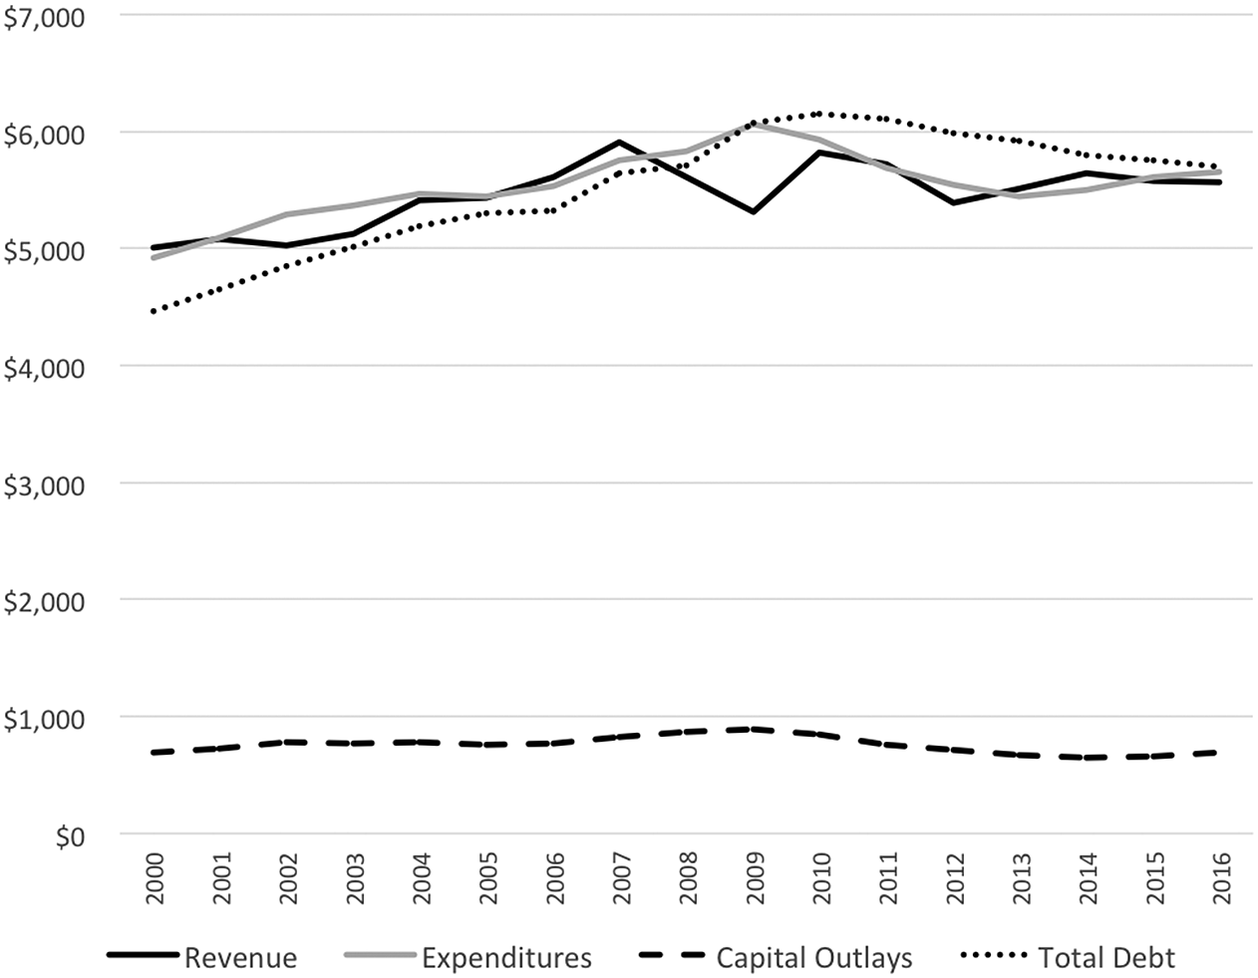
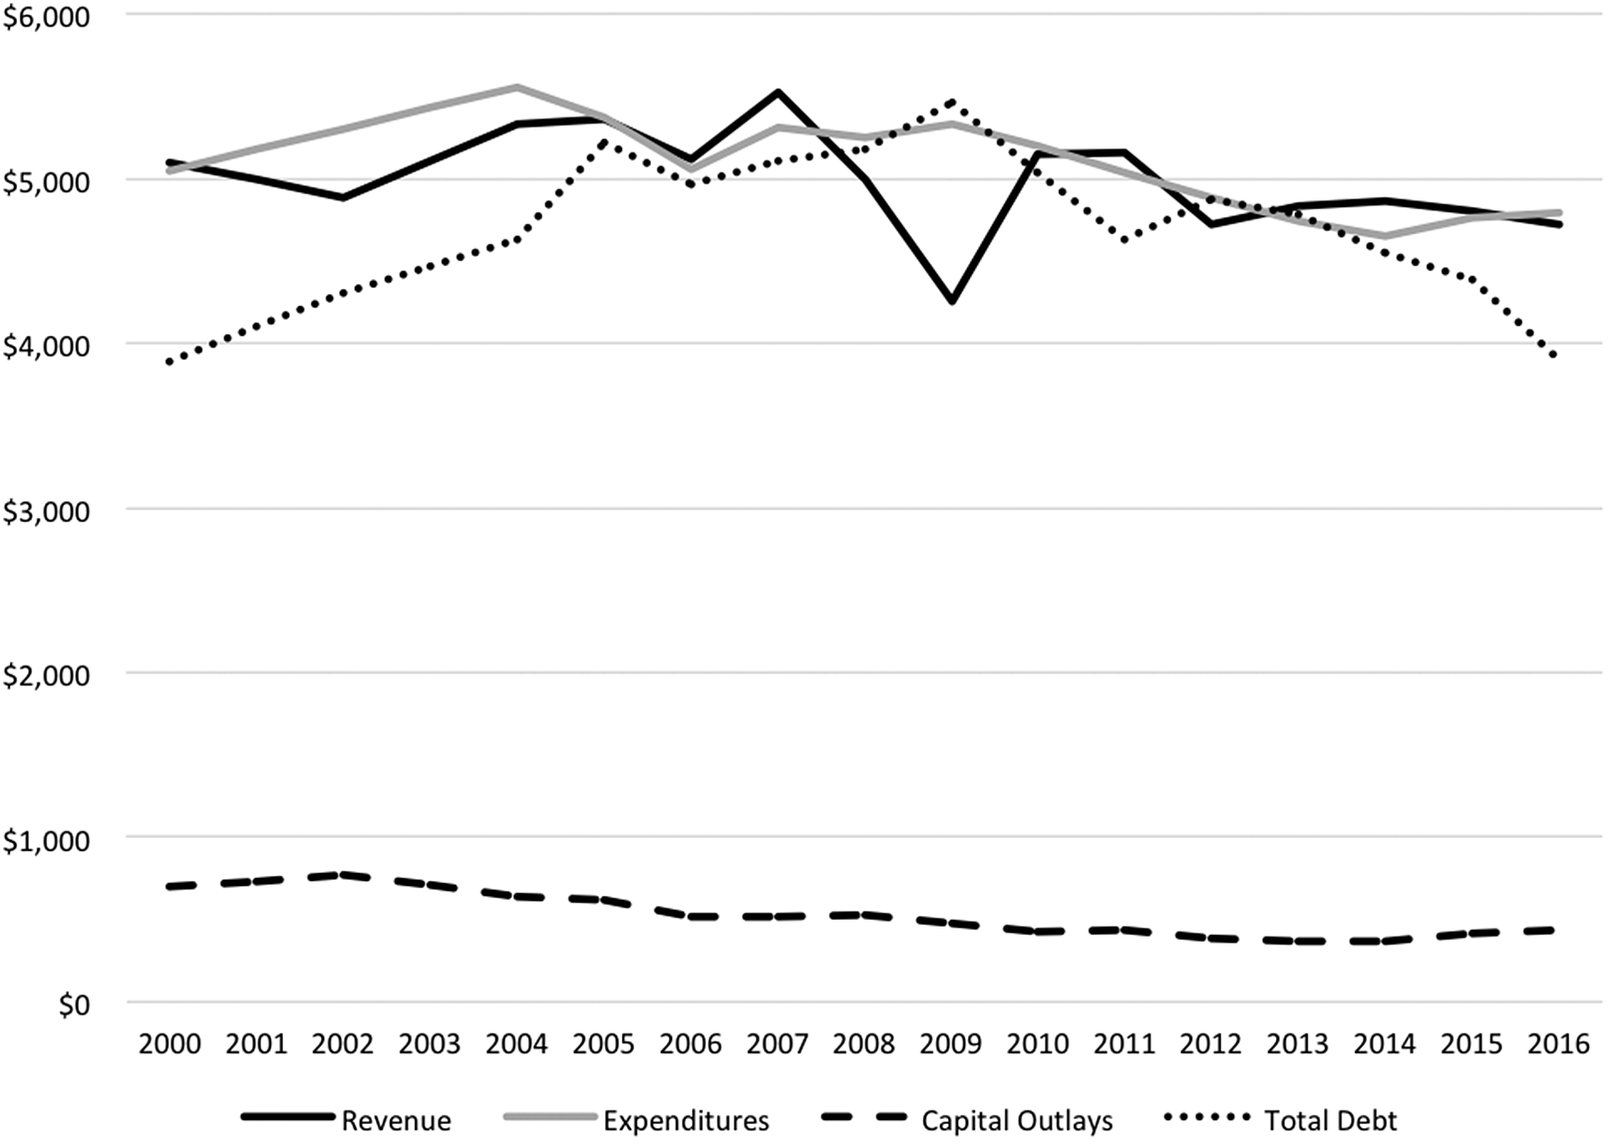
Flint is also not the first, nor the last, U.S. city to experience significant financial distress. Throughout the United States local governments are facing declining revenue, increasing service demands and responsibilities, and growing legacy costs. Local governments in the United States have seen a steady and accelerating decline in tax revenues and spending across service areas since the 2007 economic recession (Chernick and Reschovsky Reference Chernick and Reschovsky2017). State revenue sharing with local governments has declined steadily from around one-third of all state expenditures in 1977 to less than one-quarter in 2016, despite steadily increasing total expenditures and overall growth in revenue (figure 1). These revenue challenges have been supplemented by additional debt and privatization of public services. Capital investments have slowly declined nationally, and more rapidly for Michigan cities (figures 2 and 3).
Per capita intergovernmental spending as a proportion of total spending for U.S. state governments and Michigan state government between 2000 and 2016 in real 2016 dollars.
Note: Both nationally and in Michigan revenue sharing with local governments has been steadily declining. Source: U.S. Census Bureau.

Per capita total revenue, total spending, total capital outlays, and total debt levels for all U.S. local governments between 2000 and 2016 in real 2016 dollars.
Note: Increasing debt levels have compensated for declining revenue, and capital investment is declining. Source: U.S. Census Bureau.

Per capita total revenue, total spending, total capital outlays, and total debt levels for all Michigan local governments between 2000 and 2016 in real 2016 dollars.
Note: Here too debt has compensated for declining revenue, and per capita capital investment is declining. Source: U.S. Census Bureau.

The financial strain on U.S. city governments is felt acutely in the drinking water sector. State and federal governments have historically been a primary source of financial investment for municipal water systems but spending at both levels is declining. States report an average of $11 billion in water infrastructure needs, with a high of $50 billion in California (U.S. EPA 2018). According to U.S. EPA figures, federal funding through the State Drinking Water Revolving Fund has hovered around $3 per capita since 1998, and total capitalization grants have declined (Mullin and Daley Reference Mullin and Daley2018), even as drinking water requirements have become more stringent (Allaire, Wu, and Lall Reference Allaire, Wu and Lall2018). A lack of financial resources is already viewed as a threat to the Safe Drinking Water Act (Weinmeyer et al. Reference Weinmeyer, Norling, Kawarski and Higgins2017); without addressing this gap, any changes that are made to the LCR will continue to be met with resistance or face implementation challenges. And unlike other areas of urban development and infrastructure (Sampson Reference Sampson2017; Reckhow, Downey, and Sapotichne Reference Reckhow, Downey and Sapotichne2018), drinking water is not a service that can be supported easily by nonprofits.
A number of states have policies in place that mirror Michigan’s PA 436, allowing states to intervene or take over when cities are in financial distress (Sapotichne et al. Reference Sapotichne, Rosebrook, Scorsone, Kaminski, Doidge and Taylor2015). Sixteen states have passed general legislation for state intervention, using a range of institutional arrangements and tools including taxes and labor agreements; three states (Michigan, Nevada, and Tennessee) allow for the dissolution of the local government (Nickels Reference Nickels2019). Such approaches to municipal financial distress have garnered the label of “austerity urbanism” as a way of capturing the range of forces that are constraining the financial capacities and policy options of U.S. city governments (Peck Reference Peck2012; Davidson and Ward Reference Davidson and Ward2014). State intervention in municipalities can have long-lasting social and political effects (Nickels, Clark, and Wood Reference Nickels, Clark and Wood2019).
Flint’s experience highlights the devastating consequences of simultaneous and reinforcing exposure to multiple forms and sources of rationalized policy. It also serves as a reminder that such exposure is borne disproportionately by poor and minority communities in the United States. These communities consistently receive lower-quality drinking water, and lead contamination cases fit a pattern of low-income, unequal, and largely black cities (Allaire, Wu, and Lall Reference Allaire, Wu and Lall2018). Cities with high minority populations and elected leaders are also more likely to experience a loss of autonomy due to state takeovers (Morel Reference Morel2018; Seamster Reference Seamster2018b). Absent change, therefore, poor and minority cities remain vulnerable to the marginalizing effects of these multiple and reinforcing rationalized policy domains.
Learning from the Flint Water Crisis
The response to the Flint water crisis reveals the deep entrenchment of rationalization in these policy domains, and the tenuousness of the claim that this rationality serves to prioritize evidence-based decision-making and best practices.
At both the state and federal levels the primary response to the Flint water crisis has been a call to strengthen drinking water safety standards and monitoring practices. The Flint water crisis has accelerated ongoing reexamination of the standards set in the Lead and Copper Rule, both acceptable lead levels and lead testing requirements. Prior to the Flint water crisis, the EPA had been working to update the LCR, being already aware of some of the policy’s technical shortcomings. Following the Flint water crisis, the U.S. Congress held a series of hearings, intensifying the scrutiny of existing standards and prompting an emergency infusion of federal money to urban water systems through the American Recovery and Reinvestment Act and the Drinking Water State Revolving Fund. Scholars also focused on revisions to the Lead and Copper Rule after the Flint water crisis, calling for improved risk management and health protections (Gostin Reference Gostin2016; Baum, Bartram, and Hrudey Reference Baum, Bartram and Hrudey2016; Butler, Scammell, and Benson Reference Butler, Scammell and Benson2016).
However, changes are slow in coming and likely to be modest. In 2016 the EPA issued a memorandum encouraging state and local drinking water agencies to implement more protective sampling and monitoring procedures. More recently, the EPA has submitted proposed LCR revisions to the Office of Management and Budget that are expected to take effect in the summer of 2020. Environmental and public health advocates hoped the EPA would require lead pipe replacements, but the most likely outcome is a requirement that water utilities inventory their lead pipes and make those inventories public.
The proposed changes do not address disparities in exposure to lead, or challenges to enforcing even the current lead in water standards. The lead pipe inventory gives “wealthy people incentive to replace their lead lines while continuing to ignore those who can’t afford to remove lead pipes and are most vulnerable to exposure to lead in water” (Betanzo Reference Betanzo2019). Even current regulations aren’t enforced: “nine out of ten violations of the SDWA are not subject to disciplinary or corrective action” (Weinmeyer et al. Reference Weinmeyer, Norling, Kawarski and Higgins2017). Water utilities have consistently and effectively pushed back against reforms to the LCR that would introduce new testing and monitoring standards or service line replacement requirements, with the National Drinking Water Advisory Council urging that “the LCR should remain a treatment technique rule” (Keegan Reference Keegan2018).
There have been subnational efforts to reduce lead exposure and improve monitoring standards. Since 2016, more than 100 U.S. cities have publicly committed to eliminating lead service lines in their jurisdiction, and 16 states now have policies in place to support such initiatives.Footnote 5 In 2018, the state of Michigan passed its own set of stricter standards for lead in drinking water, requiring more comprehensive testing procedures, shifting to a lower 12 ppb standard, and requiring that communities replace 5% of lead service lines on an annual basis. Within the drinking water professional community, there has been a shift toward foregrounding inequality and community engagement through initiatives such as the Water Equity Taskforce and a first-ever water affordability policy statement from the American Water Works Association.
In response to the proposed changes, the state of Michigan was (unsuccessfully) sued by a Detroit-led coalition of water utilities who see the new standards as an unfunded mandate from the state. This action brings into stark relief the political tensions inherent in strengthening public health protections in drinking water standards, but also reveals the inextricable link between safe drinking water and the financial health of cities and water utilities. Ensuring safe drinking water requires learning not just from the failures of the LCR, but also from the concurrent failure of PA 436 to address municipal financial distress. New water quality standards and lead service line replacement targets require financially stable and democratically robust local governments for political support and implementation.
The Flint Water Advisory Task Force, a Governor-appointed task force assembled by Snyder in 2016, identified a lack of accountability as central to the Flint water crisis, and recommended the state “review Michigan’s Emergency Manager Law (PA 436) and its implementation, and identify measures to compensate for the loss of the checks and balances that are provided by representative government” (Flint Water Advisory Task Force 2016). When running for office in 2018, Michigan governor Gretchen Whitmer promised to repeal the law, though this issue was not central in the gubernatorial election.Footnote 6 However, unlike the Lead and Copper Rule, there has been no serious effort to repeal or amend PA 436 or address the broader structural challenges facing Michigan cities.
State leaders have focused on the individual decisions behind the Flint water crisis, seeking to blame bad actors rather than any systemic or policy-driven failures of governance. In 2016, then-attorney General Schuette claimed “the crisis in Flint was a casualty of arrogance, disdain, and a failure of management” (Jackman Reference Jackman2016). This is in many ways true. Accountability is critical, and civil and criminal charges have been filed against state and local decision makers in an effort to ensure justice for Flint residents. While these are important steps, they do not address the marginalizing consequences of rationalized policy domains that facilitated or allowed such decisions in the first place.
Moving Forward
The Flint water crisis was the result of a confluence of factors, operating at multiple scales in time and space. Understanding the role specifically played by policy provides an opportunity to think more critically about why existing policy failed to protect public health and the lessons this offers for policy reform in Michigan and beyond. I’ve argued here that the Flint water crisis reveals the marginalizing effects of rationalized policy, and particularly the ways in which such policies interact and reinforce one another. Safe drinking water policy driven by risk thresholds and compliance regimes, and municipal financial distress policy that prioritizes credit ratings and efficiency above public welfare are framed as technically derived and politically neutral, but have significant distributive and marginalizing consequences. Flint’s experience highlights long-understood weaknesses of the Safe Drinking Water Act and demonstrates the consequences of pairing these weaknesses with cities under fiscal austerity and weakened democracy. The results should challenge any assumption that stricter regulation alone will produce safer drinking water without also attending to the broader fiscal and political context of cities. The stickiness of these policies even in the face of a deadly water contamination event further underscores the fact that these approaches are not politically neutral but reflect particular interests and perspectives.
Alternatives are available. For example, a review of state policy and municipal financial distress by Joshua Sapotichne et al. (Reference Sapotichne, Rosebrook, Scorsone, Kaminski, Doidge and Taylor2015) reveals the diversity of approaches already being taken by state governments that provide opportunities to learn and adapt. In their conclusions they highlight the critical role states play in not only responding to municipal financial distress, but also preventing it in the first place, by determining local government’s ability to raise and spend taxes. Many initiatives promoting more holistic approaches to ensuring safe drinking water provision are also emerging. The Water Equity Taskforce, a network of cities supported by the US Water Alliance, is working to develop and accelerate the adoption of equitable water policies by utilities and other local and national actors.Footnote 7 The American Water Works Association, the professional association for the drinking water industry, is giving renewed attention to issues of engagement and equity. Whether and how such bottom-up initiatives can inform national drinking water standards and regulations is still to be seen.
Future research can support and enhance such efforts and provide additional insight into the construction, operation, and effects of rationalized policy on safe drinking water provision. How do the politics of policy rationalization shape and constrain policy change? Further examination of the interactive and cumulative effects of rationalized policy, particularly in the urban context, could engage scholarship on cascading failures and complex systems (Dobson et al. Reference Dobson, Carreras, Lynch and Newman2007) and may help identify critical tipping points or sources of political interaction and reinforcement in complex policy spaces like safe drinking water provision.
As alternative policy approaches emerge, testing or estimating their performance and political potential will be critical. Examining positive cases of safe drinking water provision and expanded risk protections would provide useful counterexamples to the Flint water crisis and provide an alternative set of learning opportunities. These might include cities such as Lansing, Michigan, which has successfully and proactively replaced residential lead water pipes, or Cleveland, Ohio, which has developed a series of policies and programs designed to remove lead of all kinds from people’s homes. Such cases would provide important insights about how cities mobilize to address or reduce the marginalizing effects of rationalized policy. Given the important role that city governments play in providing services critical to health and the environment, understanding and addressing these gaps should have a high priority.