I. INTRODUCTION
Wire bonding is one of the most widely used interconnect techniques to provide electrical paths for power and signal distribution between integrated circuit chips and external circuit boards. While Au wire bonding has been the workhorse for the industry since 1957, a rapid and volatile increase of Au price in recent years has triggered industry conversion from Au to Cu wire bonding material in fine pitch wire bonding in high volume production. Reference Appelt, Tseng, Chen and Lai1 Cu wire bonding is considered to provide benefits not only for cost saving but also for enhancing electrical and thermal performances. Reference Breach and Wulff2 There have been several technological concerns for implementing this technology for high volume manufacturing. They include the need of forming gas during free air ball formation, Reference Khoury, Burkhard, Galloway and Scharr3–Reference Hang, Song, Lum, Mayer, Zhou, Wang, Moon and Persic6 Al splash and dielectric damage risk underneath Al pad, Reference Shah, Mayer, Zhou, Hong and Moon7,Reference Uno, Terashima and Yamada8 long-term reliability concern under humid environments, Reference Uno, Terashima and Yamada8,Reference Kaimori, Nonaka and Mizoguchi9 and slow Cu–Al intermetallic compound (IMC) formation. Reference Khoury, Burkhard, Galloway and Scharr3,Reference Kim, Lee, Paik, Koh, Won, Choe, Lee, Moon and Park10–Reference Xu, Liu, Silberschmidt and Chen13 The formation of Cu–Al IMC is of great interest since it is directly related to the wire bonding materials and bonding process development. Extensive studies have been made to investigate the IMC growth behavior at the interface between Cu wire and Al pad metallization. Conceptually, IMC growth sites are initiated over discrete positions at the Cu–Al interface. During annealing, the IMC spreads across the entire Cu–Al interface as the IMC phase evolves into Cu-rich IMC with Cu as the dominant material present. Reference Lu, Wang, Appelt, Lai and Kao14 An early annealing study at a temperature ranging between 150 and 200 °C showed that while Cu9Al4 is the first and major IMC phase, CuAl2 showed up with an increased annealing time using a microbeam x-ray diffraction (MBXRD) technique. Reference Kim, Lee, Paik, Koh, Won, Choe, Lee, Moon and Park10 The presence of CuAl2 phase was not conclusive due to overlapping and splits of Bragg peaks. In a subsequent annealing study with annealing at 250 °C, similar were reported; Cu9Al4 and CuAl2 are the major IMC phases. Reference Hang, Wang, Mayer, Tan, Zhou and Wang15 Recent in-depth studies suggested that the Cu–Al IMC phase evolves from CuAl2 and CuAl phases to Cu9Al4 phase from an as-bonded state to an annealing temperature of 350 °C. Reference Lu, Wang, Appelt, Lai and Kao14,Reference Xu, Liu, Silberschmidt, Pramana, White and Chen16 One of them addressed the IMC growth kinetics as well. Reference Lu, Wang, Appelt, Lai and Kao14 While most of these previous works implemented qualitative techniques such as MBXRD, Reference Kim, Lee, Paik, Koh, Won, Choe, Lee, Moon and Park10,Reference Hang, Wang, Mayer, Tan, Zhou and Wang15 fast Fourier transform, Reference Xu, Liu, Silberschmidt, Pramana, White and Chen16 and scanning electron microscopy (SEM)-based energy dispersive x-ray spectroscopy (EDS), and/or electron probe microanalyzer (EPMA) for the identification of IMC phases, Reference Lu, Wang, Appelt, Lai and Kao14,Reference Yu, Chan, Chan and Hsieh17 we have recently made use of transmission electron microscopy (TEM)/nanobeam electron diffraction (NBED) techniques in combination with structure factor (SF) calculation for quantitative IMC phase analysis for wire bonds made with 20 μm Cu wire. As a result, the metastable θ′-CuAl2 phase was unambiguously verified as the majority IMC phase at the Cu/Al bond interface. Reference Bae, Jung and Du18,Reference Bae, Jung, Chen and Du19
It has been argued that Pd coating on Cu wire can provide significant benefits compared with bare Cu wire in terms of extended shelf-life of the wire and long-term wire bond reliability. However, high hardness of Pd coating causes more damage to wire drawing facility that leads to higher manufacturing costs. There has been an effort to resolve this issue with Au flash coating on Pd-coated Cu wire in a hope that Au can play a role as a lubricant in a wire drawing process. However, the effect of Au flash coating on the IMC formation at the bonding interface has not been investigated yet.
In this work, a comprehensively comparative study of IMC formation and its subsequent thermal evolution are examined for Cu/Al interfaces made by (1) Pd-coated Cu wire and (2) Pd-coated Cu wire followed by Au flash coating, using TEM/NBED and EDS in combination with SF calculation.
II. EXPERIMENTAL PROCEDURES
Cu ball bonds were made using 0.7 mil (=18 μm) Pd-coated Cu wire (hereafter, denoted as “Pd–Cu wire”) and 18 μm Pd-coated Cu wire followed by Au flash coating (hereafter, denoted as “(Au)Pd–Cu wire”). Reference Qin, Xu, Clauberg, Cathcart, Acoff, Chylak and Huynh20 Ball bonds were made on typical Al pads on the SiO2 insulation layer on a silicon die mounted on a lead frame. Molding compound was cured at 175 °C for 4 h. Some samples were further annealed at 150 °C for 1000 h for high temperature storage (HTS) test.
To identify the IMC phase present at the interface between Cu wire and Al pad, the top surface of the package was gradually polished until it barely showed the Cu ball. Then, the package was carefully polished from one side until the polished cross-section reaches ∼25 μm away from the center of the Cu wire. The final polish for SEM observation was performed using an ion cross-section polisher with a 4 kV Ar+ ion beam. The structure of the cross-sections was examined using Zeiss Supra 55 VP field emission SEM. Cross-sectional TEM samples were directly lifted-out from the cross-section polished samples using a FEI Nova 600 dual-beam focused ion beam (FIB). The energy of the Ga ion beam was gradually decreased from 20 to 5 kV to minimize ion beam induced damages. These samples were examined using 200 kV operating JEOL JEM-2100F field emission TEM equipped with scanning TEM, EDS, and electron energy loss spectroscopy (EELS) in Analytical and Diagnostics Laboratory at State University of New York at Binghamton.
III. RESULTS AND DISCUSSION
A. Free air ball (FAB) and bare wire morphology for Pd–Cu and (Au)Pd–Cu wires
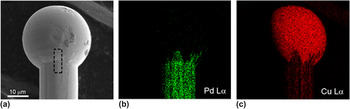
Figure 1 shows a SEM secondary electron image with EDS elemental mapping results for Pd–Cu wire. An oxidation-free FAB is formed with a diameter of ∼32 μm as shown in Fig. 1(a). Note that while Pd coating fades away as it runs from bare wire area through neck area and completely disappears inside FAB [see Fig. 1(b)], the Cu signal becomes stronger near the center of FAB [see Fig. 1(c)]. This indicates that Pd coating completely dissolves in a FAB forming process except the neck area, so that the concentration of Pd in FAB is beyond detectability of EDS.
SEM secondary electron image (a) with EDS elemental mappings for Cu (b), and Pd (c) for Pd–Cu wire.

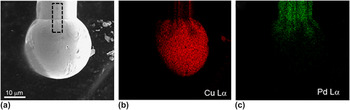
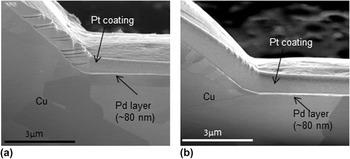
The same examination was performed for (Au)Pd–Cu wire as shown in Fig. 2. While a ∼30 μm diameter oxidation-free FAB is confirmed [see Figs. 2(a) and 2(b)] with Pd coating at the bare wire area as shown in Fig. 2(c), the Au signal was not detected by EDS. This indicates that the amount of Au incorporated as flash coating is so small that it is beyond EDS detectability. In Fig. 3 are shown vertical cross-sectional SEM images of the rectangular area marked by dotted lines in Figs. 1(a) and 2(a), respectively. In Figs. 3(a) and 3(b), the Pd coating layers of ∼80 nm are clearly visible from bare wire areas. Those coating layers disappear as it runs from neck area through FAB. Meanwhile, Au flash coating was not confirmed in Fig. 3(b) as expected from the EDS result, suggesting that the amount of Au flash coating is beyond the spatial resolution of SEM (∼4 nm). These are in good agreement with the Pd distributions found in Figs. 1(b) and 2(b). By using ∼80 nm of Pd coating on 18-μm-diameter Cu wire that is revealed above together with ∼32-μm-diameter FAB, the Pd concentration in the FAB is calculated to be ∼1.8 vol%. Note that the Pd coating was not completely dissolved in FAB near neck area [see Figs. 1(b) and 2(b)]. Thus, the real Pd concentration in FAB is speculated to be lower than 1.8 vol%. The very low Pd concentration is considered to be associated with no Pd signal detected with EDS in the most of the FAB areas for both Pd- and (Au)/Pd-coated Cu wires.
SEM secondary electron image (a) with EDS elemental mappings for Cu (b), and Pd (c) for (Au)Pd–Cu wire.

Cross-sectional SEM images for Pd–Cu (a) and (Au)Pd–Cu wires (b).

B. Cross-sectional SEM examination of wire bond made with Pd–Cu and (Au)Pd–Cu wires before HTS
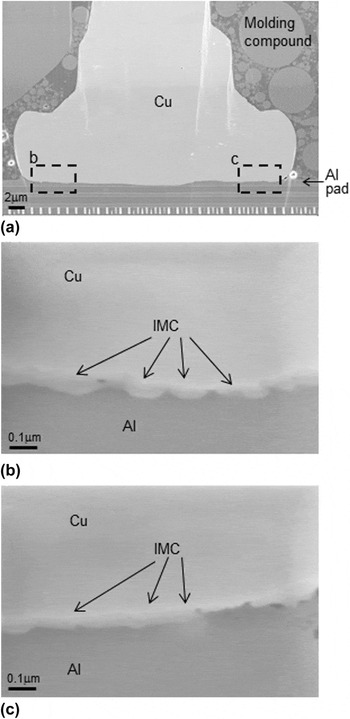
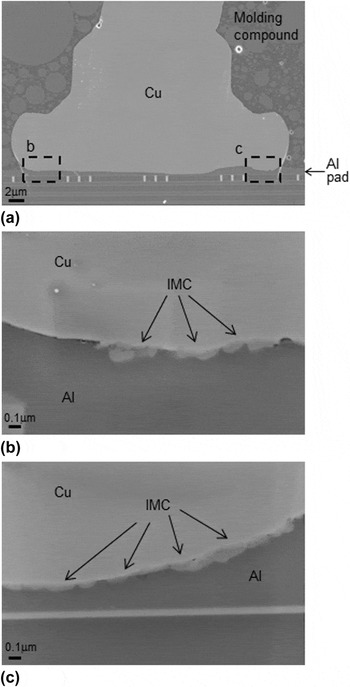
Figure 4(a) shows a typical cross-sectional SEM secondary electron image that shows an entire wire bond interface made with Pd–Cu wire before HTS. Note that bonding between Pd–Cu ball and Al is well-established without no significant Al splash or cracks/voids. To acquire more detailed information, the areas denoted as b and c are enlarged as shown in Figs. 4(b) and 4(c), respectively. In both of the images, IMCs can be clearly observed between Cu ball and Al pad with their thickness varying from 40 to 80 nm. In Fig. 5(a) is shown a typical cross-sectional SEM secondary electron image of an entire wire bond made with (Au)Pd–Cu wire before HTS. The well-established bond can be readily confirmed with no significant Al splash or cracks/voids. Enlarged images obtained from the areas denoted as b and c are displayed in Figs. 5(b) and 5(c), respectively. They clearly show IMC formation between Cu ball and Al pad with its thickness ranging from 30 to 80 nm. Based on Figs. 4 and 5, it is found that there is no significant difference in wire bond interface structures between Pd–Cu and (Au)Pd–Cu wires in terms of IMC morphology and thickness.
Cross-sectional SEM images for Pd–Cu wire before HTS test, showing an overall view (a) with Cu/Al interface areas (b), and (c).

Cross-sectional SEM images for (Au)Pd–Cu wire before HTS test, showing an overall view (a) with Cu/Al interface areas (b), and (c).

C. Cross-sectional SEM examination of wire bonds made with Pd–Cu and (Au)Pd–Cu wires after HTS at 150 °C for 1000 h
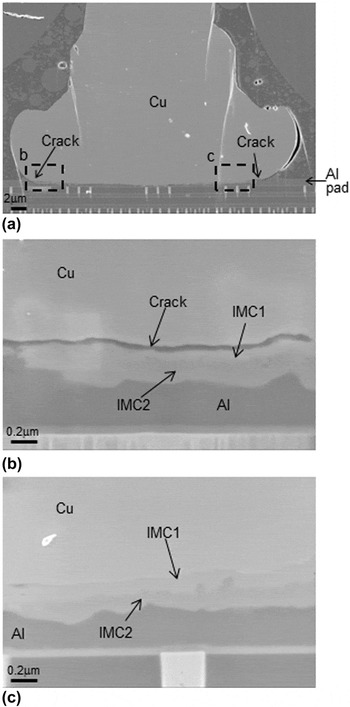
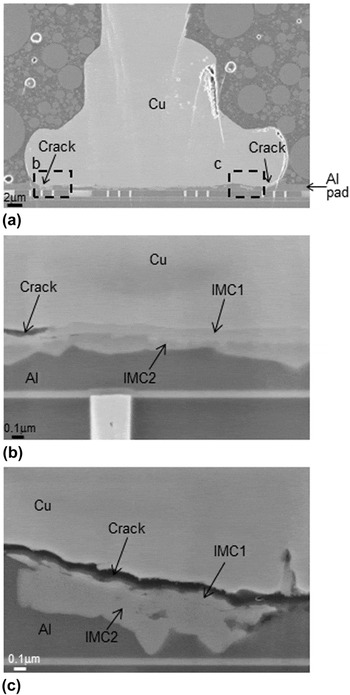
In Fig. 6(a) is shown a typical cross-sectional SEM image of an entire wire bond made with Pd–Cu wire after HTS. It can be readily noticed that IMC at Cu/Al interface grows in size up to ∼450 nm as a result of thermal annealing. Another thing worth to notice is crack development at the periphery of the wire bond interface as denoted by arrows. For more detailed observation, the Cu/Al interface areas marked by b and c are enlarged in Figs. 6(b) and 6(c). Unlike “before HTS” sample, two distinctive IMC layers (denoted as IMC1 and IMC2) can be clearly observed particularly in Figs. 6(b) and 6(c). It may be worth to note that a crack is found to develop between Cu and IMC1 as shown in Fig. 6(a). Figure 7 shows a typical cross-sectional SEM image of an entire wire bond made with (Au)Pd–Cu wire after HTS. As a result of thermal annealing, IMC at the Cu/Al interface grows in size up to ∼400 nm. Crack develops at the periphery of wire bond interface as marked by arrows in Fig. 7(a). Enlarged images obtained from the areas denoted as b and c are exhibited in Figs. 7(b) and 7(c), respectively. Similar to Pd–Cu wire, two distinctive IMC layers (denoted as IMC1 and IMC2) can be clearly observed especially in Figs. 7(b) and 7(c). Crack developments are also found between Cu ball and IMC1 layer at the periphery of wire bond as shown in Figs. 7(b) and 7(c).
Cross-sectional SEM images for Pd–Cu wire after HTS test at 150 °C for 1000 h, which show an overall view (a) and Cu/Al interface areas (b), and (c).

Cross-sectional SEM images for (Au)Pd–Cu wire after HTS test at 150 °C for 1000 h, which show an overall view (a) and Cu/Al interface areas (b), and (c).

D. Cross-sectional TEM examination of wire bonds made with Pd–Cu and (Au)Pd–Cu wires before HTS
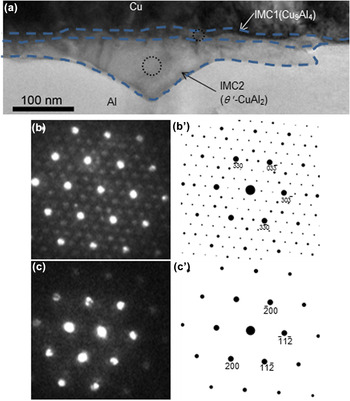
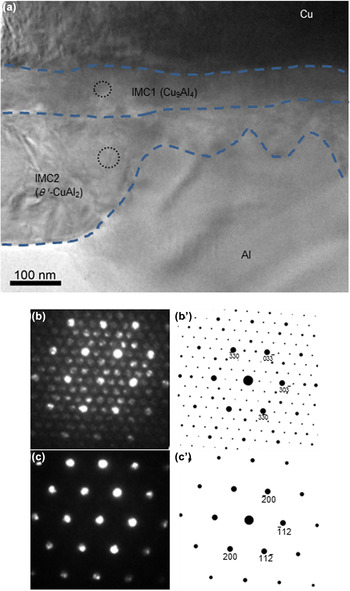
To understand the phases and crystalline structures of the IMC found before HTS as shown in Figs. 4 and 5, cross-sectional TEM examination was performed as shown in Figs. 8 and 9. A cross-sectional bright-field (BF) TEM image obtained from Pd–Cu wire bond [see Fig. 8(a)] clearly shows an IMC layer of ∼65 nm (denoted as IMC2) with irregularly shaped growth front toward Al pad. This corresponds to the IMC found in Fig. 4. It is worth noting that there exists another thin IMC layer of ∼15 nm (denoted as IMC1) located between IMC2 and Cu. Since FIB prepared TEM sample is expected to have rather smooth and homogeneous thickness distribution across its entire electron transparent area, the distinctively darker contrast of IMC1 than that of IMC2 indicates that the chemical composition of the IMC1 layer may be different from IMC2. To elucidate the crystal phases for IMC1 and IMC2, NBED patterns were acquired from the encircled areas of IMC1 and IMC2 in Fig. 8(a) as shown in Figs. 8(b) and 8(c), respectively. Bragg reflections in the NBED patterns are carefully calibrated to obtain precise lattice spacing values using undistorted single crystalline sapphire material (a = 0.4753 nm, c = 1.298 nm) as a reference. The SF, F hkl , where hkl represents a specific Bragg reflection, was calculated for all of the known Cu–Al IMC phases, such as θ-CuAl2 (tetragonal, space group: I4/mcm, a = 0.5949 nm, c = 0.4821 nm), CuAl2 (orthorhombic, space group: F/mmm, a = 0.848 nm, b = 0.859 nm, c = 0.496 nm), θ′-CuAl2 (tetragonal, space group: I–4m2, a = 0.404 nm, b = 0.404 nm, c = 0.580 nm), CuAl (monoclinic, space group: C2/m, a = 0.9822 nm, b = 0.4061 nm, c = 0.6807 nm), Cu9Al4 (cubic, space group: P–43m, a = 0.8704 nm), and Cu1.7Al (hexagonal, space group: P63/mmc, a = 0.4146 nm, c = 0.5063 nm). The calculation of the electron diffraction patterns was based on the kinematical approximation:
 $${F_{hkl}} = \mathop\sum\limits_n \,{{f_n}\exp \left[ {2\pi i\left( {h{x_n} + k{y_n} + l{z_n}} \right)} \right]} \quad {\rm{,}}$$
where f
n
is the atomic scattering factor for atom n at fractional coordinates (x
n
,y
n
,z
n
). Among the calculation results for various zone axes of the Cu–Al IMC phases listed above, the net patterns of
 $[\bar 120]$
from Cu9Al4 and [112] from θ′-CuAl2 are shown in Figs. 8(b′) and 8(c′). They match well with Figs. 8(b) and 8(c), respectively. Note that the extra intensity maxima (i.e., forbidden Bragg's reflection) denoted by white arrows in Fig. 8(b) are attributed to double diffraction that is commonly observed in transmission electron diffraction patterns.
Reference Williams and Carter21,Reference Bae, Vasekar, VanHart and Dhakal22
This indicates that there exist two IMC phases between Cu and Al pad: (1) Cu-rich Cu9Al4 (= IMC1) located adjacent to Cu ball and (2) Al-rich θ′-CuAl2 (= IMC2) located adjacent to Al pad. To verify the NBED and SF calculation results, nanobeam EDS was also performed to the same encircled areas and revealed that the Cu:Al ratios are 38:62 and 67:33, which correspond to the compositions of θ′-CuAl2 and Cu9Al4, respectively. Both the NBED and nanobeam EDS results unambiguously confirm the formation of two different IMC layers, i.e., Cu9Al4 (ΙΜC1) and θ′-CuAl2 (IMC2), between Cu ball and Al pad.
Cross-sectional BF TEM image (a) with NBED patterns from IMC1 (b), and IMC 2 (c) areas for Pd–Cu wire before HTS test. (b) and (c) correspond to
 $[\bar 120]$
of Cu9Al4 and [112] of θ′-CuAl2 as confirmed by SF calculation results shown in (b′) and (c′), respectively.

Cross-sectional BF TEM image (a) with NBED patterns from IMC1 (b), and IMC 2 (c) areas for (Au)Pd–Cu wire before HTS test. (b) and (c) correspond to [111] of Cu9Al4 and [021] of θ′-CuAl2 as confirmed by SF calculation results shown in (b′) and (c′), respectively.

In Fig. 9(a) is shown a cross-sectional BF TEM image of (Au)Pd–Cu wire bond. Similar to Pd–Cu wire bond, two IMC layers are observed between Cu ball and Al pad, i.e., (1) ∼15 nm thick IMC1 with smooth growth front located adjacent to Cu ball and (2) ∼95 nm thick IMC2 with irregularly shaped growth front located adjacent to Al pad. The NBED technique was also used to the encircled areas of IMC1 and IMC2 to show their corresponding patterns in Figs. 9(b) and 9(c). SF calculation was performed to obtain the corresponding phases and their crystallographic orientation in the same manner described above. The calculation result indicates that Figs. 9(b) and 9(c) correspond to [111] of Cu9Al4 and [021] of θ′-CuAl2, respectively. In addition, it should be noted that Au was not detected at the bonding interface by EDS, indicating that the amount of Au incorporation by flash coating is beyond the EDS detectability limit. Figures 8 and 9 provide two important findings: (1) there exist two different IMC phases of Cu9Al4 and θ′-CuAl2 at the Cu/Al bonding interface and (2) no significant morphological or IMC phase difference between Pd–Cu and (Au)Pd–Cu wire bonds.
Our previous studies on 0.8 mil ( = 20 μm) Pd coated Cu wire bond have revealed that the IMC phase found at Cu/Al interface was metastable θ′-CuAl2. Reference Bae, Jung and Du18,Reference Bae, Jung, Chen and Du19 While θ′-CuAl2 found in the current study is in good agreement with it, Cu9Al4 (which is an equilibrium phase) revealed in the as-packaged sample is the first to report.
E. Cross-sectional TEM examination of wire bonds made with Pd–Cu and (Au)Pd–Cu wires after HTS at 150 °C for 1000 h
To acquire in-depth understanding about the changes in the Cu/Al interface structure after HTS, cross-sectional TEM examination was performed as shown in Figs. 10 and 11. In Fig. 10(a) is shown a BF TEM image obtained from Pd–Cu wire bond. It clearly shows the two IMC layers (that are found in Fig. 6) between Al pad and Cu ball. The NBED technique was used at the two areas encircled in IMC1 and IMC2 to identify the corresponding phases. Figures 10(b) and 10(c) show their corresponding NBED patterns. SF calculation was performed in the same manner that was described above. The calculation result confirms that Figs. 10(b) and 10(c) match with the [111] net pattern of Cu9Al4 and the [021] net pattern of θ′-CuAl2, respectively, as shown in Figs. 10(b′) and 10(c′). Meanwhile, a BF TEM image from (Au)Pd–Cu wire bond is shown in Fig. 11(a). Similarly to Fig. 10(a), two distinct IMC layers are observed. NBED patterns are acquired from the encircled areas of IMC1 and IMC2 shown in Figs. 11(b) and 11(c). The SF calculation results acquired following the same manner reveal that Figs. 11(b) and 11(c) correspond to
 $[\bar 120]$
of Cu9Al4 and [112] of θ′-CuAl2, respectively. Thus, it becomes clear that after HTS test, θ′-CuAl2 and Cu9Al4 grow in size for both Pd–Cu and (Au)Pd–Cu wire bonds. No new Cu–Al IMC phase was formed in either Pd–Cu or (Au)Pd–Cu wire bond. Also, no significant difference was found between Pd–Cu and (Au)Pd–Cu wire bonds, indicating that the effect of Au flash coating on Cu–Al IMC formation is negligible.
Cross-sectional BF TEM image (a) with NBED patterns from IMC1 (b), and IMC 2 (c) areas for Pd–Cu wire after HTS test at 150 °C for 1000 h. (b) and (c) correspond to [111] of Cu9Al4 and [021] of θ′-CuAl2 as confirmed by SF calculation results shown in (b′) and (c′), respectively.

Cross-sectional BF TEM image (a) with NBED patterns from IMC1 (b), and IMC 2 (c) areas for (Au)Pd–Cu wire after HTS test at 150 °C for 1000 h. (b) and (c) correspond to
 $[\bar 120]$
of Cu9Al4 and [112] of θ′-CuAl2 as confirmed by SF calculation results shown in (b′) and (c′), respectively.

F. Formation of IMCs and their growth behavior
Our previous study on 0.8 mil Cu wire bond has discussed the possible reasons for the formation of metastable θ′-CuAl2 based on two factors: (1) extremely short bonding time (∼25 μs) that can be comparable to quenching effect and (2) epitaxial relationship between Cu ball and θ′-CuAl2 that allow for θ′-CuAl2 to grow on Cu ball by minimizing lattice mismatch. Reference Bae, Jung, Chen and Du19 The θ′-CuAl2 IMC phase found in the current study is in good agreement with this previous work. Reference Bae, Jung, Chen and Du19 In addition, to the best of our knowledge, the current study is the first to report the formation of equilibrium Cu9Al4 phase in the as-packaged sample, i.e., before HTS test. It is worth noting that the Cu9Al4 layer found in the present study is so thin (∼15 nm) that it can be confirmed not by SEM (see Figs. 4 and 5) but by TEM only (see Figs. 8 and 9). This extremely thin nature of Cu9Al4 layer in the as-packaged sample is considered one of the reasons that the Cu9Al4 phase has not been reported in previous studies that have used SEM-based techniques. Another interpretation of Cu9Al4 formation before HTS test may be associated with the Pd concentration in the Cu ball. It has been reported that Pd needs to be expelled from θ′-CuAl2 phase toward Cu ball as the θ′-CuAl2 phase grows at Cu/Al interface. Reference Lu, Wang, Appelt, Lai and Kao14,Reference Bae, Jung, Chen and Du19 It is speculated that as the θ′-CuAl2 phase grows further, more Pd will accumulate at the Cu side of Cu/IMC interface. This may play a role as a diffusion barrier for further Cu diffusion from Cu ball to θ′-CuAl2 phase, which will eventually reduce the θ′-CuAl2 phase growth rate. A recent study revealed the Pd-enrichment on the Cu side of Cu/IMC interface. Reference Uno and Yamada23 In addition, one of previous studies revealed that the presence of Pd reduces the Cu/Al IMC growth rate, Reference Xu, Qin, Clauberg, Chylak and Acoff24 which is in good agreement with current discussion. The Pd concentration at bonding interfaces for both Pd–Cu and (Au)Pd–Cu wire bonds used in the present study is so low that it is beyond EDS detectability. Thus, it can be speculated that due to relatively low Pd concentration, IMC growth in the current study is not as much disturbed as it was in the previous studies. As a result, Cu9Al4 phase, which is usually formed at later stages of IMC formation, i.e., after HTS test, can already appear in the as-packaged sample in the current study.
It should be noted that since NBED patterns for Cu9Al4 and CuAl2 in Figs. 8– 11 were acquired with no specimen tilt or rotation, a crystal orientation relationship between Cu9Al4 and θ′-CuAl2 in each figure can be directly compared to establish epitaxial relationships as follows:
-
(i)
 $[\bar 120]$
of Cu9Al4//[112] of θ′-CuAl2; (006) of Cu9Al4//
$\left( {\bar 220} \right)$
of θ′-CuAl2 [from Figs. 8(b) and 11(b)]
-
(ii) [111] of Cu9Al4//[021] of θ′-CuAl2;
$\left( {30\bar 3} \right)$
of Cu9Al4//
$(11\bar 2)$
of θ′-CuAl2 [from Figs. 9(b) and 10(b)]


Based on the above epitaxial relationships, atomistic configuration can be readily modeled as shown in Figs. 12(a) and 12(b), respectively. Note that the perfectly straight interfaces between Cu9Al4 and θ′-CuAl2 are for a simple illustration purpose. The real interface morphology should be more jagged and rough as shown in Figs. 8– 11. Figure 12(a) shows that (006) of Cu9Al4 and
 $\left( {\bar 220} \right)$
of θ′-CuAl2 that run parallel to each other have similar lattice spacings, i.e., 0.145 and 0.143 nm, respectively. Similarly, Fig. 12(b) shows that
 $\left( {30\bar 3} \right)$
of Cu9Al4 and
 $(11\bar 2)$
of θ′-CuAl2, which run parallel, have similar lattice spacings, i.e., 0.205 and 0.204 nm, respectively. Thus, it can be speculated that when Cu9Al4 and θ′-CuAl2 nucleate at the bonding interface, they grow together having specific orientations that minimize lattice mismatch.
Schematics of atomic configuration for the two epitaxial relationships: (a)
 $[\bar 120]$
of Cu9Al4//[112] of θ′-CuAl2; (006) of Cu9Al4//
 $\left( {\bar 220} \right)$
of θ′-CuAl2 and (b) [111] of Cu9Al4//[021] of θ′-CuAl2;
 $\left( {30\bar 3} \right)$
of Cu9Al4//
 $(11\bar 2)$
of θ′-CuAl2.

G. Crack formation and development after HTS test
Since the two IMC layers are found at the Cu/Al interface, it is expected that a significant volume change is involved for the IMC formation. It is evident that θ′-CuAl2 formation is controlled by Cu diffusion into Al pad, since θ′-CuAl2 grows from the original Cu/Al interface toward Al pad (see Figs. 4–7). This is in good agreement with previous reports. Reference Drozdov, Gur, Atzmon and Kaplan12,Reference Bae, Jung, Chen and Du19,Reference Xu, Liu, Silberschmidt, Pramana, White, Chen and Acoff25 When Al transforms into θ′-CuAl2, the volume that a single Al atom occupies changes from 0.01767 nm3 to 0.02367 nm3, which results in a ∼34% volume increase. When θ′-CuAl2 transforms into Cu9Al4 after HTS, the volume that a single Al atom occupies changes from 0.02367 nm3 to 0.04121 nm3, which results in a further ∼74% volume increase. The lattice stress induced by this volume change at bonding interface will increase as θ′-CuAl2 and Cu9Al4 continue to grow over HTS test. As a result, it is speculated that crack may nucleate and develop during HTS test when the stress accumulation accompanied by the IMCs' growth at the bonding interface is beyond the threshold of crack nucleation. This could be one of the possible reasons for the cracks found at the peripheries of both Pd–Cu and (Au)Pd–Cu wire bonds after HTS test as shown in Figs. 6 and 7. Besides, Uno et al. reported that halogens such as Cl and Br incorporated into molding compound can cause Cu–Al IMC corrosion that leads to crack development at the Cu/Al interface. Reference Williams and Carter21 Later, Abe et al. implemented chemical model simulation to predict IMC formation as well as to understand Cu/Al IMC corrosion mechanism. As a result, it was found that Cu-rich IMC is more susceptible against corrosion driven by Cl ions derived from molding compound. Reference Abe, Kang, Yamamoto, Yagihashi, Endo and Saito26 Since the wire bonds implemented in the current study were encapsulated by molding compound, the cracks found in Figs. 6 and 7 are considered to be associated with halogens driven corrosion as well.
IV. CONCLUSIONS
In summary, a comparative study on IMC formations at wire bond interfaces made of Pd–Cu and (Au)Pd–Cu wires has been performed using TEM techniques.
-
(1) While cross-sectional SEM images revealed ∼80 nm thick Pd coating layer from both Pd–Cu and (Au)Pd–Cu wires, the Au flash coating layer turned out too thin to be observed by a SEM technique.
-
(2) Before HTS test, i.e., as-packaged state, while irregularly shaped θ′-CuAl2 with its thickness varying from 40 to 80 nm was found as a majority IMC, extremely thin layer of Cu9Al4 (<15 nm) was also found between θ′-CuAl2 layer and Cu ball. After HTS test, both of the IMC phases grow in size. NBED and SF calculation revealed that θ′-CuAl2 and Cu9Al4 grow having epitaxial relationship, i.e.,
$[\bar 120]$
of Cu9Al4//[112] of θ′-CuAl2; (006) of Cu9Al4//
$\left( {\bar 220} \right)$
of θ′-CuAl2, and [111] of Cu9Al4//[021] of θ′-CuAl2;
$\left( {30\bar 3} \right)$
of Cu9Al4//
$(11\bar 2)$
of θ′-CuAl2, to grow together by minimizing lattice mismatch. -
(3) Cracks found at the interface between IMC and Cu could be associated with: (a) volume changes accompanied by IMC formation and (b) Cu9Al4 corrosion driven by halogen ions which are derived from molding compounds.
-
(4) SEM and TEM/NBED results suggest that there is no significance difference between Pd–Cu and (Au)Pd–Cu wire bonds before and after HTS test in terms of IMC morphology and phase formation. Au flash coating on Cu wire is considered to be so small that it hardly makes any effect on IMC formation.


ACKNOWLEDGMENTS
This research was partially funded by Small Scale Systems Integration and Packaging Center (S3IP) at State University of New York at Binghamton. S3IP is a New York State Center of Excellence and receives funding from the New York State Office of Science, Technology and Innovation (NYSTAR), the Empire State Development Corporation, and a consortium of industrial members.