For several decades now, psychologists and researchers have been exploring how children and adolescents occupy their leisure and free time due to the impact that such activities have on their psychosocial development (see Iso-Ahola, Reference Iso-Ahola1980 and Neulinger, Reference Neulinger1974). An overview of the literature on adolescent leisure shows that although adolescents and young people’s leisure time activities can be associated with potentially risky behavior like drinking or smoking (Paavola, Vartiainen, & Haukkala, 2004) it is mainly an excellent opportunity to play, relax, learn and develop positive psychosocial abilities (Caldwell & Witt, Reference Caldwell and Witt2011). As pointed out by the United Nations (2004) in its World Youth Report 2003, “research confirms that leisure time is important in helping young people achieve a broad range of positive outcomes: Social/emotional, vocational, physical, cognitive, and civic development and engagement” (p. 222).
The concern of the scientific community -and by extension society- to understand what activities young people do in their free time and what motivates them to do them is an issue that requires the adoption of a cross-cultural approach. As Walker and Wang (Reference Walker and Wang2009) point out, cross-cultural research on leisure time can be useful in answering questions such as “Is leisure universal”? (p. 179). Data seem to indicate that the amount of free time available to young people has actually increased, although it is distributed differently in each culture. For example, young people aged between 15 and 19 dedicated less than 20% of a typical day to leisure in Bulgaria, France and the United Kingdom, whereas young people in Germany and Norway dedicated more than 25% of their time to leisure pursuits (Eurostat, 2009). In the case of American youth (15-19 years old), almost five hours per day is dedicated to doing leisure and sport activities (U.S. Department of Labour, Bureau of Labor Statistics, 2015). As for Spanish adolescents, who are the focus of the present study, it seems that there has been a constant increase in leisure time over the last decade (Instituto de la Juventud, Injuve, 2015). On the other hand, it is important to take into account the relevance of the role played by parents, friends and other social agents in adolescents’ engagement in and motivation to do leisure activities. Ruiz-Juan, Baena-Extremera, and Granero-Gallegos (Reference Ruiz-Juan, Baena-Extremera and Granero-Gallegos2017) suggest that, compared to Costa Rican and Mexican young people, Spanish adolescents present a higher level of engagement in sports and physical activities, and parents, siblings and friends are predicting agents of this inactivity. Cecchini, Méndez, and Muñiz (Reference Cecchini, Méndez and Muñiz2002) analyzed the main reasons for doing sport in a sample of 8 to 18 year-old Spanish students and found that the most important reason was staying healthy. The reasons given as least important were related to two types of motivation: Behaviors and activities aimed at demonstrating more skills than others, and those oriented towards social approval and esteem from a significant other.
As we can see, a large number of investigations can be identified in the Spanish context dedicated to studying young people’s participation in physical and sporting activities outside school hours, as well as others to aimed at analyzing the benefits of participation in out-of-school activities on academic achievement (for an overview, see Hermoso, García, & Chinchilla, Reference Hermoso, García and Chinchilla2010). However, not enough evidence has been collected on adolescents’ leisure motivations. In this respect, the present study will focus on determining how Baldwin and Caldwell’s (2003) Free Time Motivation Scale for Adolescents (FTMS-A) functions in our context (Catalan-speaking Spanish adolescents). Obtaining knowledge on different cultural contexts can contribute to advancing our understanding of what some authors call Leisure Motivation Research, which refers to the study of psychosocial reasons for adolescents participating in leisure activities by comparing results with those obtained in other countries (Chen & Pang, Reference Chen and Pang2012).
Leisure Motivation Studies and Self-Determination Theory
Numerous instruments have been designed to measure individuals’ motivations. One of the first, the Free-Choice Period, was created by Deci (Reference Deci1971) and was aimed at determining degrees of intrinsic motivation. Later, Mayo (Reference Mayo1977) devised the Mayo Task Reaction Questionnaire to explore this type of motivation via a cognitive task (a puzzle). These instruments were subsequently adapted to different sports (Vallerand & Reid, Reference Vallerand and Reid1988). Whereas they had the limitation of being one-dimensional scales, later instruments took into account the continuum of motivation based on Ryan and Deci’s (2000) Self-Determination Theory (SDT).
Today, SDT represents the most extensive use of the self-determinism construct in the field of psychology, including the study of free time. The central issues of the theory are autonomous and controlled motivation. The former includes both intrinsic motivation and the types of extrinsic motivation in which people have identified with an activity’s value and will have integrated it into their self. The latter, controlled motivation, consists of both external regulation, in which one’s behavior is a function of external contingencies of reward or punishment, and introjected regulation, in which the regulation of action has been partially internalized and is energized by factors such as a need for approval or ego-involvements (for the current state of the theory, see Wehmeyer, Shogren, Little, & Lopez, Reference Wehmeyer, Shogren, Little and Lopez2017). In the words of Deci and Ryan (Reference Deci, Ryan and Ryan2012):
The regulation of extrinsically motivated behaviors is more autonomous when the individuals understand and accept the real importance of the activity for themselves. We refer to this type of regulation as identified regulation because the individuals have identified with the value of the behavior for themselves. … Finally, when an identification has become congruent with other identifications, needs, and experiences, the resulting regulation is referred to as integrated regulation, which represents the most highly autonomous form of extrinsic motivation (p. 89).
The benefits of autonomous functioning have been demonstrated in different cross-cultural studies and the increasing levels of internalization correlate with higher levels of well-being and less externalizing of problems (Vansteenkiste, Zhou, Lens, & Soenens, Reference Vansteenkiste, Zhou, Lens and Soenens2005; van Petegem, Beyers, Vansteenkiste, & Soenens, Reference van Petegem, Beyers, Vansteenkiste and Soenens2012).
Following Ryan and Deci’s Self-Determination Theory, Caldwell and Baldwin (2003) developed the FTMS-A for the early years of adolescence (12-15 years old) with the aim of evaluating the effectiveness of a free time educational program (Caldwell et al., Reference Caldwell, Younker, Wegner, Patrick, Vergnani, Smith and Flisher2008; Caldwell, Patrick, Smith, Palen, & Wegner, Reference Caldwell, Patrick, Smith, Palen and Wegner2010). This scale explores five forms of motivation: internal (corresponding to intrinsic motivation); external, introjected, and identified (related to the three types of external motivation); and, amotivation (when both intrinsic and extrinsic motivation are absent). Their work shows preliminary evidence of validity for the FTMS-A.
A review of some studies in which the FTMS-A was administered in order to explore free time in samples of children and adolescents suggests that additional work is needed to further support the reliability of this measure. By way of example, Kozub and Farmer (Reference Kozub and Farmer2011) found that free time motivation scores were not predictors of physical activity in 68 middle school children in the Midwestern United States. The authors suggested that this could be a validity issue with the FTMS-A or an indicator that free time motivation is a multifaceted construct that cannot be measured using general items. On the other hand, the majority of identified studies applying this measure involved the original authors and samples of American and African adolescents. Caldwell et al. (Reference Caldwell, Patrick, Smith, Palen and Wegner2010) explored changes in self-reported motivation for leisure in young Africans and did not find changes in intrinsic motivation or amotivation over time, although they did find less identified, introjected, and extrinsic motivation, particularly for girls. As the authors point out, these results differ from those of American young people, who present less intrinsic motivation and more amotivation (Sharp, Caldwell, Graham, & Ridenour, Reference Sharp, Caldwell, Graham and Ridenour2006). In the same line, Weybright, Caldwell, Xie, Wegner, and Smith (Reference Weybright, Caldwell, Xie, Wegner and Smith2017) used a sample of eight waves of data on South African adolescents between grades eight and eleven to explore the influence of substance use and leisure experience on high school learner dropout while controlling for demographic and known predictors. They applied the FTMS-A, but with a more concise structure following recent cross-cultural empirical studies (Xie et al., Reference Xie, Caldwell, Graham, Weybright, Wegner and Smith2016; Younker, Caldwell, Coffman, & Smith, Reference Younker, Caldwell, Coffman, Smith, McCormick and Kivel2008): Items were combined on external and introjected motivation (5 items) to represent adolescents’ extrinsic leisure motivation and on identified and intrinsic motivation (7 items) to measure adolescents’ intrinsic motivation.
Taking into account the above review, the main aims of our study were to translate and explore the functioning of Baldwin and Caldwell’s (2003) FTMS-A on a sample of 11 to 18-year-old Catalan-speaking Spanish adolescents and to analyze its convergent validity using three different instruments exploring subjective well-being.
The amotivation and external dimensions of the Catalan version of the FTMS-A were expected to correlate negatively with subjective well-being measures, whereas the internal and more regulated external dimensions were expected to correlate positively, in accordance with empirical evidence. Prior research indicates that amotivation correlates with negative subjective states like apathy (Fave & Massimini Reference Fave and Massimini2005), low levels of satisfaction, perceived lack of control and lower overall well-being (Watts & Caldwell Reference Watts and Caldwell2008). Trainor, Delfabbro, Anderson, and Winefield (Reference Trainor, Delfabbro, Anderson and Winefield2010) found that those Australian adolescents who reported not doing any particular activity in their free time displayed lower scores on some indicators of well-being, such as negative mood, social alienation, self-esteem and life satisfaction. Coatsworth, Palen, Sharp, and Ferrer-Wreder (Reference Coatsworth, Palen, Sharp and Ferrer-Wreder2006) consider that identified motivation would be closely linked to the well-being experienced by young people who set themselves goals and fight to achieve them. Introjective motivation would be very much related to peer influence or pressure to do certain activities. This influence can be positive if friends are a source of support and learning new skills. Finally, extrinsic motivation and amotivation would have more of a negative impact on adolescent well-being due to the lower interest in doing activities (Walker, Greene, & Mansell, Reference Walker, Greene and Mansell2006).
Method
Participants
The sample was composed of 2,263 adolescents. Their ages ranged from 11 to 18, with a mean of 14.99 (SD = 1.79). They were students in compulsory secondary education, general upper secondary education and intermediate specific vocational training recruited from 20 education centers in the province of Girona, Autonomous Region of Catalonia. They were from different socio-economic backgrounds. The majority of the secondary schools were state-run (82.9%), with some mixed funding (17.1%). Regarding geographical context, 4.6% of the schools were located in rural environments (by Spanish standards, which means under 2,000 inhabitants), 19.7% in semi-urban environments (between 2,000 and 10,000 inhabitants) and 75.7% in urban environments (above 10,000 inhabitants). The schools and classes were randomly selected to fulfill a quota for each age group and all steps were taken in accordance with ethical guidelines for questionnaire administration to young people.
Instruments
The Free Time Motivation Scale for Adolescents (FTMS-A) (Baldwin & Caldwell, Reference Baldwin and Caldwell2003)
The scale starts with the phrase “I do what I do in my free time because…” and continues with a list of 23 items rated on an 11-point Likert scale according to the degree of agreement or disagreement with each statement (0 = Don’t agree at all; 10 = Totally agree), allowing evaluation of the following five types of motivation related to adolescents’ free time: amotivation (AMT), external motivation (EXT), introjected motivation (IJ), identified motivation (ID) and intrinsic motivation (INT). The sixth type of motivation, integrated, is related to doing things consistent with one’s beliefs, and has not been considered in this study due to the fact that this aspect seems to be developed in late adolescence and early adulthood (Vallerand, Reference Vallerand and Zanna1997). The authors report good psychometric properties.
To explore its convergent validity we used different instruments that analyze subjective well-being in adolescence as recent research suggests that they differ slightly depending on whether a single-item (such as the single-item Overall Life Satisfaction scale) or multi-item (such as the Personal Well-Being Index) scale is used (González-Carrrasco, Casas, Malo, Viñas, & Dinisman, 2017).
The Personal Well-Being Index (PWI) (Cummins, Eckersley, Pallant, Van Vugt, & Misajon, Reference Cummins, Eckersley, Pallant, Van Vugt and Misajon2003)
Participants were asked how satisfied they felt with different areas of their lives at the time of responding to the questionnaire. The 7-item version was used in this study, which comprises the following domains: “Satisfaction with health”, “Satisfaction with standard of living”, “Satisfaction with life achievements”, “Satisfaction with how safe you feel”, “Satisfaction with feeling part of the community”, “Satisfaction with security for future”, and “Satisfaction with relationships with other people”. The item referring to “Satisfaction with feeling part of the community” has been substituted by the “Satisfaction with the groups of people I belong to”, as in previous Spanish samples, explained in Casas et al. (Reference Casas, Castellá, Abs, Coenders, Alfaro, Saforcada and Tono2012). The original English version of the PWI domains and their back-translation from Catalan into English have already been published in Casas et al. (Reference Casas, Coenders, Cummins, González, Figuer and Malo2008). All items were measured using a 0–10 scale (0 = Totally dissatisfied and 10 = Totally satisfied. The index is obtained by calculating the mean of the items and converting the result to a 0-100 scale. According to the authors of the scale, the Cronbach alpha lies between .70 and .85 and item-total correlations are at least .50. In this study, the Cronbach alpha is .81 and item-total correlations lie between .45 and .60.
The Satisfaction with Life scale (SWLS) (Diener, Emmons, Larsen, & Griffin, Reference Diener, Emmons, Larsen and Griffin1985)
This scale includes 5 items and responses were originally encoded on a scale of 1–7 according to level of agreement. Several Spanish adaptations exist. The version we use here is the one administered by Casas, González, Figuer, and Malo (Reference Casas, González, Figuer and Malo2009), where the 1–7 scale was changed to a 0–10 scale in order to make it more sensitive, with labels from “Strongly agree” to “Strongly disagree”. In our study, the Cronbach alpha of the scale without considering the item that obtains the lowest mean - If I could live my life over, I would change almost nothing - is .69.
Overall Life Satisfaction (OLS) (Campbell, Converse, & Rogers, 1976)
The OLS is a single-item scale. Participants were asked to evaluate their satisfaction with their life as a whole. The item was measured using an 11-point scale, 0 meaning Completely dissatisfied and 10 Completely satisfied.
Procedure
After requesting permission from the selected schools and respective parents’ associations, we informed participants about the general aims of the research and guaranteed the confidentiality of their data. The informed consent from all participants was signed by a parent or guardian. After that, we proceeded with the group administration of questionnaires in the classroom during school time. All boys and girls were instructed on how to respond to the questionnaire items. During administration of the questionnaire, the adolescents were accompanied by two pre-trained researchers in case they needed any assistance or clarification.
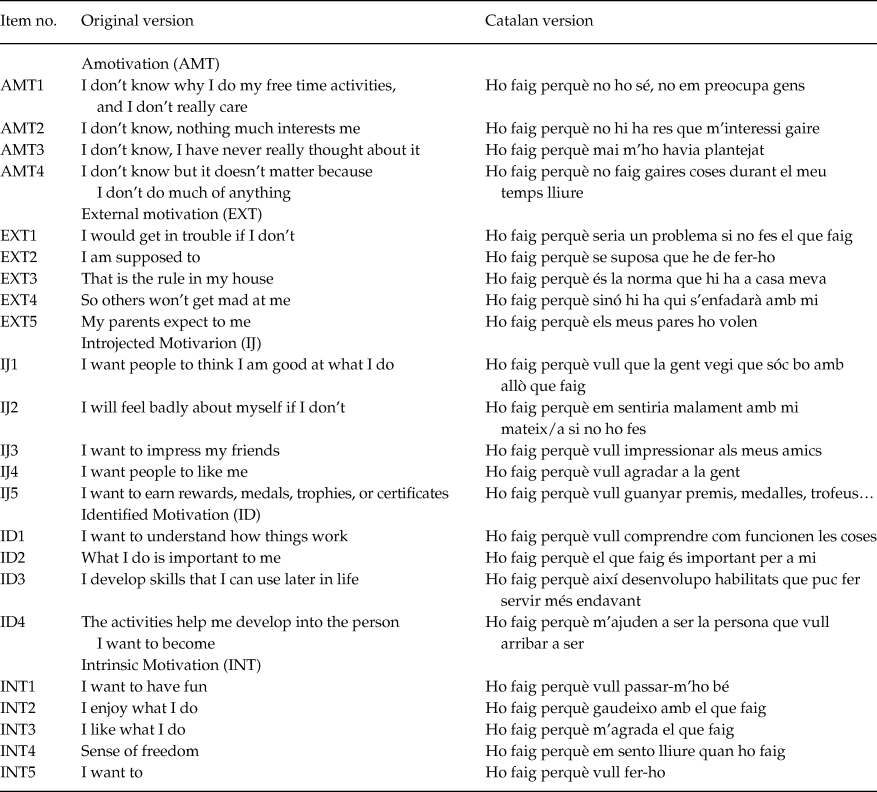
Table 1 shows the items from the original version of the FTMS-A and the corresponding items from the Catalan version. The back translation method was used for translation into Catalan (Brislin, Reference Brislin1970). Pilot tests were conducted to ensure understanding of all items on the scale.
Items from the Original and Catalan Versions of the FTMS-A.

Data Analysis
The statistical analysis was performed using the SPSS statistical package, version 22.0. Firstly, Confirmatory Factor Analysis (CFA) was used to investigate whether the factors identified by Baldwin and Caldwell (Reference Baldwin and Caldwell2003) were a good fit for the Spanish FTMS-A data. AMOS 18.0 was used and the fit was analyzed using maximum likelihood estimation procedures. To test the model fit, we used the χ2 index and its associated probability level, the χ2/gl (degrees of freedom) ratio, and the indices NNFI (Non-normed Fit Index), CFI (Comparative Fit Index) and RMSEA (Root Mean Square Error of Approximation). RMSEA values below .05, and CFI values of above .95 indicate a good fit (Hu & Bentler Reference Hu and Bentler1999). Values between 2 and 5 for the χ2/df ratio indicate a good fit to the model (Byrne, Reference Byrne2010). If a model has a good fit with the CFI and RMSEA together, it is considered very unlikely that the model is not suited to the data (Herrero, Reference Herrero2010). For missing values we used the regression imputation method.
Secondly, we conducted an Exploratory Factor Analysis (EFA) with one half of the sample (n = 1,131), selected at random, using the technique of extracting principal axes and the oblique rotation method (Oblimin). To extract the number of factors, we applied the Kaiser criteria (1960) (eigenvalues greater than 1), sedimentation test (Cattell’s Scree-test, 1966) and parallel analysis (Horn, Reference Horn1965), using the syntax program for O’Connor’s SPSS. Cronbach Alpha coefficients were calculated to analyze the internal consistency of the factors. A Confirmatory Factor Analysis (CFA) was performed on the second half of the sample (n = 1,132). The method of Maximum Likelihood Estimation (MLE) was used.
To explore convergent validity between the dimensions on the FTMS-A and the three subjective well-being indicators used (PWI, SWLS and OLS), Pearson’s correlation coefficients were used.
The minimum level of significance required in all statistical tests was p < .05.
Results
Structural Validity
Step 1: Confirmatory Factor Analysis (CFA)
As described above, a full-sample Confirmatory Factor Analysis (CFA) was performed in order to verify how the data fit with 5 factors corresponding to five types of motivation related to adolescents’ free time. The fourth model was observed to fit best, although only moderately, from which the second item of the introjected dimension of motivation was eliminated (I will feel badly about myself if I don’t) (Table 2).
Fit Indices for the FTMS-A Factors with the Entire Sample (11-18 years old)

Note: Model 1 = without delate items, original model; Model 2 = Model 1 with covariations; Model 3 = Model 1 without item IJ2; Model 4 = Model 2 without item IJ2.
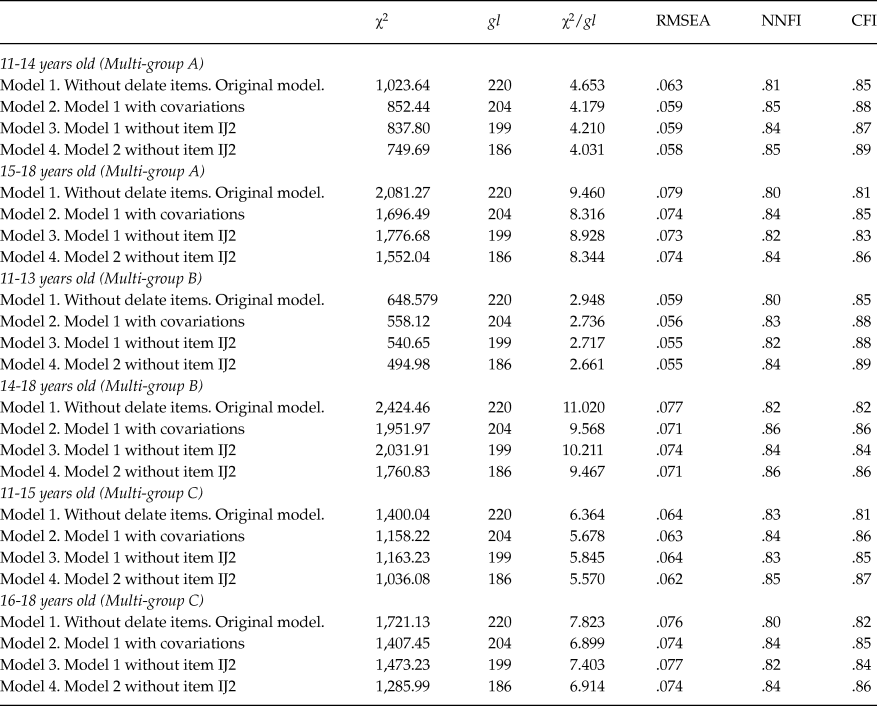
Multi-age group analyses were carried out in order to verify whether the scale’s performance improved. Various age groupings were made to explore at what ages the data best fit the model proposed by Baldwin and Caldwell (Reference Baldwin and Caldwell2003). As Table 3 shows, Model 4 (without item IJ2) between 11 and 14 years of age and this same model between 11 and 13 have the best fit rates, albeit moderate ones.
Multi-group Age CFA Models

Step 2A: Exploratory Factor Analysis (EFA) and Confirmatory Factor Analysis (CFA)
Previous analyses have indicated that the scale does not have acceptable fit indices, although a better fit is observed between 11 and 14 years of age (early adolescence). Therefore, an EFA and a CFA were performed to identify the structure that best fits the data in the sample studied.
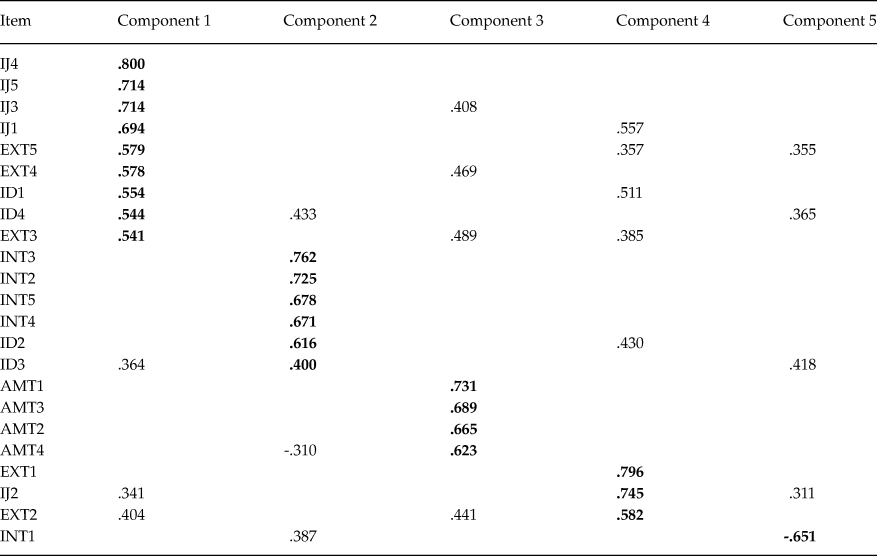
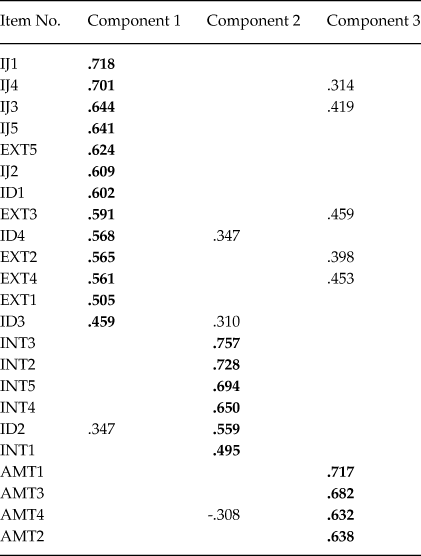
Both the Kaiser-Meyer-Olkin measure of sampling adequacy, with a value of .882, and Bartlett’s sphericity test, χ2(253) = 7,880.18, p < .001, indicate the suitability of the data to the EFA. Although five factors are obtained with the Kaiser criterion (Table 4), the results of the scree plot and parallel analysis advise the extraction of three factors. Given that with the extraction of five factors, 13 of the 23 items have weights above .30 in more than one component, we opted for the 3-factor solution. These three factors explain 45.91% of the variance. Table 5 shows the saturation matrix. Introjected motivation (IJ), intrinsic motivation (INT) and amotivation (AMT) factors are identified. External motivation and identified motivation items are grouped with introjected motivation items, which are those with greater weight in this component or factor.
Exploratory Factor Analysis for the FTMS-A Scale Considering the 5-factor Solution

Exploratory Factor Analysis for the FTMS-A Scale Considering the 3-factor Solution

Step 2B: Confirmatory Factor Analysis (CFA)
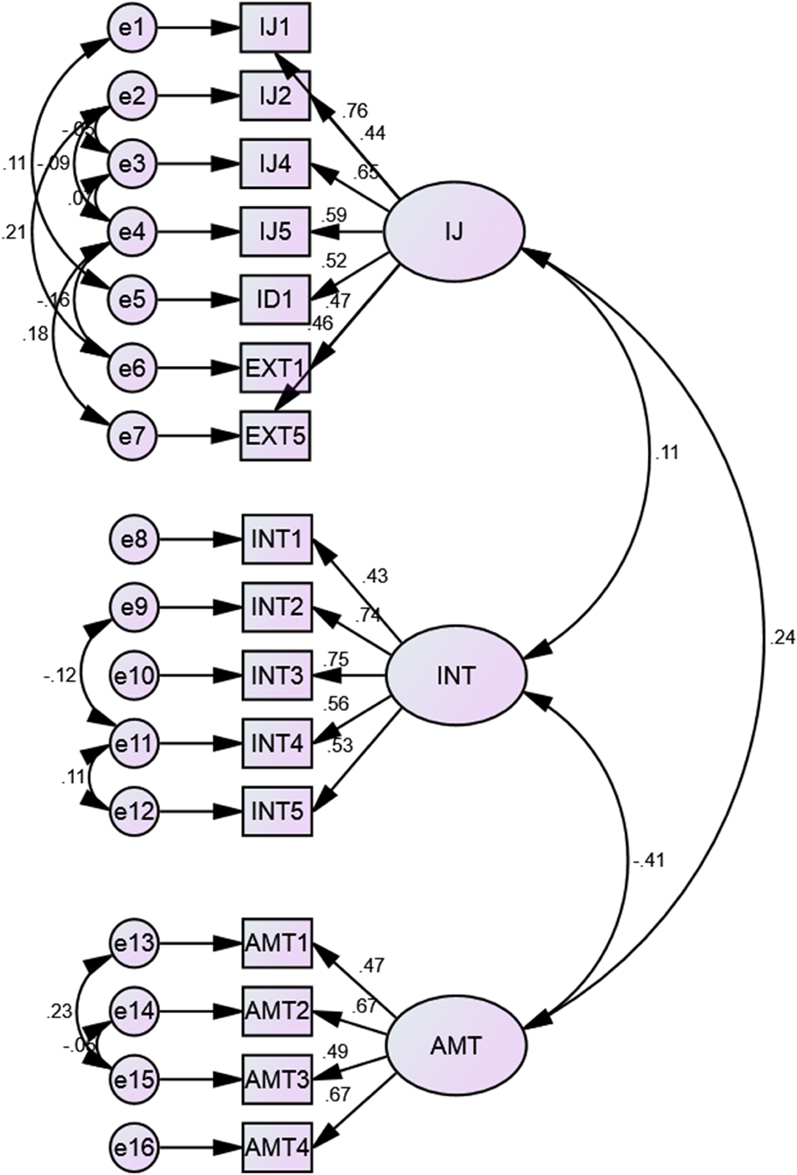
Table 6 shows the results of the CFA. Model 1 tested the original structure of five dimensions and 23 items. In Model 2, the items IJ1 and IJ5 were removed from the original structure. Model 3 was based on the results of the exploratory factor analysis, and therefore considered 3 factors. Finally, Models 4 and 5 corresponded to a modified model with and without covariates, respectively, retaining only those items with a corrected correlation greater than .30 and factor loads in the other dimensions below .40 (Ferguson & Cox, Reference Ferguson and Cox1993), considering the same 3-factor solution. Model 5 (Figure 1) displays acceptable goodness of fit indices. The three dimensions included in Models 3 to 5 are: Introjected motivation (IJ) - which includes 4 of the 5 items from the original introjected dimension plus two external motivation items and one identified motivation item-, intrinsic motivation (INT) and amotivation (AMT), which include all of the original items. The dimensions external and identified motivation were excluded from these models.
Fit Indices for the FTMS-A Factors

Note: Model 1 = Original structure retaining 23 items, 5 first-order factors, orthogonal; Model 2 = Original structure retaining 21 items, 5 first-order factors, orthogonal; Model 3 = CFA based on EFA results; Model 4 = Model modified according to CFA, 16 items, orthogonal; Model 5 = Model modified according to CFA, 16 items, not orthogonal.
Confirmatory Factor Analysis (CFA), Model 5.

Convergent validity: The relationship between FTMS-A and the three indicators of subjective well-being
The Pearson correlations between the 3 well-being indicators used here were positive, significant and moderate (PWI and SWLS r = .58, p < .001; PWI and OLS r = .63, p < .001; and SWLS and OLS r = .59, p < .001).
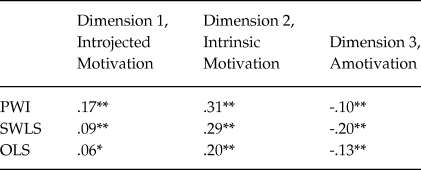
Table 7 shows the correlations of the three free-time dimensions resulting from the CFA with scores for the PWI, SWLS and OLS. We observe that the three indicators correlated significantly, positively and moderately with the dimensions of intrinsic and introjected motivation, and significantly and negatively with the dimension of amotivation.
Correlation between Well-Being Measures and the three Free-time Dimensions

PWI=Personal Well-being Index; SWLS=Satisfaction With Life Scale; OLS=Overall Life Satisfaction.
* Significant at p <.05. ** Significant at p < .001
Discussion
The main aim of this study was to translate and validate the FTMS-A using a sample of 11 to 18-year-old Catalan adolescents. To this end, we first performed a CFA on the whole sample in order to explore whether the motivational dimensions proposed by the SDT (Ryan & Deci Reference Ryan and Deci2000) and identified by Baldwin and Caldwell (Reference Baldwin and Caldwell2003) displayed a good fit. In general, the tested models showed fit indices that did not reach the acceptable minimum, although Model 4 (Table 2) fit a little better, eliminating item IJ2 (I will feel badly about myself if I don’t), to leave a 22-item model. The Baldwin and Caldwell (Reference Baldwin and Caldwell2003) model had good fit indices, although this meant excluding two items from the Introjected dimension (IJ1 and IJ5), with the 20-item scale coming out best. Our preliminary results seem to be in line with those found in other cultural contexts where it has been suggested that the scale presents some validity problems or the items should be less generic if they are to capture the multidimensionality of free time motivation (Kozub & Farmer, Reference Kozub and Farmer2011).
Given that the original model of the scale did not fit the studied sample, we set out to explore its fit using a multi-group analysis by age. To create the groups, we used the classification of stages of development proposed by Neistein (Reference Neistein1991): early adolescence (10-14 years old), medium adolescence (15-17) and late adolescence (18-21). Model 4 for the 11-14 and the 11-13 year-olds showed acceptable fit indices (Table 3), although they were very moderate. The FTMS-A was designed to evaluate early adolescents’ motivation towards free time activity between the ages of 12 and 15, these ages coinciding with the Spanish subsample of 11-14 year-olds, which moderately conformed to the original model.
The low robustness of results found to date led us to perform an EFA and a CFA in order to determine which structure best fit the sample studied. The CFA revealed that Model 5 (Table 6) displayed the best fit with the data explored in this study. This Model includes three dimensions (Figure 1): (a) Introjected Motivation (IJ), (b) Intrinsic Motivation (INT), and (c) Amotivation (AM). The first dimension (IJ) includes the items IJ1, IJ2, IJ4, IJ5, EXT1, EXT5 and ID1; the second (INT) comprises the dimension’s 5 items; and finally, the AM dimension includes the 4 items that comprise it. Table 8 shows the dimensions and items that make up the FTMS-A adapted to the Catalan context.
Free Time Motivation Scale for Adolescents (FTMS-A) Adapted to the Catalan Context

Therefore, following the principles of self-determination theory (SDT) proposed by Ryan and Deci (Reference Ryan and Deci2000), the results of our study suggest a model that retains the motivations at each end of the continuum, that is, intrinsic motivation and amotivation scales, although it differs from the original model in grouping items from external and identified motivation within the dimension of introjected motivation scales. In respect of this, Caldwell et al. (Reference Caldwell, Patrick, Smith, Palen and Wegner2010) observed that among African adolescents the dimensions of intrinsic motivation and amotivation remained stable over time, while the other three decreased. Although the various degrees of self-regulation and various motivations suggested by the SDT to guide behavior appear in different cultures (Wehmeyer et al., Reference Wehmeyer, Shogren, Little and Lopez2017), our data suggest that it is in the way that adolescents manage to regulate the causes of their behaviors from external to internal, and therefore their sense of self-determination, that major cultural differences appear. Peer, parental or self-applied pressure to do certain leisure activities during free time seem to be covered under one single dimension in this study, influenced by both external forces and the subject’s own decision-making. With regard to the adolescents studied here, their extrinsic motivation when choosing which activities to do in their free time would be explained to a greater extent by introjected motivations (IJ1, I want people to think I am good at what I do; IJ2, I will feel badly about myself if I don’t; IJ4, I want people to like me; IJ5, I want to earn rewards, medals, trophies, or certificates) and to a lesser extent external (EXT1, I would get in trouble if I don’t; EXT2, My parents expect to me) and identified motivations (ID1, I want to understand how things work). As Deci and Ryan (Reference Deci, Ryan and Ryan2012) point out, introjected motivation means engaging in an activity to satisfy internal pressures, such as avoiding guilt (IJ2) or shame (IJ1), or the pursuit of self-esteem (IJ4). The reason for adopting the behavior in this case would result from partial internalization, so that it remains relatively controlled in nature, as it is accompanied by feelings of internal pressure and conflict and not fully accepted as one’s own.
Adolescence is a vital period during which external social agents are very active in young people’s decision-making and autonomy is therefore very much in development when it comes to their regulating different behaviors. Adolescents’ decisions are strongly affected by the family, but also and above all peers and nowadays social media agents such as social networks or other ICTs. The search for approval from others, in terms of individual and social identity, is crucial when choosing what they do in their free time. For this reason, it seems congruent that some of the items included in the dimension of introjected motivation that have remained in our model are related to this aspect (I will feel badly about myself if I don’t, I want people to like me, My parents expect me to). However, contrary to our results, previous studies have indicated that when doing sports Spanish children and adolescents report the reasons of “demonstrating more skills than others or the search for social approval from significant others” as less important (Cecchini et al., Reference Cecchini, Méndez and Muñiz2002). Baldwin and Caldwell (Reference Baldwin and Caldwell2003) also observed that African adolescents did not feel their friends influenced them, even if more in-depth discussions led to the observation that this type of motivation did exist at these ages. The complex functioning of this type of motivation at these ages means more studies are required in different cultures, and as the authors of the scale conclude, new items need to be developed that capture this kind of motivation in a better and more sensitive way.
In the final model obtained in the present study, only one item was maintained regarding identified motivation (ID1, I want to understand how things work), included under the dimension of introjected motivation. In respect of this, we can hypothesize that because the average age of the sample was 15, the subjects’ choices regarding the activities they participate in during their free time are still largely dependent on their parents, and therefore partially internalized as their own. Thus, perhaps only the oldest adolescents in the sample, the 17-18 year-olds, who have reached legal age, are those who might display a fully internalized type of regulation and greater autonomy when deciding what motivates them to do the activities they engage in during their free time (Deci & Ryan, Reference Deci, Ryan and Ryan2012; van Petegem et al., Reference van Petegem, Beyers, Vansteenkiste and Soenens2012).
With regard to convergent validity (Table 7), the correlations obtained between the FTMS-A and the three measures of subjective well-being (SWB) scales show an association between free time motivations and this construct. As expected, intrinsic motivation (INT) obtains the highest correlation with the three well-being indicators used, in comparison with the other two (IJ and AM). The highest correlations correspond to the PWI and SWLS, both being multi-item measures of subjective well-being, the lower correlations being with the single-item scale on overall life satisfaction (OLS). These data corroborate the findings of other authors (Larson Reference Larson2000; Watts & Caldwell, Reference Watts and Caldwell2008), who highlight the positive impact of intrinsic motivation on adolescents’ personal development.
Consistent with data from other studies cited in the Introduction, in the studied sample amotivation correlated significantly and negatively with the three indicators (Fave & Massimini Reference Fave and Massimini2005; Walker et., 2006). Introjected motivation showed significant and positive, although very low, correlations with the three well-being indicators. However, it is worth remembering that in our study two items relating to external motivation and one relating to identified motivation was grouped to this dimension, a factor that could explain the low correlations and should be further explored.
Finally, we would like to point out some limitations of the present study and research proposals for the future. Firstly, although the studied sample is from a general population of adolescents in the school context, allowing it to be both large and representative, the instrument was administered in the classroom context with the support and supervision of the researchers, the data were collected through a self-reported questionnaire. This does not guarantee the reliability or validity of the subjects’ answers. Secondly, although a back-translation process was carried out from English to Catalan and a pilot test was conducted with adolescents, it would be interesting to carry out cognitive interviews to ensure that cross-cultural results are comparable. As proposed by Schoua-Glusberg and Villar (Reference Schoua-Glusberg, Villar, Miller, Willson, Chepp and Padilla2014), cognitive testing of translation is one way to assess how questions will work in the target language, what type of errors are present in each language version, and whether questions perform comparably across language versions (p. 53). Lastly, because the model of scale used in the present study differs from the original, it is proposed that the new scale structure suggested by recent cross-cultural studies be tested in the future (Xie et al., Reference Xie, Caldwell, Graham, Weybright, Wegner and Smith2016; Younker et al., Reference Younker, Caldwell, Coffman, Smith, McCormick and Kivel2008).