INTRODUCTION
The North Norfolk Sandbanks and Saturn Reef are currently identified as a possible offshore Special Area of Conservation (SAC) under the Habitats Directive (EU, 1992). One of the major interest features in the area are ‘Sandbanks which are slightly covered by seawater all the time’, one of the habitats listed on Annex I of the Directive. For these purposes, sandbanks have been defined as ‘elevated, elongated, rounded or irregular topographic features, permanently submerged and predominantly surrounded by deeper water’, and that they are ‘slightly covered by sea water all the time’ means that the water depth above the sandbank is ‘seldom more than 20 m below chart datum’ (CEC, 2007).
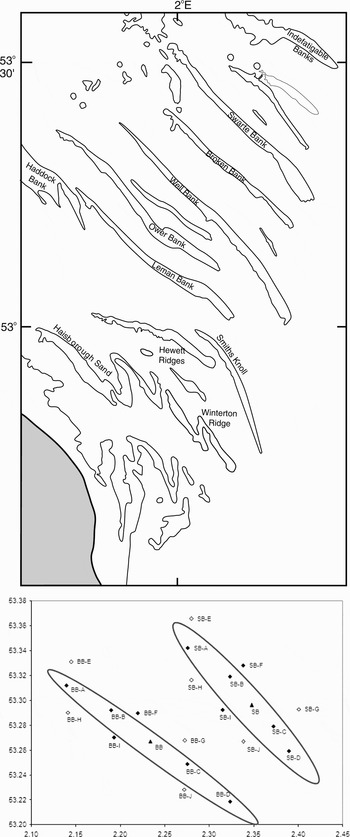
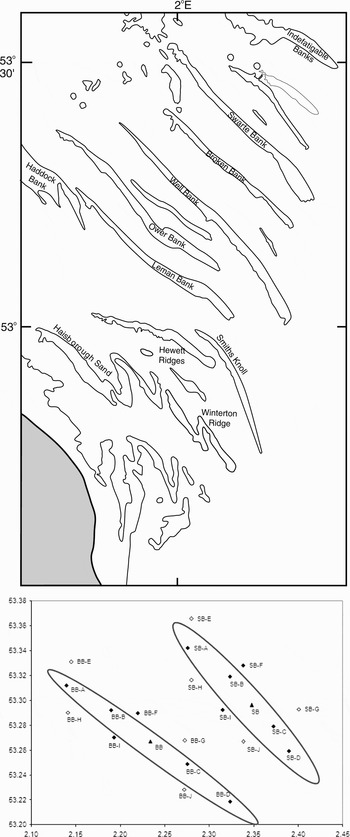
The North Norfolk sandbanks site comprises ten linear sandbanks (Figure 1), in addition to several smaller, fragmented banks. Although the proposed SAC covers a total area of 4327 km2, the area of the sandbanks themselves is smaller and individual banks range in size from approximately 16.5–135 km2. The hydrodynamics and sediment movement associated with North Sea sandbanks have been reported in several studies (e.g. Howarth & Huthnance, Reference Howarth and Huthnance1984; Pan et al., Reference Pan, MacDonald, Williams, O'Connor, Nicholson and Davies2007), and these indicate that there is a local clockwise circulation of sand and water around the banks as part of the broad scale hydrodynamics of the southern North Sea (Collins et al., Reference Collins, Shimwell, Gao, Powell, Hewitson and Taylor1995).
Location of North Norfolk sandbanks (top) and sampling grid (bottom) indicating main sites (solid triangles: replicated 2 m beam trawl and infaunal sampling; solid diamonds: single 2 m beam trawl and infaunal sampling) and additional sites sampled with 2 m beam trawl and sediment sampling (open diamond).
The characteristic fauna of such habitats may include polychaetes, crustaceans, anthozoans, bivalves, echinoderms and various fish species (including sand eels Ammodytes spp., dragonets Callionymus spp., sand gobies Pomatoschistus spp., lesser weever Echiichthys vipera, plaice Pleuronectes platessa and dab Limanda limanda) (CEC, 2007). However, the seabed topography, shallow water depth and complex hydrodynamics make these environments difficult to sample, and so quantitative data on the fauna of offshore sandbanks are scarce, and there have been no recent published studies of the fauna of the North Norfolk sandbanks.
Sandbanks are important habitats that can help protect nearby coastlines (Pan et al., Reference Pan, MacDonald, Williams, O'Connor, Nicholson and Davies2007) and may also be exploited by the marine aggregate industry (e.g. Poiner & Kennedy, Reference Poiner and Kennedy1984; Moulaert & Hostens, Reference Moulaert and Hostens2007), but little is known about their ecological importance. Inshore sandbanks off the Dutch and Belgian coasts have been the subject of some investigations, including the sampling of meiofauna (Willems et al., Reference Willems, Vincx, Claeys, Vanosmael and Heip1982b; Vanaverbeke et al., Reference Vanaverbeke, Gheskiere and Vincx2000, Reference Vanaverbeke, Gheskiere, Steyaert and Vincx2002), macrofauna (Vanosmael et al., Reference Vanosmael, Willems, Claeys, Vincx and Heip1982) and the suprabenthos (Dewicke et al., Reference Dewicke, Vincx, Cattrijsse and Mees2003), but there is a lack of comparable information for the North Norfolk sandbanks which are of current conservation interest. Elsewhere in UK seas, Kaiser et al. (Reference Kaiser, Bergmann, Hinz, Galanidi, Shucksmith, Rees, Darbyshire and Ramsay2004) undertook replicate 2 m and 4 m beam trawl sampling to examine the fish and larger epifauna associated with several sandbanks in Welsh coastal waters, which highlighted the low species diversity of such habitats. There are also some localized studies on estuarine and inshore sandbanks along the south coast of England (e.g. Holme, Reference Holme1949; Withers & Thorp, Reference Withers and Thorp1978).
Effective conservation of such habitats in European seas requires specific conservation objectives. These need to be achieved by closely linked management measures that regulate the activities of those marine industries which may threaten the integrity of the habitat, or the viability of the associated populations (Pedersen et al., Reference Pedersen, Fock, Krause, Pusch, Sell, Böttcher, Rogers, Sköld, Skov, Podolska, Piet and Rice2009). Although the conservation objectives for the North Norfolk sandbanks have not yet been identified, those for sandbanks in German waters require the maintenance of characteristic morphological and hydrodynamic conditions, habitat structure and surface area, and the characteristic benthic communities and benthic species (Pederson et al., 2009). In order to achieve these management goals detailed descriptions of the conservation features, with an indication of their sensitivity to the pressures of offshore activities, are required. The aim of the present paper is therefore to provide the first detailed description of the fauna associated with the linear sandbanks off the North Norfolk coast, in preparation for the development of such conservation objectives. The communities observed are also compared with those described elsewhere in northern European seas.
MATERIALS AND METHODS
Description of study area
The North Norfolk sandbanks comprise a complex of linear sandbanks (Figure 1). The more inshore banks (Leman, Ower and Well Banks) have extensive shallower areas (water depth above the sandbank <10 m), while the more offshore Broken Bank, Swarte Banks and Indefatigable Banks are slightly deeper (water depth above the sandbank <20 m). For practical reasons, field studies focused on the Swarte and Broken Banks, as other banks were either too shallow for surveying by research vessel and/or had offshore gas installations and pipelines in the area.
Biological sampling
The meiofauna, macro-infauna and epifauna of the Swarte and Broken Banks (Figure 1) were sampled with a range of benthic sampling gears during April 2006.
The epifauna was sampled using a steel 2 m beam trawl with chain mat (see Jennings et al. (Reference Jennings, Lancaster, Woolmer and Cotter1999) for a gear description). Tows were of 5 minutes duration with a warp:depth ratio of 3:1. Overall, 15 epifauna samples were collected for each bank, including five replicate samples (at one site) and four individual samples (four sites) along the crest of the bank, and single samples from three sites on either side of the bank. For logistic reasons, no trawling was undertaken on the steepest parts of the slopes. The larger epifauna and demersal fish were also sampled with 4 m beam trawl, with two tows (of 30 minutes duration) between and parallel to the sandbanks. Catches were fully sorted with invertebrates and demersal fish identified to the lowest taxonomic level, and the biomass and numbers of each species recorded. If a species was very abundant, the total weight was recorded and a sub-sample of known weight was enumerated. Taxa that are not sampled effectively by 2 m beam trawl (e.g. mysids, nemerteans and small polychaetes) were excluded from data analyses.
Five replicate 0.1 m2 Day grabs were collected at five stations along the crest of each sandbank and at single sites either side of the sandbanks. Additional, non-replicated Day grabs were collected at four other stations located on the deeper surrounding seabed of each sandbank. From each Day grab, two sub-samples were collected with a Perspex corer (3.6 cm diameter, 10 cm2 surface area) to a depth of 5 cm; one for particle size analysis (PSA) and one for the study of meiofaunal nematodes. All faunal samples were fixed in 5% formaldehyde in 63 µm filtered seawater. Replicated sub-samples for PSA were combined by station and frozen at –20°C prior to analysis.
After thawing, the 22 sediment samples were wet sieved through a 500 µm sieve, and the fraction >500 µm was oven-dried at 90°C for 24 hours. This fraction was then dry sieved at 0.5 phi intervals, down to 1 phi (500 µm). The fraction <500 µm was freeze dried and analysed on a Coulter LS 130 Laser sizer.
A total of 35 macro-infauna samples were processed and analysed from each bank (i.e. five replicates from each of the five stations along the sandbank and the two off-bank sites). Samples were initially puddled over a 1 mm sieve to remove the excess sediment and the remaining fauna and sediment were fixed in 5% formaldehyde in 63 µm filtered seawater for subsequent analysis. Each individual was then identified to the lowest taxonomic level and the total biomass (blotted wet weight, g) and abundance (number of individuals) of each taxon in a sample was recorded. Animals were only used in the analysis if the head was present.
Four of the five meiofaunal replicates collected at each station were processed. After washing the samples onto a 63 µm sieve, meiofauna was extracted with LudoxTM 40 (Somerfield & Warwick, Reference Somerfield and Warwick1996). The extraction was repeated three times before the extracted material was evaporated slowly in anhydrous glycerol and mounted on slides for taxonomic identification and counting.
Data analysis
All data analysis was conducted using the suite of statistical measures available in PRIMER v. 6 (Clarke & Gorley, Reference Clarke and Gorley2006). Cluster analysis and multi-dimensional scaling of abundance and biomass data were conducted for epifaunal catches from beam trawl (square root transformed) and infaunal samples from Day grab samples (fourth root transformed) and using the Bray–Curtis similarity index. The similarity of percentages procedure (SIMPER) was used to identify species that discriminated between catches on the bank and at off-bank sites.
The following diversity metrics were calculated for both the infaunal and epifaunal (excluding colonial species) samples: total number of species (S), total number of individuals (N), Margalef's species richness (d), Pielou's evenness (J′), Shannon's index (H′) and the Simpson index (1-λ′). For further description of these metrics, see Magurran (Reference Magurran1988) and Clarke & Gorley (Reference Clarke and Gorley2006).
RESULTS
Description of study area
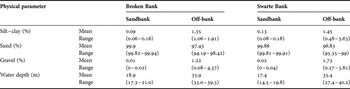
The water depths over the crests of the banks ranged from 14.5–21 m, and the off-bank habitats sampled ranged from 27–40 m deep. The proportion of gravel and silt–clay were generally very low, with the sediments on the crests and off-bank sites ranging from 97–99.9% sand (Table 1), of which the greatest fractions were retained on the 125–250 µm sieves. Such subtle differences in sediment composition are an important factor in structuring the sandbank communities (see Discussion).
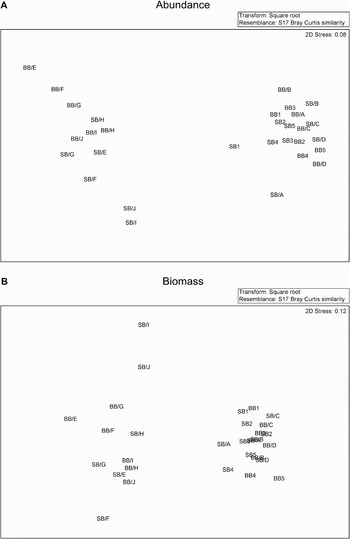
Multidimensional scaling plots of fish and epifaunal catches in 2 m beam trawl from the Swarte Bank (SB) and Broken Bank (BB), with 1–5 replicate stations on the centre of the bank, A–D single stations along the bank, and E–J off-bank stations. Average dissimilarity between bank and off-bank samples by (A) abundance and (B) biomass data were 62.8% and 65.2%, respectively.

Physical parameters from the two sandbanks sampled, giving sediment composition for silt–clay (grain sizes <63 µm), sand (63 µm–1.9 mm), gravel content (≥2 mm), and water depth (m).

Fish and epifauna
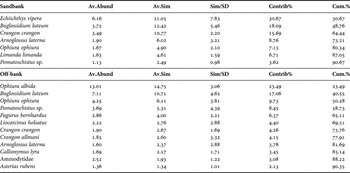
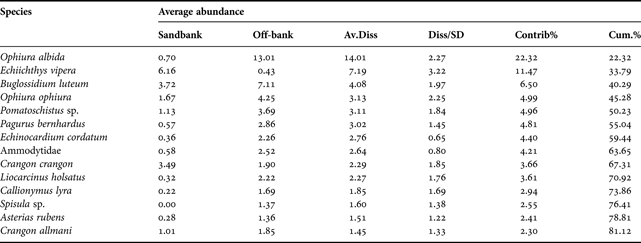
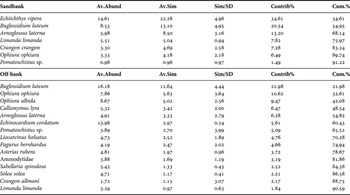
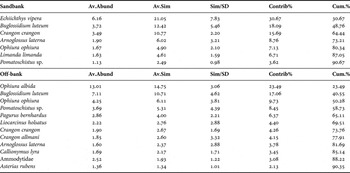
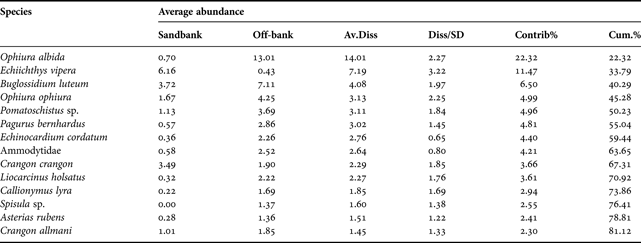
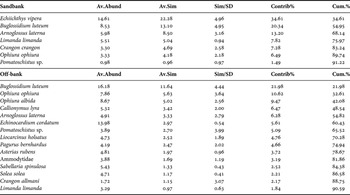
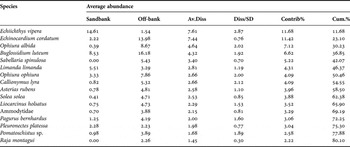
The sandbank crests were typified by small catches of relatively few species (Table 2), with the main species sampled including Crangon crangon, Ophiura ophiura and five species of fish: lesser weever, solenette Buglossidium luteum, scaldfish Arnoglossus laterna, dab and sand gobies Pomatoschistus spp.). In contrast, sites in deeper water off the sandbanks were more speciose and the assemblages in these habitats were clearly distinct (Figure 2). Species that were relatively abundant between sandbanks included some species that occurred on the sandbank crests, as well as Ophiura albida, various crustaceans (Pagurus bernhardus, Liocarcinus holsatus and Crangon allmanni) and other fish species (e.g. dragonet and sandeels). The main differences between bank and off-bank habitats were caused by high abundance of lesser weever and C. crangon on the crests of the banks, and larger numbers of species (especially O. albida, O. ophiura, L. holsatus, sand gobies and solenette) at off-bank sites (Table 3). In terms of biomass, these provided broadly similar results (Tables 4 & 5), although colonies of Sabellaria spinulosa were only recorded from off-bank habitats. Only one fish species (lumpsucker) that was recorded in the 4 m beam trawl was not observed in 2 m beam trawl catches. A taxonomic list of the fauna recorded from the sandbanks is provided in the Appendix.
Dominant fish and epifauna (individuals per tow) captured by 2 m beam trawl on the sandbank crests (average similarity = 68.7%) and at off-bank sites (average similarity = 62.8%), showing the average abundance, average similarity, and the relative and cumulative contributions to the similarity. Data root-transformed.
Differences in the fish and epifauna of sandbank crests and off-bank sites (average dissimilarity = 62.8%), showing the average abundance, the average dissimilarity by species, and the relative and cumulative contributions to the dissimilarity. See Clarke & Gorley (Reference Clarke and Gorley2006) for further information.
Dominant fish and epifauna (biomass) captured by 2 m beam trawl on the sandbank crests (average similarity = 64.4%) and off-bank sites (average similarity = 53.0%). Data root-transformed. See Table 2 for further information on data presented.
Differences in the fish and epifauna (biomass) of sandbanks and off-bank (average dissimilarity = 65.2%). See Table 3 for further information on the data presented.
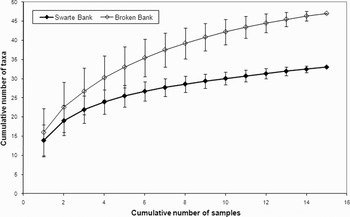
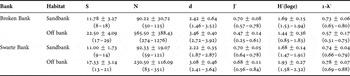
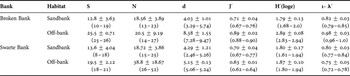
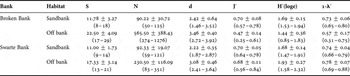
Although the bank and off-bank assemblages were very similar on both the Swarte and Broken Banks, a larger number of species were observed on the Broken Bank (Figure 3; Table 6).
Cumulative frequency of taxa caught in 2 m beam trawl sampling (mean ± SD) on and around the Swarte Bank and Broken Bank.

Univariate indices (total number of species, S; total number of individuals, N; Margalef's species richness, d; Pielou's evenness, J′; Shannon's index, H′; and Simpson's index, 1-λ′) for the epifauna of sandbank and off-bank habitats (mean ± standard deviation, range in parentheses).
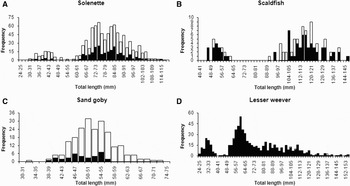
In terms of demersal fish, lesser weever was more abundant on the crests of the sandbanks (mean catch per unit effort = 39.3 ind.tow−1) than at off-bank sites (0.6 ind.tow−1). The length–frequency of lesser weever included a cohort of recently recruited fish (24–39 mm total length, LT) as well as larger fish (ranging from 50–155 mm LT), although the smaller-sized fish were only present from samples collected on the crests of the banks (Figure 4). Catch rates of scaldfish were broadly similar in both habitats (3.9 and 2.8 ind.tow−1 on the sandbank and off-bank habitats), with fish ranging from 46–62 mm and 91–147 mm. The cohort of smallest fish was proportionally more abundant on the crest (23.9% of the total number of scaldfish caught on the sandbank) than at off-bank sites (14.7% of total individuals). Solenette were caught in greater numbers at off-bank sites than on the sandbanks themselves (53.7 and 14.6 ind.tow−1, respectively), although the overall length distribution (30–117 mm) was comparable in both habitats. Although most solenette ranged from 60–105 mm LT, there was also a cohort of fish 30–50 mm. Sand gobies were also more common on off-bank sites (15.3 ind.tow−1) than on the crests of the sandbanks (1.9 ind.tow−1), with a more restricted length-range observed on the sandbank (39–56 mm) than from off-bank sites (32–72 mm).
Length–frequency distributions (by 2 mm length categories) for (A) solenette, (B) scaldfish, (C) sand goby and (D) lesser weever caught by 2 m beam trawl on the tops of sandbanks (black bars, 18 hauls) and from off-bank sites (white bars, 12 hauls).

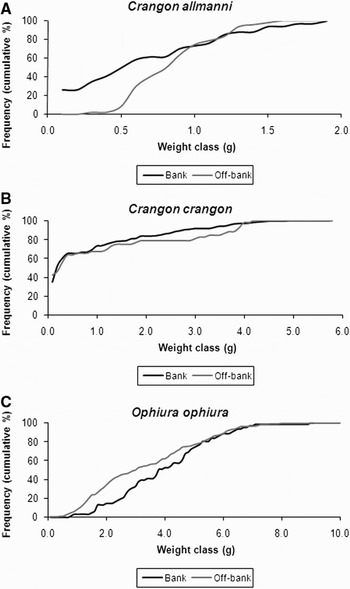
There were also subtle differences in the size distributions of some epifaunal invertebrates (Figure 5), although sample sizes were generally small. Samples of Crangon allmanni from the sandbank contained proportionally more smaller-sized individuals in contrast to off-bank sites, whereas the size distributions of C. crangon were similar in both habitats. The brittlestar Ophiura ophiura was more abundant at off-bank sites than on the crest, and proportionally more small individuals were found at off-bank sites.
Cumulative weight–frequency distributions for (A) Crangon allmanni, (B) C. crangon, and (C) Ophiura ophiura caught by 2 m beam trawl on the tops of sandbanks (black line, 18 hauls) and from off-bank sites (grey line, 12 hauls).

Macrobenthic infauna
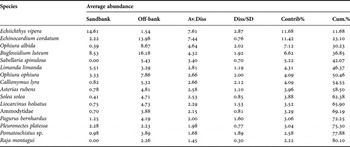
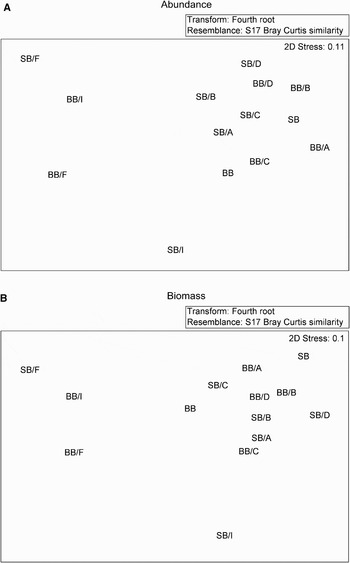
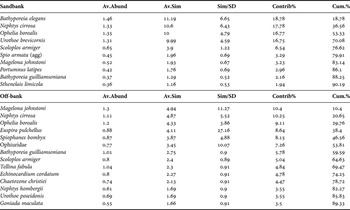
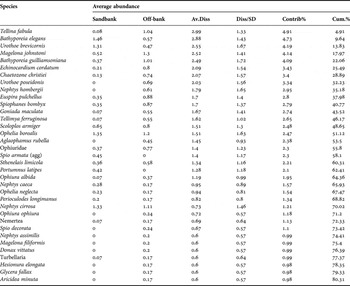
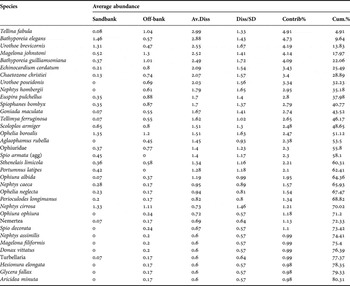
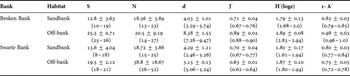
The sandbank crests were typified by low numbers of relatively few species (Table 7), with 10 species comprising more than 90% of the sampled fauna. With one exception (the brachyuran Portumnus latipes), the dominant species were amphipods (Bathyporeia elegans, B. guilliamsoniana and Urothoe brevicornis), predatory polychaetes (Nephtys cirrosa and Sthenelais limicola) or deposit-feeding polychaetes (Spionidae and Magelonidae). In contrast, the assemblages at off-bank sites were clearly distinct (Figure 6; Table 8) and more speciose (particularly at the Broken Bank; see Table 9). Species that were relatively abundant at off-bank sites included those that occurred on the sandbank crests, as well as the deposit-feeding Spiophanes bombyx, two molluscs (Euspira pulchellus and Tellina fabula), sea potato (Echinocardium cordatum) and two further predatory polychaetes (Nephtys hombergii and Goniada maculata). The main differences between bank and off-bank habitats were the reduced numbers of bivalves and echinoderms found on the crests of the banks, and an increased number of predatory species (e.g. N. hombergii, Aglaophamus rubella, Glycera fallax, Anaitides spp. and Sigalion mathildae) in off-bank habitats (Table 9). In terms of biomass, these provided broadly similar results to the abundance data. A list of species observed is included in the Appendix.
Multidimensional scaling plots of infaunal catches by Day grab from seven stations at each of the Swarte and Broken Banks, including the main stations (SB and BB), other sites along the banks (suffixed A–D) and off-bank sites (suffixed F and I). The average dissimilarities between bank and off-bank samples were 60.89% by numbers (top) and 67.45% by biomass (bottom).

Infauna (individuals) captured by Day grab on the sandbank crests (average similarity = 59.61%) and at off-bank sites (average similarity = 47.52%). Data fourth root-transformed. See Table 2 for further information on the data presented.
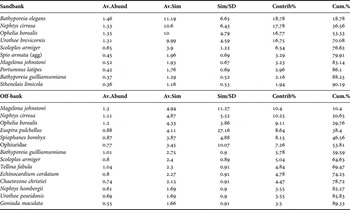
Differences in the macrobenthic infauna of sandbank crests and at off-bank sites (average dissimilarity = 60.89%). See Table 3 for further information on the data presented.
Univariate indices for the macrobenthic infauna of sandbank and off-bank habitats (mean ± standard deviation, range in parentheses). See Table 6 for further information on indices used.
Meiofaunal nematodes
Two nematode feeding types dominated at all stations: non-selective deposit feeders and epigrowth feeders. Whilst the species diversity of nematode assemblages did not differ notably between both sandbanks, communities collected on the banks were more diverse than those recorded at the deeper off-bank sites. Heavily ornamented, small-sized species were abundant on the banks themselves, including Xyala striata, Neochromadora trichophora, N. poecilosoma and Rhynchonema sp. Off-bank locations were characterized by a high abundance of Metadesmolaimus pandus, Microlaimus conothelis, Sabatieria punctata and Paracanthonchus platti. Given the close association between nematodes and their sedimentary environments, further analyses of these data are given in Schratzberger et al. (in preparation).
DISCUSSION
Although offshore sandbanks are one of the habitats listed on Annex I of the EC Habitats Directive, there have been comparatively few studies examining the ecology of such habitats, especially in offshore areas (in this context, offshore refers to sites beyond 12 nautical miles from shore). Indeed, most previous studies on sandbanks in UK waters have been conducted in inshore areas (Holme, Reference Holme1949; Withers & Thorp, Reference Withers and Thorp1978; Kaiser et al., Reference Kaiser, Bergmann, Hinz, Galanidi, Shucksmith, Rees, Darbyshire and Ramsay2004), and the sandbank habitats studied previously in the North Sea have been either in coastal waters (Vanosmael et al., Reference Vanosmael, Willems, Claeys, Vincx and Heip1982; Willems et al., Reference Willems, Vanosmael, Claeys, Vincx and Heip1982a, Reference Willems, Vincx, Claeys, Vanosmael and Heipb; Vanosmael & Heip, Reference Vanosmael and Heip1986; Vanaverbeke et al., Reference Vanaverbeke, Gheskiere and Vincx2000, Reference Vanaverbeke, Gheskiere, Steyaert and Vincx2002; Dewicke et al., Reference Dewicke, Vincx, Cattrijsse and Mees2003) or on the more extensive Dogger Bank (e.g. Kröncke & Knust, Reference Kröncke and Knust1995; Kröncke & Wieking, Reference Kröncke and Wieking2003; Wieking & Kröncke, Reference Wieking and Kröncke2005), which is easier to sample.
Although there have been several general overviews of north-east Atlantic benthic communities (e.g. Jones, Reference Jones1950; Glémarec, Reference Glémarec1973), these have not differentiated the fauna of sandbanks from the more general sandy sediment communities on the inner continental shelf. The benthic community on the Dogger Bank has been described as a Bathyporeia–Fabulina (=Tellina) association (Wieking & Kröncke, Reference Wieking and Kröncke2005), and Tyler & Shackley (Reference Tyler, Shackley, Collins, Banner, Tyler, Wakefield and James1980) considered sandbanks in the Bristol Channel to comprise a modified Spisula sub-community. Not only must those species that occur on sandbanks be able to adapt to local hydrodynamic conditions, but they are likely to also need a specialized trophic niche. Studies of the benthic macrofauna of the shallower parts of the Dogger Bank (18–32 m) have indicated that interface feeders (e.g. Spiophanes bombyx, Magelona johnstoni, Tellina fabula and Amphiura brachiata) and sand-licking amphipods (e.g. Bathyporeia elegans, B. guilliamsoniana, B. tenuipes and Urothoe poseidonis) are the predominant feeding guilds (Wieking & Kröncke, Reference Wieking and Kröncke2005), although other trophic guilds may be represented (e.g. the predatory Euspira pulchellus). Some of these species were also found on the Swarte and Broken Banks, although the brittlestar Amphiura brachiata and other amphiurids were not observed in the present study. The macro-infauna occurring on the offshore North Norfolk sandbanks is generally comparable to that of the Dogger Bank and sandbanks in Belgian coastal waters (e.g. Moulaert & Hostens, Reference Moulaert and Hostens2007), and many of the infaunal species observed are widely distributed in the southern North Sea (Rees et al., Reference Rees, Eggleton, Rachor and Vanden2007). The epifaunal species observed were similar to other sandy habitats occurring in the southern North Sea (e.g. Ellis & Rogers, Reference Ellis and Rogers1999) and other parts of the British Isles, albeit with a reduced species diversity (Ellis et al., Reference Ellis, Maxwell, Schratzberger, Warr and Rogers2007).
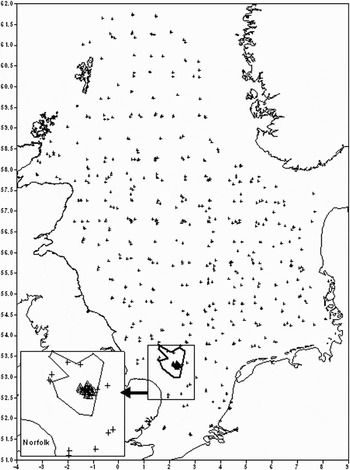
In recent years there have been several broadscale surveys of the epibenthos of the North Sea (Jennings et al., Reference Jennings, Lancaster, Woolmer and Cotter1999; Zühlke et al., Reference Zühlke, Alvsvåg, de Boois, Ehrich, Cotter, Ford, Hinz, Jarre-Teichmann, Jennings, Kröncke, Lancaster, Piet and Prince2001; Callaway et al., Reference Callaway, Alsvåg, de Boois, Cotter, Ford, Hinz, Jennings, Kröncke, Lancaster, Piet, Prince and Ehrich2002), however these surveys only provided few samples (from sites 21–27 m deep) from the present study area (Figure 7). The range of species collected by these surveys were broadly similar to that found in the present study, although they included some additional species records (see Appendix). These broad scale surveys, while providing a general overview of the fauna that are found on the North Norfolk sandbanks, are not able to provide faunal descriptions of a suitable quality for site-specific analysis.
Spatial coverage of 2 m beam trawl stations in the North Sea (+) indicating the low amount of sampling in the vicinity of the North Norfolk sandbanks and in the North Norfolk Sandbanks and Saturn Reef candidate SAC (inset), prior to the current sampling (Δ).

Samples from the 2 m beam trawl generally yielded fewer mobile species on the tops of sandbanks (8–18 on the Broken Bank, and 9–14 on the Swarte Bank). In contrast, catches from off-bank sites were more speciose (13–21 and 17–29 off the Swarte and Broken Banks, respectively), and had a larger number of individuals. Although the off-bank sites had the richest and most diverse fauna, evenness was slightly greater on the top of the banks. Lesser weever was more abundant on the top of the sandbanks than at off-bank sites, and the length–frequency of lesser weever caught on the top of the sandbanks included a cohort of small fish 24–39 mm LT, which was not observed at off-bank sites. Given that lesser weever leave the plankton at 13–15 mm (Russell, Reference Russell1976), these sandbanks may serve as an important nursery ground for this species. Sandbank habitats may be an important habitat for lesser weever, as they bury into sandy sediments, and are ambush predators feeding on crangonids and other hyperbenthic crustaceans (Ellis, unpublished data). Other fish species for which early life history stages were observed on the sandbanks included solenette (30–50 mm LT) and scaldfish (46–62 mm LT), and these species leave the plankton at approximately 10 mm and 16–30 mm, respectively (Russell, Reference Russell1976). Further studies on the use of sandbanks by early life-history stages are required, in order to determine whether there is increased recruitment to such habitats, with fish descending to deeper water as they increase in size. This would mimic the distribution pattern frequently displayed by many other juvenile fish species in coastal waters (Heinke's law), but there is little evidence that this can operate further offshore and over such a small scale.
In terms of biodiversity, sandbanks are often species-poor (e.g. Wilson, Reference Wilson and Stride1982; Kaiser et al., Reference Kaiser, Bergmann, Hinz, Galanidi, Shucksmith, Rees, Darbyshire and Ramsay2004), although there is a greater diversity on the habitats and substrates surrounding the banks. This was evident in both the epifaunal and macro-infaunal assemblages sampled during the present study, although a contrasting pattern was observed with nematode communities, which were species-rich on the tops of the banks. Although species diversity of larger fauna was lower on the tops of sandbanks, certain epifaunal species (C. crangon and lesser weever) and macro-infaunal species (Bathyporeia elegans and Urothoe brevicornis) were more abundant on the banks than at off-bank sites. The increased diversity of macro-infauna and epifauna at off-bank sites may be attributable to an increased diversity of micro-habitats in such areas, both in terms of seafloor topography and sediment composition. For example, although the sediments at off-bank sites still comprised primarily sand, there was an increased occurrence of both finer and coarser sediment types. It should be noted, however, that the distribution and relative abundance of meiofauna seemed to be influenced by subtle differences in sediment composition and this will be examined in more detail in a subsequent paper (Schratzberger et al., in preparation). No targeted sampling was undertaken on the steeper slopes of the sandbanks, and future studies could usefully examine the faunal communities on the lee and stoss slopes of such habitats.
Kaiser et al. (Reference Kaiser, Bergmann, Hinz, Galanidi, Shucksmith, Rees, Darbyshire and Ramsay2004) recently undertook both 2 m and 4 m beam trawling on sandbanks in Welsh waters. This study highlighted that both species diversity and the number of individuals was lower on distinct sandbanks than on those sandbank-like habitats that were considered to be extensions of inshore sandy habitats, and our results would support this view. Many of the species that we observed on the Swarte and Broken Banks were reported to be important components of the epifaunal communities of sandbanks in Welsh waters (Kaiser et al., Reference Kaiser, Bergmann, Hinz, Galanidi, Shucksmith, Rees, Darbyshire and Ramsay2004), including Urothoe sp., Pagurus bernhardus, Liocarcinus holsatus, Asterias rubens, E. vipera, Ammodytes tobianus and Pomatoschistus minutus. Species recorded by Kaiser et al. (Reference Kaiser, Bergmann, Hinz, Galanidi, Shucksmith, Rees, Darbyshire and Ramsay2004) as being important on sandbanks that were not recorded in the present study included greater sand eel Hyperoplus lanceolatus, sand sole Pegusa lascaris and the shrimp Philocheras trispinosus. The absence of sand sole from our study is to be expected, as this species has a south-western distribution.
Many of the fish and benthic species observed on the sandbanks are widely distributed in other sandy habitats on the continental shelf, and the fauna of sandbank communities may simply be based on a specialized niche of the sand-associated fauna of the region. None of the taxa observed in the present study would seem to be obligate sandbank species and occur on other sandy habitats, as also reported in other regions (Kaiser et al., Reference Kaiser, Bergmann, Hinz, Galanidi, Shucksmith, Rees, Darbyshire and Ramsay2004). However, certain taxa (e.g. E. vipera) may be locally abundant and potentially indicative of such habitats. The presence of ambush predators on the tops of sand ridges has also been observed in the north-west Atlantic, where species such as Astroscopus guttatus (Uranoscopidae) and Trachinocephalus myops (Synodontidae) are an important component of the sand ridge ichthyofauna (Vasslides & Able, Reference Vasslides and Able2008). The topographic features of sandbank habitats may create local hydrodynamic mechanisms that concentrate planktonic larvae (Ma et al., Reference Ma, Grassle and Chant2006), which could explain both the importance of sandbanks habitats as settlement and nursery grounds, but also the abundance of those ambush predators that can retain their position in sites of potentially high velocity water movement by burying into the sediment.
Sandbanks are also topographically complex habitats, and further studies to examine the fine scale distribution and microhabitat use of certain species would clearly improve our understanding of the dynamics of the sandbank ecosystem. Indeed, certain species or life-history stages of fish may select specific microhabitats associated with sandy substrates (e.g. sand waves, ribbons, ripples and sand patches with emergent fauna), whether for shelter or trophic interactions (Auster et al., Reference Auster, Malatesta and LaRosa1995, Reference Auster, Lindholm, Schaub, Nowak, Funnell, Kaufman and Valentine2003; Diaz et al., Reference Diaz, Cutter and Able2003; Vasslides & Able, Reference Vasslides and Able2008).
Overall, 20 fish species were recorded during the survey, although more species are likely to occur in the area. The use of additional fish sampling techniques (e.g. longline and gillnet) is required to determine which larger piscivorous fish forage around offshore sandbanks. Several large-bodied piscivorous fish species (e.g. cod, spurdog, tope, turbot and bass) are taken in the general area (see below) and further studies to examine whether sandbanks are important feeding grounds or topographic features for such species are required. Future sampling should also be undertaken at different tidal states, as the behaviour of both fish and invertebrates may vary depending on tidal state and currents (e.g. Medved & Marshall, Reference Medved and Marshall1983; Michalsen et al., Reference Michalsen, Godoe and Fernoe1996; Jumars & Sato, Reference Jumars and Sato2008).
Commercial fishing by English vessels in the area of the North Norfolk sandbanks (ICES Rectangle 35F2) is relatively low (reported annual landings of 2–16 t for the period 2002–2007). The main species harvested from the general area include whelk Buccinum undatum, plaice, spurdog, edible crab and cod (Table 10), and although a variety of gears have been recorded (e.g. beam trawl, otter trawl, gillnet, pots and longline), the main commercial species in the area can be taken in static gears.
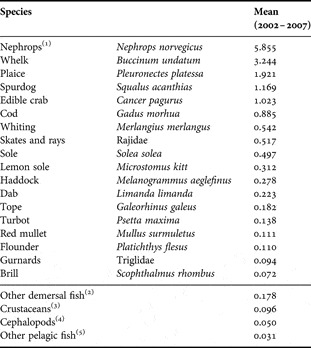
Mean annual landings (tonnes) of commercial fish and shellfish from ICES Rectangle 35F2 by UK-registered fishing vessels (2002–2007).

(1)Although there are reported landings of Nephrops, this species occurs on muddy substrates and are outside of the study area.
(2)Including halibut Hippoglossus hippoglossus, anglerfish Lophius piscatorius, witch Glyptocephalus cynoglossus, ling Molva molva, hake Merluccius merluccius, pout Trisopterus spp., bass Dicentrarchus labrax and John Dory Zeus faber.
(3)Including spider crab Maja squinado, and lobster Homarus gammarus.
(4)Including octopus, cuttlefish and squid.
(5)Including mackerel Scomber scombrus, scad Trachurus trachurus and grey mullet (Mugilidae).
There is a lack of historical data on the fauna of these sandbanks, and so it is not possible to determine whether there have been any long-term temporal changes in the benthic communities, or how they have responded to human activities. Although early workers such as Davis (Reference Davis1925) collected samples in many parts of the southern North Sea, this study had only a low number of samples from ICES Rectangle 35F2. As these samples were collected with a different gear and from east of the Swarte and Broken Banks (in waters of >27 m depth), the data are not comparable.
Macrobenthic infauna particularly polychaetes, act as an important food resource for commercially important flatfish such as plaice Pleuronectes platessa and sole Solea solea (e.g. Amezcua et al., Reference Amezcua, Nash and Veale2003). However, such fauna are themselves vulnerable to fishing, and trawling disturbance can affect the species composition, structure and production of infaunal communities (Jennings et al., Reference Jennings, Dinmore, Duplisea, Warr and Lancaster2001). Larger benthic fauna (e.g. larger bodied bivalves, polychaetes and spatangoids) can suffer a higher mortality rate through crushing and capture than smaller bodied organisms. Analyses by Jennings et al. (Reference Jennings, Nicholson, Dinmore and Lancaster2002) in the North Sea showed that production of small infauna or polychaetes was not significantly affected at trawling frequencies of 0.35–6.14 times yr−1, although the biomass of larger infauna over similar trawling frequencies decreased by an order of magnitude, and production decreased 6-fold. Given the absence of historical data, it is not possible to identify whether the study site has been affected by human activities. In terms of the vulnerability of the sandbank fauna to fishing, most of the bivalves observed in the present study were small-bodied species (e.g. Tellimya, Abra and Tellina), which may be less impacted by fishing disturbance, and few sessile filter-feeders (e.g. hydroids and bryozoans) were observed, possibly as a result of the turbidity and/or lack of appropriate substrate on which to settle. However, spatangoids (e.g. Echinocardium cordatum) and colonies of Sabellaria spinulosa were observed in the study area, the latter recorded exclusively from off-bank sites and such taxa are known to be susceptible to trawl disturbance (Bergman & van Santbrink, Reference Bergman, van Santbrink, Kaiser and de Groot2000). However, it should be recognized that many of the main commercial species in the area would be targeted with static gears, such as pots (e.g. whelk and edible crab) or longline (e.g. spurdog, cod and skates), and such gears are less damaging to the seafloor and will have a lower impact on the physical structure and integrity of sandbank habitats.
ACKNOWLEDGEMENTS
We would like to thank the scientists and crew of ‘Cefos Endeavour’ for their assistance at sea, and Freya Goodsir for practical assistance with provision of infaunal biomass data. Thanks to Irene Gooch and Mary Brown for their assistance with figures, and the referees for their constructive comments. This work was supported by the Department for Environment, Food and Rural Affairs (research project AE1148).
Taxonomic list of the marine fauna of the Broken and Swarte Banks (bank and off-bank habitats) taken during meiofaunal (M) and infaunal (G) sampling from 0.1 m2 Day grab, 2 m beam trawl (T) and 4 m beam trawl (B). Species not observed in present study but recorded in prior 2 m beam trawl surveys (see Callaway et al., Reference Callaway, Alsvåg, de Boois, Cotter, Ford, Hinz, Jennings, Kröncke, Lancaster, Piet, Prince and Ehrich2002) are denoted T*.