Introduction
In everyday life, one has to attend selectively to certain features in the environment while ignoring or actively suppressing others. For example, driving a car in a busy intersection, one has to spot a pedestrian stepping off the curb while ignoring other visual distracters, such as billboards. A reduction in selective attention would place a person at risk for handling such complex environments. Following a traumatic brain injury (TBI), reduction in selective attention could be related to patients’ complaints (even years following TBI) about poor concentration (e.g., Dikmen, Machamer, Fann, & Temkin, Reference Dikmen, Machamer, Fann and Temkin2010; Oddy, Coughlan, Tyerman, & Jenkins, Reference Oddy, Coughlan, Tyerman and Jenkins1985), difficulties in new learning (Kinsella et al., Reference Kinsella, Prior, Sawyer, Ong, Murtagh, Eisenmajer and Klug1997; Kinsella, Reference Kinsella1998), or speech perception (Ben-David, Van Lieshout, & Leszcz, Reference Ben-David, Van Lieshout and Leszcz2011). It is clear that correctly assessing limitations in selective attention is an important step in rehabilitation efforts for TBI patients. However, while there is a consensus in the literature that TBI affects concentration and attention-related performance (Oddy et al., Reference Oddy, Coughlan, Tyerman and Jenkins1985), there is an ongoing debate on the nature of the mechanisms underlying this behavioral deficit and whether there are true deficits in focused (selective) attention (e.g., Ponsford & Kinsella, Reference Ponsford and Kinsella1992vs. Batchelor, Harvery, & Bryant, Reference Batchelor, Harvery and Bryant1995). Those who maintain there is a real attention deficit caused by TBI, claim it is either related to general attention resources (Schmitter-Edgecombe, Reference Schmitter-Edgecombe1996), or more specifically to the ability to focus attention or inhibit irrelevant resources (Park, Moscovitch, & Robertson, Reference Park, Moscovitch and Robertson1999). Others consider deficits in selective attention following TBI as secondary to a general slowdown in speed of processing (SOP, e.g., Madigan, DeLuca, Diamond, Tramontano, & Averill, Reference Madigan, DeLuca, Diamond, Tramontano and Averill2000). This debate on selective attention was guided by an analysis of the color-word Stroop (Reference Stroop1935) test, the most common tool used to test selective attention with TBI patients, in both clinical and experimental settings. Recently, the central role of the Stroop test in neuropsychological assessments of TBI patients was reaffirmed by the TBI Clinical Trial Network (Bagiella et al., Reference Bagiella, Novack, Ansel, Diaz-Arrastia, Dikmen, Hart and Temkin2010). This is no surprise, as the Stroop test has been taken as the “gold standard” for assessing selective attention in the past 75 years (for relevant reviews see, MacLeod, Reference MacLeod1991, Reference MacLeod1992; Melara & Algom, Reference Melara and Algom2003). The rationale for using this test and how it is used will be explained next.
Can differences in Stroop interference reflect TBI-related differences in selective attention?
The Stroop test includes at least two tasks: (1) color-naming neutral stimuli (Cn), that is, naming the font color of a stimulus unrelated to color (e.g., blue colored rectangles); and (2) color-naming incongruent stimuli (Ci), that is, naming the font color of a color-word, where the lexical content is mismatched with the print color (e.g., the word RED printed in blue). If an individual can focus exclusively on the font color while ignoring the lexical content, no difference in reaction times (RT) between Ci and Cn tasks should occur. On the other hand, if an individual cannot selectively attend to the font color, responding “blue” to RED printed in blue (Ci) should take longer than responding “blue” to a blue-colored patch (Cn). This effect is termed Stroop Interference (SI):

Significant positive SI values have been found for both healthy and patient populations (e.g., MacLeod, Reference MacLeod1991). However, an increase in the magnitude of SI for TBI patients, when compared to their age-appropriate controls, is generally interpreted as indicating a decrease in selective attention (e.g., Goethals et al., Reference Goethals, Audenaert, Jacobs, Lannoo, Van de Wiele, Ham and Dierckx2004). Correspondingly, studies that failed to find differences in the magnitude of Stroop effects (SI, or other measures), concluded that selective attention is not impacted following TBI (e.g., Ettenhofer & Abeles, Reference Ettenhofer and Abeles2009).
Brain Imaging, Stroop, and TBI
To deal with these inconsistencies in behavioral data, other researchers have tried to identify differences in Stroop performance at the level of neural processes using different imaging techniques. In healthy participants, fMRI studies showed that brain activations uniquely related to Stroop performance are mainly located in the dorsolateral prefrontal cortex (DLPC) and the anterior cingulate cortex (ACC; e.g., MacDonald, Cohen, Stenger, & Carter, Reference MacDonald, Cohen, Stenger and Carter2000). Both regions are known to be involved in processes critical to performance in the Ci task: active cognitive control over behavior (DLPC, Petrides, Reference Petrides2005), detection of interference, and selective attention (ACC, Bush, Luu, & Posner, Reference Bush, Luu and Posner2000). In contrast, an fMRI study by Mani, Miller, Yanasak, and Macciocchi (Reference Mani, Miller, Yanasak and Macciocchi2007) found activations for TBI patients in a Stroop task both inside and outside of the DLPC and ACC. The authors concluded that “recruitment of outside regions was necessary for successful task completion” (p. 235).
Their results correspond to other imaging studies on Stroop and TBI patients, showing that, while the ACC was less activated, regions outside the ACC were more activated, compared to controls (Goethals et al., Reference Goethals, Audenaert, Jacobs, Lannoo, Van de Wiele, Ham and Dierckx2004; Soeda et al., Reference Soeda, Nakashima, Okumura, Kuwata, Shinoda and Iwama2005).
Differential brain activation for Stroop may be related to diffuse axonal injury (DAI), a possible consequence of TBI (mainly in moderate to severe TBI, Gennarelli, Thibault, & Graham, Reference Gennarelli, Thibault and Graham1998). Generally, TBI results in shearing of white matter pathways, largely in subcortical white matter tracts, some of which are association fibers connecting different cortical regions (Stuss & Gow, Reference Stuss and Gow1992). This leads to a reduced interconnectivity between anatomical regions and associated networks. The recruitment of extra areas in the brain may represent a compensation mechanism, related to the impact of lesions and/or limited connectivity in and between the regions of interest.
Analysis of event-related potentials (ERP) during Stroop task performance also highlights differences between healthy controls and TBI participants. Waves typically associated with Ci trials in healthy controls (e.g., N450, West, Reference West2003) were not identified for persons with TBI (Perlstein, Larson, Dotson, & Kelly, Reference Perlstein, Larson, Dotson and Kelly2006). The authors claimed that this was related to their inability to “rapidly detect the response conflict” in Ci (p. 270). Spikman, Van der Naalt, Van Weerden, and Van Zomeren (Reference Spikman, Van der Naalt, Van Weerden and Van Zomeren2004) also found delays in latencies for the N2 and P3 waves for TBI patients during the Stroop task, reflecting a slower evaluation process of the stimuli (Campbell & de Lugt, Reference Campbell, de Lugt, Johnson and Baron1995; Clark, O'Hanlon, Wright, & Geffen, Reference Clark, O'Hanlon, Wright and Geffen1992).
In summary, there are indications from neuroimaging studies that TBI patients may process stimuli in Stroop tasks differently from controls. These neural differences may underlie behavioral group differences in Stroop effects. However, since TBI encompasses various idiosyncratic damages to the brain, it is not clear whether these differences in brain activation reflect a difference in selective attention, or in other processes that may generate such behavioral differences. One of these alternate processes is speed of processing (SOP), discussed next.
Can differences in SI reflect TBI-related changes in cognitive slowing?
SOP can provide an alternative explanation to the TBI-related increase in SI (e.g., Ponsford & Kinsella, Reference Ponsford and Kinsella1992; Ríos, Periáñez, & Muñoz-Céspedes, Reference Ríos, Periáñez and Muñoz-Céspedes2004). In a generalized cognitive slowing framework, latencies on all tasks should increase to the same extent (cf., Cerella, Reference Cerella, Birren and Schaie1990), that is,

where b reflects generalized slowing of central cognitive processes (a is estimated to be not significantly different from zero, see Cerella & Hale, Reference Cerella and Hale1994). If Eq. 2 holds for both Cn and Ci tasks, then,
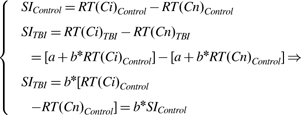
Since b is larger than 1, a larger SI for TBI patients derives directly from Eq. 3irrespective of changes in selective attention following TBI. On the other hand, if there is a real difference in selective attention, the slope for Ci should be larger than the slope for Cn, since only Ci involves selective attention (ignoring the text while focusing on the font color), whereas none is required for Cn.
SOP and TBI
The literature provides ample evidence on SOP slowdown following TBI (e.g., Ponsford & Kinsella, Reference Ponsford and Kinsella1992; Zahn & Mirsky, Reference Zahn and Mirsky1999), specifically after severe trauma. A Brinley (Reference Brinley, Welford and Birren1965) analysis by Ferraro (Reference Ferraro1996), in which latencies for TBI patients on a task were plotted as a function of latencies for controls on the same task, was the “lightning rod to spark the debate” (Bashore & Ridderinkhof, Reference Bashore and Ridderinkhof2002, p. 151) on SOP. Ferraro found that a single linear function (similar to our Eq. 2) could relate latencies on different tasks for TBI patients to latencies for controls (on the same tasks), supporting the notion of a central slowdown that applies to all tasks equally (see Veltman, Brouwer, Van Zomeren, & Van Wolffelaar, Reference Veltman, Brouwer, Van Zomeren and Van Wolffelaar1996). Changes in SOP have been linked to DAI following TBI, where cell loss causing indirect neural transmission, reduced interconnectivity (Zahn & Mirsky, Reference Zahn and Mirsky1999), and the loss of myelination could potentially slow transmission and processing (Miller, Reference Miller1994). Alternatively, Timmerman and Brouwer (Reference Timmerman and Brouwer1999) suggested slowing as the result of a reduced spread of activation within a semantic memory network following TBI.
This TBI-related cognitive slowdown can be related to Stroop. Studies that controlled for SOP differences between TBI and control groups found no residual group differences in Stroop effects (Ríos et al., Reference Ríos, Periáñez and Muñoz-Céspedes2004; Spikman, Van Zomeren, & Deelman, Reference Spikman, Van Zomeren and Deelman1996), suggesting that SOP may play a central role in explaining differences in Stroop performance. However, SOP is not the only mediator related to the Stroop task. Recall that Ci involves a conflict between the lexical content of the word and its print color. The difference between these processes is addressed next as a potential source for the TBI-related increase in SI.
Can differences in SI reflect TBI-related changes in color-naming?
Melara and Algom (Reference Melara and Algom2003) proposed that SI can be the outcome of faster access to the long-term memory representation of the color word than to the representation of the font color. Reading a printed word (in a clear font) is generally a faster and more practiced process than naming the color of an object (see Posner & Snyder, Reference Posner, Snyder and Solso1975). Just think of how many times a day one is engaged in reading versus naming colors aloud. Take for example color-naming the word RED printed in blue (Ci). The activation of the red lexical-code (reading) is faster than the activation of the blue color-code (color-naming), thus, participants have to inhibit the lexical (“red”) response until sufficient activation for the color (“blue”) response is accrued and a SI ensues. An increase in the dimensional imbalance (DI) between access to the print color and to the lexical content will result in an increased inhibition time and hence, SI. In contrast, if there is a minimal DI between access to the lexical- and the color-code, SI would be minimal, given the limited competition between responses. An estimate of DI can be derived from the latency difference between color-naming a color-neutral stimulus (e.g., blue X's) and reading a color-neutral word (Rn, e.g., BLUE printed black on white),

In support of the competition claim, two separate meta-analyses found a significant positive correlation between DI and Ci (Melara & Algom, Reference Melara and Algom2003; Ben-David & Schneider, Reference Ben-David and Schneider2009). Similarly, several studies found that by direct experimental manipulations of DI, Stroop effects are malleable. Decreasing the DI, by increasing Rn (minimizing font size), resulted in a decrease (Sabri, Melara, & Algom, Reference Sabri, Melara and Algom2001) or elimination (Eidels, Townsend, & Algom, Reference Eidels, Townsend and Algom2010) of SI; increasing the DI, by increasing Cn (diluting colors) resulted in an increase in SI (Ben-David & Schneider, Reference Ben-David and Schneider2010).
DI and TBI
Visual degradation related to TBI vary in prevalence, and may act to either decrease individual DI values, or increase them. TBI patients have been reported to suffer from blurry vision (Dikmen et al., Reference Dikmen, Machamer, Fann and Temkin2010) and reading problems related to oculomotor deficits (e.g., re-reading words and reduced reading speed; Kapoor & Ciuffreda, Reference Kapoor and Ciuffreda2002), leading to a possible decrease in DI. However, specific lesions in the right extrastriate cerebral regions have been related to color-vision impairment (Koh et al., Reference Koh, Kim, Lee, Suh, Kim and Kim2008) that could lead to a slower Cn, and thus to an increased DI. Given this variety of possible symptoms associated with TBI, it is not clear whether a DI estimate averaged for a group of heterogeneous TBI patients would be different than the average for control groups.
Next, we outline how our study examines the DI account alongside the SOP and the selective attention accounts for TBI-related changes in Stroop. Our analysis is informed by a parallel discussion on Stroop effects in the literature on aging, and the methodologies presented there to examine DI (Ben-David & Schneider, Reference Ben-David and Schneider2009, Reference Ben-David and Schneider2010), SOP (Verhaeghen & Cerella, Reference Verhaeghen and Cerella2002) and selective attention (McDowd & Shaw, Reference McDowd, Shaw, Craik and Salthouse2000) as potential sources for group differences.
Current study
Most research using Stroop tasks with TBI patients is based on the premise that larger Stroop effects in this population reflect a unique deficit in selective attention. The goal of this study was to explore two alternative explanations to TBI-related differences in SI, viz. changes in SOP or changes in the DI between reading and color-naming. Noting that TBI-related increase in Stroop interference might be exclusive to moderate-severe TBI patients (Bohnen, Jolles, & Twijnstra, Reference Bohnen, Jolles and Twijnstra1992) we excluded studies that tested individuals with mild TBI. We compared data from paired groups of persons with moderate-severe TBI and healthy matched controls, collected from 10 different studies. In the first step, we tested whether there is a consistent difference in SI between TBI and control groups in this sample of studies. A Brinley analysis was used to test whether an increase in generalized SOP can account for an increase in SI following TBI across studies. A single linear function (Eq. 2), that governs TBI-related latency increase for both Ci and Cn, will support the SOP account. In contrast, a steeper slope for Ci would support the selective attention account. Next, we examined the differences in DI between groups in a subset of studies that provided the relevant data. A consistent increase in DI following TBI would support the increased competition account, its lack thereof, refute it. Finally, we compared the effect of TBI-related changes in DI and in SOP on Stroop performance.
Method
Sample of Studies for Analysis
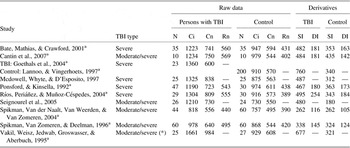
Studies were collected (in October 2010) by consulting electronic databases (Scopus, PubMed, and PsychInfo), and by reviewing the references in the retrieved articles, dating back to 1985. We selected only studies that included: (a) data for both a group of persons with moderate-severe TBI (as measured by a maximum Glasgow scale value after stabilization of 14, and a minimum duration of post-traumatic amnesia of 1 day, see Forrester, Encel, & Geffen, Reference Forrester, Encel and Geffen1994) and a group of healthy controls without TBI (matched for age and gender); and (b) measures of Cn, naming aloud the font color of color patches (or string of X's printed in color), and of Ci, naming aloud the font color of incongruent color-words (e.g., RED printed in blue). Of 57 Stroop and TBI studies, 10 studies met the criteria. They can be found in Table 1, along with some of their characteristics. A subset of six of these studies also included a measure for Rn, reading aloud color-words printed in black (e.g., RED printed black on white). In the examined studies, the authors reported that patients were tested in the chronic stage, but the average duration post-injury ranged from months to years. Post-injury duration may have an impact on cognitive performance (e.g., Sbordone, Liter, & Pettler-Jennings, Reference Sbordone, Liter and Pettler-Jennings1995). However, in a direct comparison, Bate, Mathias, and Crawford (Reference Bate, Mathias and Crawford2001, a study used in our analysis) found no significant differences in Stroop performance between a group of patients tested, on average, seven month post-injury and a group tested, on average, 5 years post-injury. Similarly, in a longitudinal study of TBI patients, Christensen et al. (Reference Christensen, Colella, Inness, Hebert, Monette, Bayley and Green2008) reported that individual Stroop performance did not vary substantially post-injury.
Data extracted from the 10 TBI and control groups, as used in our meta-analysis

Note: Data represent latencies in milliseconds. N = number of participants; Ci = color-naming an incongruent color-word; Cn = color-naming a color-neutral stimulus; Rn = reading a color-neutral word; SI (Stroop interference) = Ci–Cn; DI (dimensional imbalance) = Cn–Rn.
aStudies that provided standard deviations; (*) Out of the 25 patients, one was a mild TBI.
Data Processing
From each of the 10 studies, we retrieved data to represent one group of persons with TBI and one group of healthy controls. These groups formed a total of 825 participants: 324 TBI patients and 501 controls. The data from each condition (Ci, Cn, or Rn) were averaged to represent the mean response time per item. When data were reported in an item-per-time scale they were converted to a time-per-item scale.Footnote 1 There were differences among the studies that need further clarification. As mentioned above, Bate et al. (Reference Bate, Mathias and Crawford2001) presented data for two TBI groups (based on the duration since the injury); the data in Table 1 is a weighted average of the different groups. In the Seignourel et al. (Reference Seignourel, Robins, Larson, Demery, Cole and Perlstein2005) study, we have included only the data from the moderate-severe TBI group; the corresponding values were read off the graph (from Seignourel et al., Figure 2, p. 583), in the absence of tabular latency data. Ponsford and Kinsella (Reference Ponsford and Kinsella1992) used orthopedically injured participants with no history of TBI, as matched healthy controls. Details on the data of the latter study were obtained by personal communication with the first author. Two studies used translated versions of the Stroop test: Goethals et al. (Reference Goethals, Audenaert, Jacobs, Lannoo, Van de Wiele, Ham and Dierckx2004) compared the performance of TBI patients on a Dutch version of the Stroop task with the data of healthy controls taken from a different study (Lannoo & Vingerhoets, Reference Lannoo and Vingerhoets1997; the original study was obtained by personal communication with the second author of that study); Vakil, Weisz, Jedwab, Groswasser, & Aberbuch (Reference Vakil, Weisz, Jedwab, Groswasser and Aberbuch1995) used a Hebrew version. Note, unlike the Dutch and the English version, the Hebrew version does not use Latin letters, however they are all in an alphabetic form.
Data Analysis
To compare latencies between TBI and control groups across studies, we conducted Wilcoxon signed rank non-parametric test, as we cannot be certain that the data from these populations are always normally distributed. DI was tested with data from six studies that provided Rn values as well as values for Cn and Ci (see Table 1). To verify effect sizes, weighing-in the variance of the means within each study, the number of participants, and the possibility that studies that did not find significant effects were not published, the analysis of group differences was complemented by a meta-analysis of standardized effect sizes (with a syntax developed by Alferes, Reference Alferes2003), using Hedges’ g correction for publication bias (the possibility that studies that did not find the effect might not have been published, Hedges & Olkin, Reference Hedges and Olkin1985) on a subgroup of studies (seven for SI, and five for DI, indexed with a in Table 1) that provided standard deviations.Footnote 2 We used a mixed model, to account for external sources of variance between studies, such as duration since the injury. Similarly, when calculating regressions, we have included adjusted r2 statistics (adj-r 2) that take into account the effect of the sample size.
Results
TBI-Related Differences in SI
In the right-most panel of Table 1, we present the data on SI. Observe that in all but one study (Spikman et al., Reference Spikman, Van der Naalt, Van Weerden and Van Zomeren2004) the SI for the TBI groups was larger than for the control groups. Indeed, the average SI for all 10 TBI groups was significantly larger than for control groups (493 vs. 323 ms, Wilcoxon Z = 2.67; p = .008). This group difference was verified in a meta-analysis conducted on a subgroup of seven studies, attesting to the strength of its effect size.Footnote 3
Brinley Plots – Testing the SOP Account
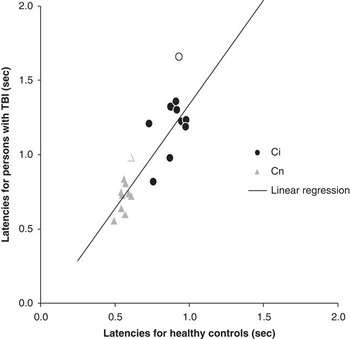
Figure 1 shows a Brinley analysis, plotting RT values of TBI groups as a function of RT values of control groups for Ci (circles) and Cn (triangles). First, it is clear from this plot that latencies for Cn were faster than latencies for Ci in both groups (hence, we can observe Stroop effects in both groups, SI > 0). Second, note that the unfilled data points, representing Vakil et al. (Reference Vakil, Weisz, Jedwab, Groswasser and Aberbuch1995), diverge from the groups’ mean (Z-score > 2.0 for both Ci and Cn ratios for Vakil et al., Reference Vakil, Weisz, Jedwab, Groswasser and Aberbuch1995). This may be related to the letter-type (Hebrew rather than Latin), and/or to the colors (the only study with six colors) used in that study (see Melara & Algom, Reference Melara and Algom2003, for a discussion on set size context). Therefore, we restricted the analysis to nine studies. To investigate whether a single function is sufficient to describe TBI-related differences in both tasks (following the SOP account), we fitted the following regression equation to the data:

A Brinley plot of latencies for color-naming neutral stimuli (Cn- triangles) and Color-naming incongruent words (Ci- circles) for 10 groups of persons with traumatic brain injury (TBI) as a function of similar latencies from 10 groups of matched controls. Unfilled symbols represent data from Vakil et al. (Reference Vakil, Weisz, Jedwab, Groswasser and Aberbuch1995), which were not used in the linear regression presented in the text.

We compared this four-parameter model to a two-parameter model in which the same slope (bn = bi) and intercept (a n = a i) were used for both conditions. Increasing the number of parameters from 2 to 4 did not result in a significant reduction in variance (F(2,14) = 1.0; p > .1). Therefore, the single linear regression line plotted in Figure 1 (r 2 = .81; adj-r 2 = .80; F(1,16) = 67.3; p < .001 with a significant slope of 1.4, t(16) = 8.2; p < .001, and an intercept that was not significantly different from zero, t(16) = .5; p > .1) is sufficient to describe the data for both tasks. In other words, approximately 80% of the variance in TBI-related differences in Stroop latencies can be explained by the SOP model, as both Ci and Cn values were increased for the TBI groups by approximately the same factor (1.4). Similar results were obtained in an analysis of all 10 studies (including Vakil et al., Reference Vakil, Weisz, Jedwab, Groswasser and Aberbuch1995).Footnote 4
Recall that if the cause of the TBI-related changes in SI was a reduction in selective attention, one would predict a larger slope for Ci than for Cn, since only the former task demands selective attention. As a single regression line is sufficient to explain the variance in both Ci and Cn (indicating no significant slope differences), the Brinley analysis does not support the selective attention hypothesis.
Testing the color-naming (DI) account
Turn again to Table 1. Observe that in all six studies, that provided Rn data, DI was larger for the TBI groups than for their paired control groups (averages of 176 vs. 148 ms; Wilcoxon Z = 2.2; p = .028). This TBI-related effect was replicated in a meta-analysis conducted on a subgroup of five studies, showcasing the reliability of this increase in DI across different studies and labs.Footnote 5
Figure 2, presenting group differences in Rn (RT(Rn)TBI– RT(Rn)Control) as a function of group differences in Cn (RT(Cn)TBI– RT(Cn)Control), demonstrates that the increase in DI was based on a larger TBI-related increase in color-naming latencies than in reading latencies (note the TBI-related increase in latencies for Rn and Cn in all studies). TBI-related differences on Rn were highly predictable by TBI-related differences on Cn (r 2 = .96; adj-r 2 = .95; F(1,4) = 97.5; p < .001, with a significant slope of .69 (t(4) = 9.9; p < .001, and an intercept that was not significantly different than zero, t(4) = 1.4; p = .2). Thus, the TBI-related increase in Rn was closely coupled with the increase in Cn, with around 30% difference in magnitude. These results suggest that persons with TBI may have to inhibit the lexical response for a longer time than their matched controls, before the color-code is correctly processed. This prolonged competition may contribute to the increase in Stroop effects for patients, supporting the DI account.
Differences in reaction times (RT) between traumatic brain injury (TBI) and control groups, for Rn (reading color-neutral words) as a function of Cn (color-naming neutral stimuli) in 10 Stroop and TBI studies.

Comparing the SOP with the color-naming (DI) account
The analysis so far provides support for both the SOP and the DI accounts for TBI-related differences in Stroop effects, but is at odds with the selective attention account. In this section, we compare the relative contribution of the SOP and DI accounts to TBI-related changes in Stroop. Stroop effects were measured using Ci latencies, since SI (Ci-Cn) is linearly related to both DI (Cn-Rn) and Cn. For the same reasons (and to maximize the number of studies), Cn was used as an estimate of SOP. These statistical restrictions are comparable to the literature (e.g., Ben-David & Schneider, Reference Ben-David and Schneider2009). The regression analysis on changes in Ci following TBI (RT(Ci)TBI– RT(Ci)Control) as a function of changes in DI (DITBI– DIControl) explains around 60% of the variance (r 2 = .62; adj-r 2 = .52; F(1,4) = 6.4; p = .064, with six studies that provide the relevant data). The regression analysis on TBI-related changes in Ci as a function of changes in Cn, explains around 50% of the variance (r 2 = .50; adj-r 2 = .44; F(1,8) = 8.1; p = .02, with all 10 studies). These correlations indicate that the separate contributions of DI and of Cn toward Ci are considerable and comparable (Z = .28; p = .6, using Fisher's Z transform). Hence, both the color-naming and the cognitive slowing accounts seem to contribute to changes in Stroop after TBI.
General discussion
In an overview and meta-analysis of 10 Stroop and TBI studies, we found consistently larger SI for TBI groups than for control groups. The different analyses reported here show no clear evidence to support TBI-related changes in selective attention as a significant source for this increase in SI. In contrast, a TBI-related slow-down in SOP may be a strong factor underlying the increase in Stroop effects. Since Stroop is the most common assessment tool for selective attention with TBI patients, both in the lab and in the clinic, it is advisable to consider controlling for SOP-related group differences. This might be done by either taking latencies for Cn and/or Rn (measures that are part and parcel of the Stroop test, see Ríos et al., Reference Ríos, Periáñez and Muñoz-Céspedes2004) as covariates for Stroop effects, or alternatively, by using other measures of SOP available in neuro-psychological assessment batteries (e.g., RBANS; Randolph & Strothkamp, Reference Randolph and Strothkamp1988) as covariates.
Our study also reports for the first time (to our knowledge) that color-naming latencies increased more than reading latencies for TBI groups. This increased imbalance is consistent with Bashore and Ridderinkhof's (2002) speculation that TBI would have a stronger impact on non-lexical than on lexical dimensions. In our study, this increase was also found to contribute significantly to the TBI-related increase in Ci, suggesting that increased competition between retrieval of the color- and the lexical-code for TBI patients may inflate SI (see Ben-David & Schneider, Reference Ben-David and Schneider2009, Reference Ben-David and Schneider2010, for studies on aging in this respect). Future studies are needed to further investigate deteriorations in functions (both sensory and cognitive) that may explain TBI-related changes in DI. However, users of the Stroop test should always be mindful of idiosyncratic changes in vision (not only color-vision) and in color-naming following TBI (and test for them). One may also consider employing other measures to gauge changes in selective attention (or executive function) that do not depend on color-vision, such as the Attention Network Test (Fan, McCandliss, Sommer, Raz, & Posner, Reference Fan, McCandliss, Sommer, Raz and Posner2002; see Halterman et al., Reference Halterman, Langan, Drew, Rodriguez, Osternig, Chou and van Donkelaar2006, for an example with TBI patients) that measures latencies for direction decisions of a central arrow, that is flanked by either incongruent arrows or neutral stimuli.
Two alternative scores for SI were used in the literature to gauge Stroop performance with TBI patients, Golden's Stroop and Ci. Golden's (1978) interference score (using predicted color-word scores) is occasionally applied in studies (3 of the 10 examined studies) to control for changes in Cn and Rn speed. Recent studies discussed two main shortcomings of this score (e.g., Lansbergen, Kenemans, & Van Engeland, Reference Lansbergen, Kenemans and Van Engeland2007; Perlstein, Carter, Barch, & Baird, Reference Perlstein, Carter, Barch and Baird1998; see also Balota et al., Reference Balota, Tse, Hutchison, Spieler, Duchek and Morris2010, on the use of blocked items on a card). First, Golden's interference score corrects for Cn and Rn to the same extent, underrating the DI between the two. Second, the item-per-time scale, used in all Golden's scores, may severely underestimate the size of group differences, which can be found after transformation to a time-per-item scale (see Table 1 in Lansbergen et al., Reference Lansbergen, Kenemans and Van Engeland2007, p. 252). We also note that many of the studies in the literature on Stroop and TBI used Ci to gauge selective attention rather than SI. Even though both SI and Ci may be affected by SOP and color-naming speed, there is a growing consensus in the Stroop literature that assessing selective attention must include a baseline measure for color-naming (e.g., Eidels et al., Reference Eidels, Townsend and Algom2010; MacLeod & MacDonald, Reference MacLeod and MacDonald2000; Melara & Algom, Reference Melara and Algom2003). Latencies for Ci reflect a joint influence of processing the color-code and inhibiting the rivaling lexical-code, whereas latencies for Cn merely reflect processing of the color-code. SI, the differences between Ci and Cn, can be taken as a more robust measure of selective attention than Ci alone.
Caveat
It is important to acknowledge other factors that can affect Stroop performance following TBI. Personality traits or mood disorders common in TBI patients, such as depression and anxiety, and the medication associated with them can have an impact on cognitive performance (see Rapoport, McCullagh, Shammi, & Feinstein, Reference Rapoport, McCullagh, Shammi and Feinstein2005). For example, post traumatic stress disorder and negative affect were directly linked with slower SOP and an increase in Stroop effects for TBI patients (Larson, Kaufman, Kellison, Perlstein, & Schmalfuss, Reference Larson, Kaufman, Kellison, Perlstein and Schmalfuss2009; Nelson, Yoash-Gantz, Pickett, & Campbell, Reference Nelson, Yoash-Gantz, Pickett and Campbell2009). As data on mood and medication was not consistently provided in the examined studies, we were not able to test their impact. We assume that the comorbidity of TBI and mood disorders was distributed across the examined studies. Our statistical analyses (meta-analysis of standardized effect sizes) was conducted to control for these external factors and others described earlier (e.g., post-injury duration). The consistent effects of SOP and DI across all studies attest to the external validity of our conclusions. However, it is possible that these effects were mediated by changes in mood (and/or medication) following a TBI.
Summary
An overview and meta-analysis of 10 studies showed that the Stroop color-word test, the most common tool used to assess selective attention with TBI patients, may be affected by TBI-related changes in speed of processing and sensory processing. Even though we found no evidence to support TBI-related changes in selective attention, we are not claiming that they do not occur. Rather, we demonstrate that one of the most important tools used today to assess selective attention may be biased. We suggest that in applying Stroop, it may be prudent to control for TBI-related changes in SOP, color-naming, and sensory factors (e.g., vision) to gauge changes in selective attention.
Acknowledgments
B.M. Ben-David was partially supported by a grant from the Ontario Neurotrauma Foundation (2008-ABI-PDF-659). This research was undertaken, in part, thanks to funding from the Canada Research Chairs program (303712CRC) awarded to P.H.H.M. van Lieshout.