Introduction
Dealloying, described by Sieradzki and Weissmüller in the Introductory article in this issue, can be generally defined as a materials-processing method, where one component is selectively dissolved from a multicomponent alloy.Reference Erlebacher and Seshadri1,Reference McCue, Benn, Gaskey and Erlebacher2 During dissolution, an interfacial pattern-forming instability can occur if the remaining component (or components) are mobile along the metal–liquid interface.Reference Erlebacher and Sieradzki3,Reference Erlebacher4 Rather than maintaining a planar interface, the remaining components reorganize into a three-dimensionally topologically complex morphology.Reference Erlebacher, Aziz, Karma, Dimitrov and Sieradzki5 The remaining nondissolved components have the morphology of an open, porous structure with a characteristic length scale on the order of 1 nm.Reference Erlebacher and Sieradzki3,Reference Sieradzki6 Dealloying has thus been used to create nanoporous metals, but bicontinuous composite materials can also be made by infiltration and solidification of a liquid.Reference Wada, Yubuta, Inoue and Kato7–Reference Geslin, McCue, Gaskey, Erlebacher and Karma9
Dealloying has, for most of its history, been studied in the context of electrochemistry, where it is an important process in corrosion as well as the facile fabrication of bulk quantities of nanostructured metals.Reference Zhang and Ding10–Reference Ding, Kim and Erlebacher12 One begins with a homogeneous, single-phase alloy and immerses it in an electrolyte solution, either under free corrosion or an applied potential. One of the components must dissolve in the electrolyte, and the other components must (with a few exceptions) remain unoxidized and mobile along the metal–electrolyte interface.Reference McCue, Benn, Gaskey and Erlebacher2,Reference Erlebacher4 As a consequence, most electrochemically dealloyable systems contain a relatively noble element such as gold, platinum, or copper—forming nanoporous gold (np-Au), or nanoporous platinum (np-Pt)—which are extremely useful for catalysis, sensing, and as model systems to study the mechanics of nanotrusses.Reference Snyder, Fujita, Chen and Erlebacher13–Reference Sun, Chen, Badwe and Sieradzki27
A transformative innovation, first reported by Harrison and Wagner 50 years ago, was recently rediscovered by Kato and Wada.Reference Wada, Yubuta, Inoue and Kato7,Reference Wada, Setyawan, Yubuta and Kato28,Reference Harrison and Wagner29 This breakthrough was that the dissolution medium does not need to be electrochemical in nature. The only requirement is selective dissolution of one component. As an example to follow this concept, we forged a TiTa alloy and immersed it in a bath of molten Cu.Reference McCue, Gaskey, Geslin, Karma and Erlebacher8,Reference Geslin, McCue, Gaskey, Erlebacher and Karma9,Reference McCue, Ryan, Hemker, Xu, Li, Chen and Erlebacher30 This system is chosen such that Ta and Ti form a solid solution; Ti is highly soluble in molten copper (up to 70 at.% at 1100°C); and Ta is insoluble in solid and molten copper (up to 1500°C). Upon immersion, Ti dissolves from the alloy, leaving behind porous Ta surrounded by molten Cu. A fully dense metal–metal composite is formed upon cooling, and porous Ta can be extracted if the copper is subsequently etched out—although our preference is the bicontinuous metal nanocomposite due to its superior mechanical behavior.
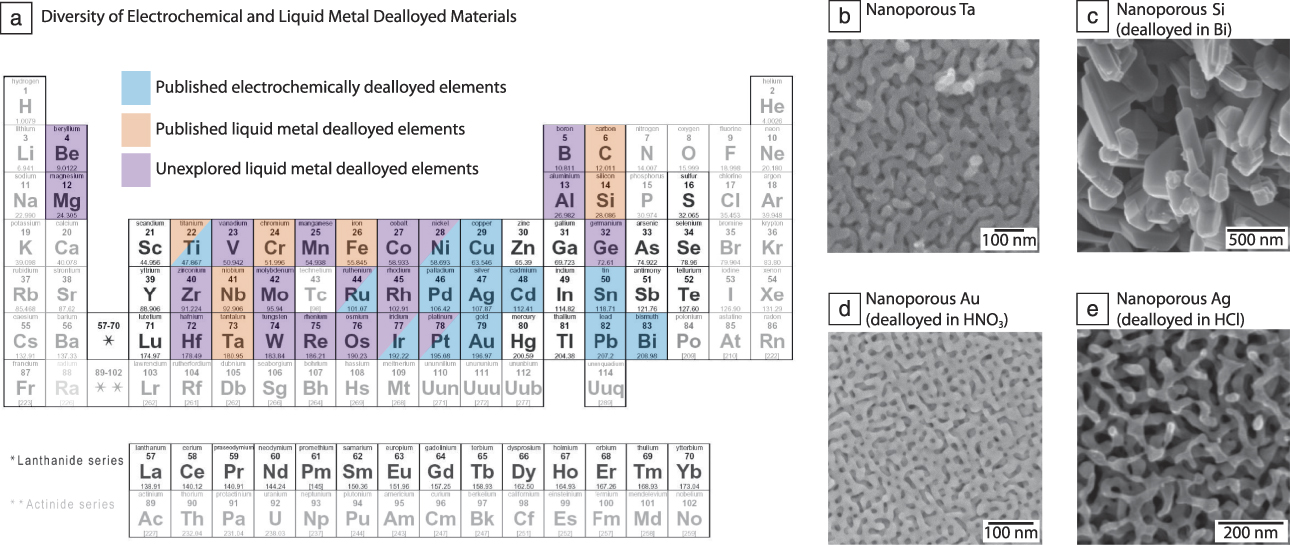
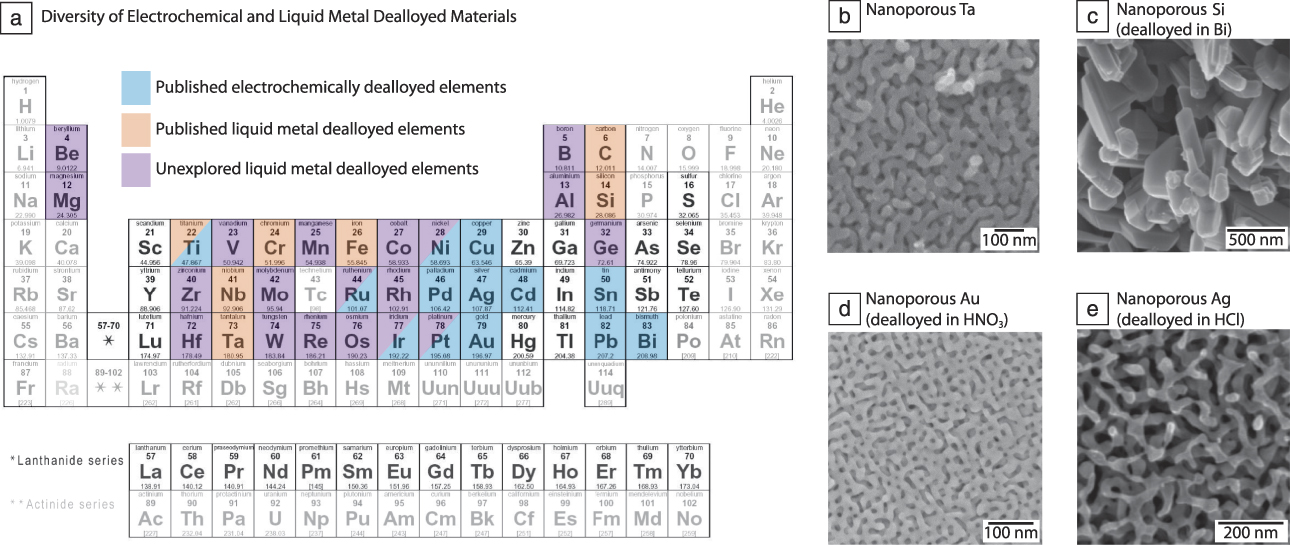
We refer to this type of dealloying as liquid metal dealloying (LMD) to contrast it with electrochemical dealloying (ECD). LMD is an important advance because it expands the set of dealloyable systems to include components from nearly the entire periodic table. Figure 1a illustrates all of the elements that have been fabricated using ECD and LMD, and identifies suitable candidates for LMD that remain to be explored by the dealloying community. Figure 1b–e shows representative examples of nanoporous materials made by ECD and LMD, demonstrating that both processes yield qualitatively similar morphologies.Reference McCue, Gaskey, Geslin, Karma and Erlebacher8,Reference Wada, Ichitsubo, Yubuta, Segawa, Yoshida and Kato31–Reference Zeis, Lei, Sieradzki, Snyder and Erlebacher33 For simplicity, our discussion is centered on the fabrication of unary nanoporous metals, but it is straightforward to extend dealloying to multicomponent nanoporous metals. For instance, a nanoporous refractory high-entropy alloy could be fabricated by dealloying a Ti-TaVNbMoW alloy in molten Cu.Reference McCue, Ryan, Hemker, Xu, Li, Chen and Erlebacher30
Dealloying is ubiquitous as a materials-processing tool. (a) Comprehensive examination of elements that have been and can be fabricated into a porous form factor via electrochemical (blue) or liquid metal dealloying (orange and purple); (faded elements) are either gases at standard conditions for temperature and pressure, highly reactive with atmospheric oxygen, or have no stable isotopes. (b) Nanoporous Ta formed via liquid metal dealloying in CuAg.Reference McCue, Gaskey, Geslin, Karma and Erlebacher8 (c) Nanoporous Si formed via liquid metal dealloying in Bi; note the highly faceted ligaments due to the diamond cubic crystal structure of Si. Reprinted with permission from Reference Reference Wada, Ichitsubo, Yubuta, Segawa, Yoshida and Kato31. © 2014 American Chemical Society. (d) Nanoporous Au formed via electrochemical dealloying in HNO3.Reference Zeis, Lei, Sieradzki, Snyder and Erlebacher33 (e) Nanoporous Ag formed via electrochemical dealloying in HCl.Reference Kim and Nishikawa32 Reprinted with permission from Reference Reference Kim and Nishikawa32. © 2013 Springer.
The goal of this article is to address the fundamentals of morphological evolution during dealloying and how pattern formation is affected by the kinetics associated with dissolution in an electrolyte versus a molten metal. Although ECD and LMD are both dealloying processes, they exhibit different rate-limiting behavior. There are some obvious but superficial similarities—that an interfacial instability arises from competition between mass transport of the dissolving species (in the dissolution medium) and the remaining component (along the metal–liquid interface) is one. Still, there are many differences, such as the relative magnitude of dissolution versus surface diffusion, whether the interface is sharp or diffuse, and whether there is any other kind of interfacial reaction. These subtle details must be clarified for the full potential of dealloying to be realized as a processing tool.
Phenomenology of dealloying: A comparison between electrochemical and liquid metal dealloying
In both ECD and LMD, there is a kinetic competition between dissolution and interface diffusion.Reference Erlebacher, Aziz, Karma, Dimitrov and Sieradzki5,Reference Rugolo, Erlebacher and Sieradzki34 When regions of the surface are dissolved—we expect finite, percolating clusters on the surface to dissolve in a burst—the remaining component(s) reorganize on the surface, driven by both diffusional kinetics (Cahn–Hilliard) and capillary (curvature-driven) forces.Reference Fujita, Qian, Inoke, Erlebacher and Chen35–Reference Vega and Newman37 It is not thermodynamically realistic for the remaining component to remain on the surface as adatoms. Instead, the remaining component atoms diffuse with the receding edge of the dissolving cluster, analogous to uphill diffusion driven by a simple chemical potential gradient. Counterintuitively, this diffusion leads to clustering of the remaining component atoms, which inhibits passivation, exposes fresh surfaces to further dissolution, and increases the overall surface area.
At the same time, but at a much slower rate, surface diffusion driven by capillary forces attempts to reduce the excess surface energy (area) by transporting mass from regions of high positive surface curvature to regions of high negative surface curvature. It is an open question whether these kinds of interface diffusion (Cahn–Hilliard and curvature-driven), and their associated interface diffusion fluxes JCH and Jcap (where the subscript cap stands for capillary), are simply additive, with the JCH term dominating during the early stages of interface pattern formation and the capillary term dominating during coarsening. Here, we separate them to emphasize their relative importance.
Mathematically, these effects can be expressed as coupled equations for the interface normal velocity νn and local surface concentration C. The interface normal velocity is given by:
 $${v_n} = - \Omega {J_{diss}} + \Omega \nabla \cdot {J_{cap}}\,,$$
where Ω is the atomic volume, Jdiss is the dissolution current, and Jcap is the capillary diffusion current. The latter two are dependent on the local surface concentration and interface curvature. A complete description of these two fluxes can be found in Reference Reference Erlebacher and Sieradzki3.
The evolution of the local surface concentration is given by:
 $${{\partial C} \over {\partial t}} = {v_n}{C_0} - {v_n}\kappa C - \nabla \cdot {J_{CH}}\,,$$
where νn is given by Equation 1, κ is the local surface curvature, C 0 is the gold concentration in the parent alloy, and the JCH surface current is described in Reference Reference Erlebacher, Aziz, Karma, Dimitrov and Sieradzki5.
These governing equations for porosity evolution reasonably capture ECD,Reference Erlebacher and Sieradzki3,Reference Erlebacher, Aziz, Karma, Dimitrov and Sieradzki5 assuming a sharp interface and no dissolution of the nobler component into the electrolyte. However, in LMD, two new effects must be considered:
• Mass transport in the dissolution medium. In ECD, the diffusivity of oxidized ions in electrolyte are very fast relative to dealloying front velocities. Dealloying velocities are on the order of 10 nm/s, whereas diffusion of metal ions in electrolytes is on the order of 10–6 cm2/s, which leads to an effectively constant dealloying velocity.Reference Dona and Gonzalez-Velasco38–Reference Chen-Wiegart, Wang, McNulty and Dunand41 In contrast, diffusivity in molten metals is on the order of ∼10–6 cm2/s, but the dealloying front is moving at a much higher velocity, ∼1 μm/s.Reference McCue, Gaskey, Geslin, Karma and Erlebacher8 As a result, LMD is diffusion limited in the melt and the velocity slows down with time as t 1/2.
• Partial dissolution and partitioning of the remaining component. In LMD, the concentration of the dissolving species at the dealloying interface is in local equilibrium with the parent alloy, decaying off into the liquid due to diffusion. The concentration of the dissolving component right at the interface is quite high—tens of percent—which could increase the solubility of the “nondissolving” species in the liquid. Of course, any of these species that dissolves and diffuses too far from the interface will see a lower concentration of the dissolving species, and thus we expect lateral partitioning back onto the evolving microstructure.
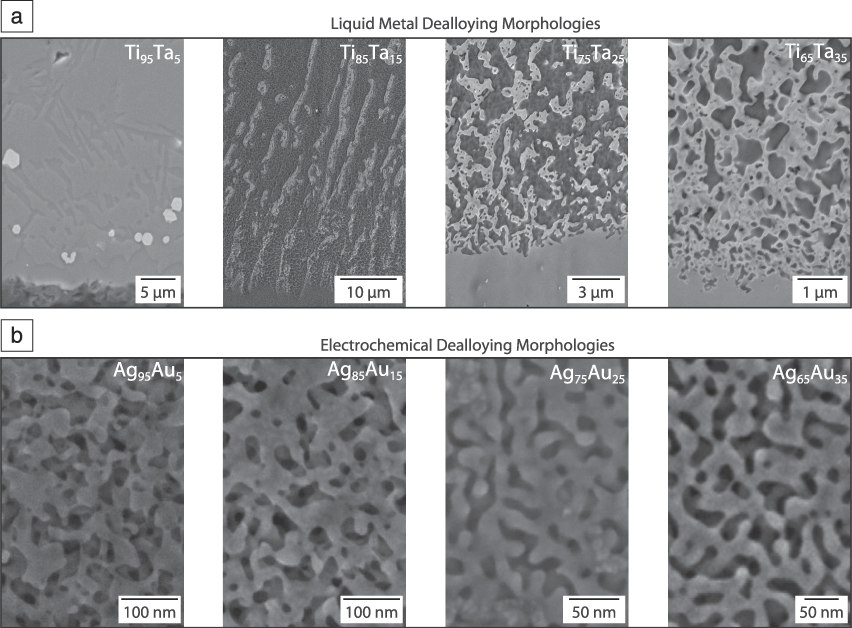
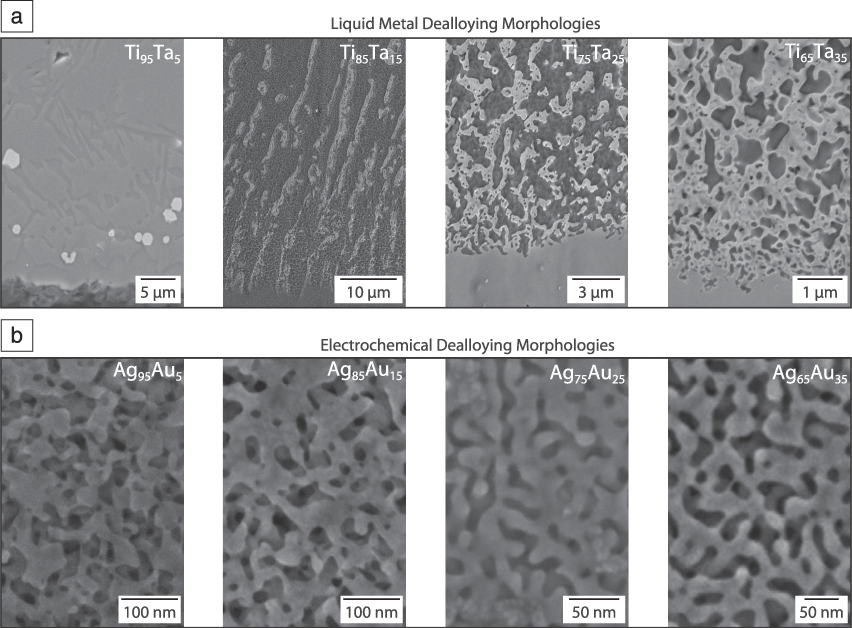
These effects have ramifications vis-à-vis the observed morphologies seen in ECD compared to LMD. In general, there are two morphologies seen in ECD—the prototypical “nanoporous” morphology consisting of (1) bicontinuous void/interconnected ligament networks; and (2) particles, which form when the noble component concentration is low and the dissolution rate is high.Reference Snyder and Erlebacher42–Reference Supansomboon, Porkovich, Dowd, Arnold and Cortie44 In contrast, as shown in Figure 2, there is a wider range of morphologies seen in LMD.Reference Geslin, McCue, Gaskey, Erlebacher and Karma9,Reference Zeis, Lei, Sieradzki, Snyder and Erlebacher33,Reference Snyder and Erlebacher42,Reference Volkert, Lilleodden, Kramer and Weissmüller45 At low mole fractions (5 at.%) of the nondissolving component, one still sees budding off of particles, and a bicontinuous morphology is observed at high mole fractions (35 at.%). However, at intermediate concentrations (15 at.%) a lamellar morphology is observed. Such lamellar morphologies have not been observed in ECD. In part, this can be explained by percolation of the remaining component. If the remaining component concentration is below the percolation threshold (∼18–25 at.%) disconnected networks form, whereas concentrations above this threshold are fully connected. But the effect also appears to be associated with the relative rates of interface and liquid-phase diffusion in LMD. Conceptually, for a fixed-alloy composition, slower liquid-phase transport will allow the surface more time to reorganize into a connected morphology.
Comparison of dealloyed morphologies formed in different liquid media as a function of parent alloy composition. (a) TixTa1–x dealloyed in molten Cu via liquid metal dealloying morphologies; at low Ta concentrations the dealloyed morphology forms disconnected networks (droplets and lamellae); as the Ta concentration increases, the dealloyed morphology becomes interconnected.Reference Geslin, McCue, Gaskey, Erlebacher and Karma9 (b) AgxAu1–x dealloyed in concentrated HNO3 via electrochemical dealloying morphologies; the dealloyed structure is bicontinuous for all Au concentrations.Reference Zeis, Lei, Sieradzki, Snyder and Erlebacher33,Reference Snyder and Erlebacher42,Reference Volkert, Lilleodden, Kramer and Weissmüller45
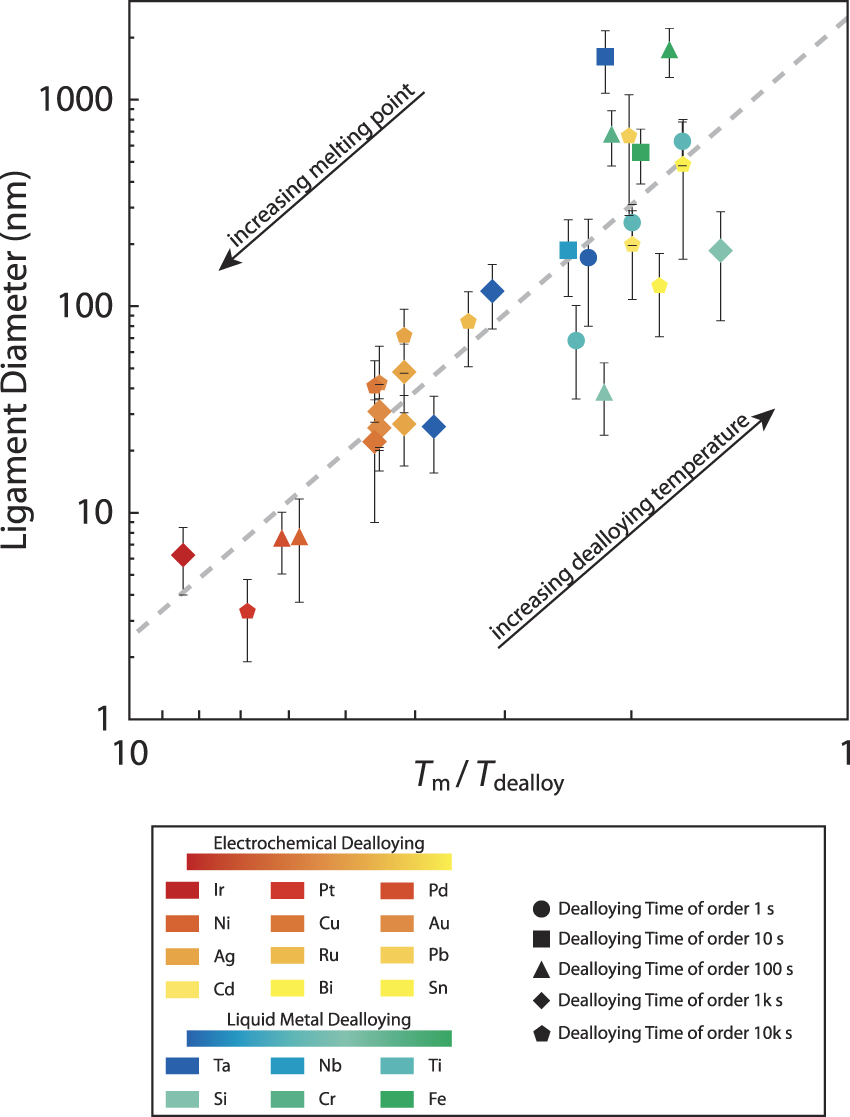
Despite these differences, the length scale of porous materials fabricated by both LMD and ECD are well correlated with the inverse “homologous dealloying temperature,” Tm/Tdealloy, which is the melting point of the material divided by the temperature during dealloying. Chen and Sieradzki demonstrated that the ligament size in ECD materials at room temperature scales inversely with their melting point.Reference Chen and Sieradzki46 We have updated and expanded their data to include new elements and dealloying temperatures using Reference Reference Stuckner, Frei, McCue, Demkowicz and Murayama47 to analyze the ligament diameters, and present this data in Figure 3.Reference McCue, Gaskey, Geslin, Karma and Erlebacher8,Reference Wada, Setyawan, Yubuta and Kato28,Reference Wada, Ichitsubo, Yubuta, Segawa, Yoshida and Kato31,Reference Kim and Nishikawa32,Reference Chen and Sieradzki46,Reference El Mel, Boukli-Hacene, Molina-Luna, Bouts, Chauvin, Thiry, Gautron, Gautier and Tessier48–Reference Dixon, Daniel, Hieda, Smilgies, Chan and Allara57 For completeness, we have also indicated the dealloying duration because the features will coarsen during this process. The effect of dealloying time is modest at small homologous temperatures, but leads to a large scatter between alloy systems with increasing homologous temperature. Nevertheless, the correlation between ligament diameter and homologous dealloying temperature transcends both ECD and LMD.
Universal trend in ligament diameter versus the inverse homologous temperature for electrochemical (red-to-yellow gradient) and liquid metal (blue-to-green gradient) dealloying at various dealloying times (different marker shapes). This correlation arises from the ligament diameter’s dependence on surface diffusion, which is a thermally activated process with an Arrhenius dependence. The dealloying duration has significant impact for low melting point elements and high dealloying temperatures, causing scatter in this universal trend at high homologous temperatures.Reference McCue, Gaskey, Geslin, Karma and Erlebacher8,Reference Wada, Setyawan, Yubuta and Kato28,Reference Wada, Ichitsubo, Yubuta, Segawa, Yoshida and Kato31,Reference Kim and Nishikawa32,Reference Chen and Sieradzki46,Reference El Mel, Boukli-Hacene, Molina-Luna, Bouts, Chauvin, Thiry, Gautron, Gautier and Tessier48–Reference Dixon, Daniel, Hieda, Smilgies, Chan and Allara57

The origin of this correlation is that coarsening in dealloyed materials is controlled by the surface mobility, which scales universally with the homologous temperature.Reference Flynn58 Simplistically, capillary effects, associated with local surface curvatures, drive surface diffusion to reduce the surface area and increase the ligament length scale.Reference Kertis, Snyder, Govada, Khurshid, Chayen and Erlebacher59–Reference Park, Voorhees and Thornton63 However, coarsening is also intimately related to the topological genus of the nanoporous materials formed. The genus counts the number of independent “handles” in the porous structure. A torus and a coffee cup have genus 1, for instance, whereas a double torus has genus 2.Reference Erlebacher64 It has been shown that as coarsening progresses, ligaments “pinch off” in a very liquid-like way due to Rayleigh instabilities, reducing the genus per volume. Occasionally, these instabilities lead to the encapsulation of the dissolution medium in the coarsening metal, leading to cavities in the ligaments that are many tens of nm3 in volume.Reference Parida, Kramer, Volkert, Rosner, Erlebacher and Weissmueller65 These voids have been observed in both ECD and LMD, indicating that analogous materials physics control morphological evolution in both cases.Reference McCue, Gaskey, Geslin, Karma and Erlebacher8
Modeling of microstructure evolution in dealloying
Kinetic Monte Carlo simulations of ECD
Much of the insight we have gained into morphological/microstructure evolution during dealloying has been greatly assisted through computer modeling.Reference Erlebacher4,Reference Erlebacher, Aziz, Karma, Dimitrov and Sieradzki5,Reference Erlebacher and McCue66–Reference Artymowicz, Erlebacher and Newman71 In general, Equations 1 and 2 are challenging to solve numerically, although these equations have been shown to produce nanoporous structures.Reference Eilks and Elliott72 Most of the dealloying modeling to date has been carried out using the kinetic Monte Carlo method (KMC). The KMC simulations describe a collection of atoms, usually confined to a lattice, but allowed to jump from site to site via activated hopping or to be dissolved from the system via an activated process. The utility of this method is that it can model large systems (several millions of atoms) and time scales that are comparable to experiments (100–106 s). KMC studies have been made on planar systems with periodic boundary conditions, and also on nanoparticles using methods described in Reference Reference Erlebacher4. However, it is computational taxing for KMC to capture diffuse interfaces, and so it is more suitable for modeling ECD than LMD.
Algorithm optimization allows KMC models to monitor only the atoms that are able to diffuse (i.e., have at least one dangling bond), so the system size scales as the surface area of the structure rather than its volume. Transition rates for diffusion are assigned according to a bond-breaking model for which a transition from an N-coordinated site is given by:
 $${k_{diff}} = {\nu _D}\exp \left( {{{ - n{E_b}} / {{k_B}T}}} \right)\,,$$
and transition rates for dissolution are assigned according to a site-specific, bond-breaking expression based on the Butler–Volmer equation:
 $${k_{diss}} = {\nu _{diss}}\exp \left( {{{ - \left( {n{E_b} - \varphi } \right)} / {{k_B}T}}} \right)\,,$$
where n is the number of nearest-neighbor bonds; E b is a bond energy, usually on the order of 0.1 eV; νD is the Debye frequency on the order of 1013 s–1; νdiss is an attempt at frequency matching experimental dissolution fluxes; ϕ is the applied potential; k B is the Boltzmann constant; and T is temperature.
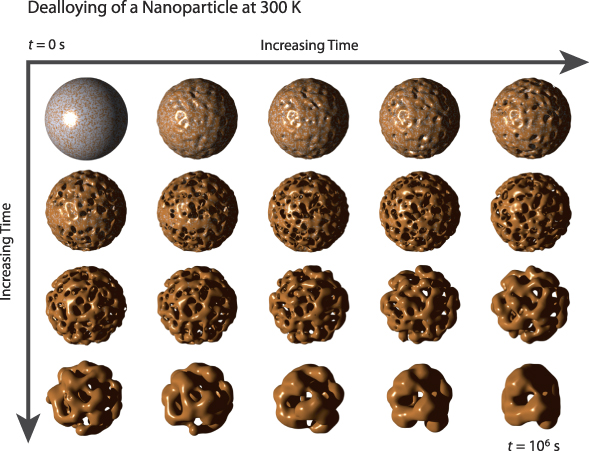
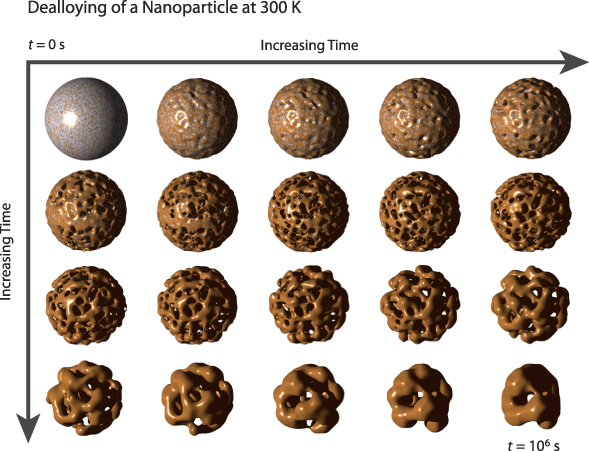
Figure 4 shows typical results of using KMC simulations to model porosity evolution in dealloying, using a nanoparticle for illustration.Reference Erlebacher64 At early times, roughness evolves, eventually leading to undercutting and porosity evolution. At longer times, after the particle has fully dealloyed, it coarsens and the crystal ultimately takes on the equilibrium Wulff shape. These results are consistent with the working model for porosity and show additional nuanced effects, such as the reduction of the topological genus associated with “pinch-off” instabilities and inverse Rayleigh instabilities that lead to the creation of large voids within the nanoporous ligaments.
Kinetic Monte Carlo simulations modeling porosity evolution during electrochemical dealloying using a nanoparticle for illustration; time is the same on both axes. At early times, the surface becomes roughened and porosity begins to evolve on the surface. As time increases (to the right and down), porosity fully penetrates into the particle and the average feature size increases via reduction of the topological genus associated with ligament “pinch-off” instabilities. At early dealloying times, the particle has a very low facet fraction, but as the structure coarsens it ultimately takes on the equilibrium Wulff shape of the crystal.Reference Erlebacher64
Phase-field modeling of LMD
Recently, significant progress has been made in utilizing the phase-field method to capture pattern formation during dealloying. Unlike KMC, it is not computationally expensive for the phase-field method to accurately model the solid–liquid interface as well as transport of the dissolved component in the dealloying medium. While the electrochemical interface can be, in principle, modeled by the phase-field method,Reference Guyer, Boettinger, Warren and McFadden73,Reference Guyer, Boettinger, Warren and McFadden74 the equations are extremely stiff and difficult to solve in more than one dimension due to the presence of an electrical double layer. In contrast, the phase-field method is well developed to model the solidification or melting of binary and multicomponent metallic alloys,Reference Boettinger, Warren, Beckermann and Karma75–Reference Steinbach78 where the transition from an atomically ordered crystal structure to a liquid occurs smoothly across a spatially diffuse interface. This makes this method ideally suited to investigate interfacial pattern formation quantitatively during LMD in two and three dimensions,Reference Geslin, McCue, Gaskey, Erlebacher and Karma9 including the transport of the miscible element in the liquid metal.
We illustrate the phase-field approach for the dealloying of TaTi alloys by a liquid Cu melt that has been studied experimentally (Figure 2). The free energy of the ternary TaTiCu system is expressed in the form:Reference Geslin, McCue, Gaskey, Erlebacher and Karma9
 $$F = \int\limits_V {dV\left[ {{{{\sigma _\phi }} \over 2}{{\left| {\nabla \phi } \right|}^2} + f\left( \phi \right) + \sum\limits_i {{{{\sigma _i}} \over 2}{{\left| {\nabla {c_i}} \right|}^2}} + {f_c}\left( {\phi ,{c_1},{c_2},{c_3}} \right)} \right]} \,,$$
where φ is the phase field distinguishing the solid and liquid phases, and c 1, c 2, and c 3 are the concentration fields of Ta, Ti, and Cu, respectively. The first two terms inside the square brackets describe the excess free energy of an atomically rough solid–liquid interface, and the second two terms represent the chemical free-energy density. The evolution equations for the phase-field and concentration fields are given by:
 $${{\partial \phi } \over {\partial t}} = - K{{\delta F} \over {\partial \phi }}\,,$$
 $${{\partial {c_i}} \over {\partial t}} = \nabla \cdot \left( {{M_{ij}}{{\delta F} \over {\partial {c_j}}}} \right)\,,$$
where K controls the rate of attachment/detachment kinetics of atoms at the solid–liquid interface and M ij is the atomic mobility matrix chosen to match the diffusive transport properties of the three elements.
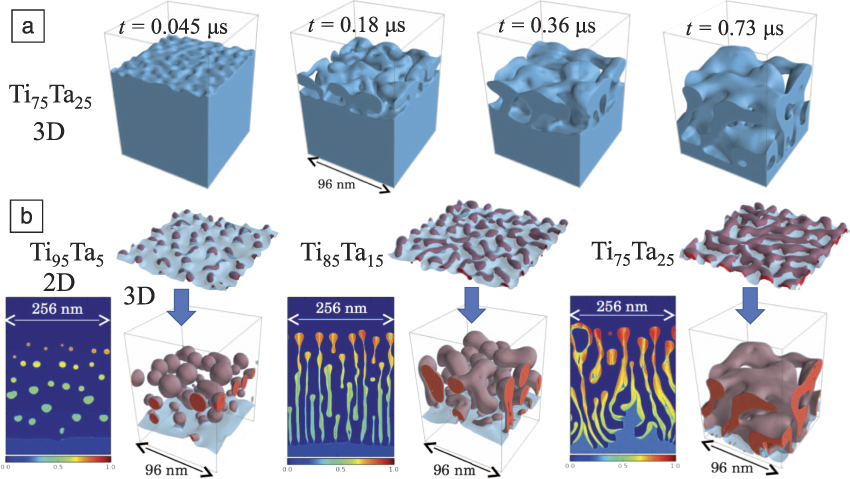
The results of phase-field simulations of LMD using this model are illustrated in Figure 5 for different alloy compositions. Figure 5a shows the evolution of the solid–liquid interface over time during the formation of the characteristic “topologically connected” dealloyed structure for a Ti75Ta25 alloy. Figure 5b shows the sensitivity of the dealloyed morphology on the initial alloy composition, from disconnected droplets (Ti95Ta5) to disconnected, but aligned filaments (Ti85Ta15), and finally to topologically connected ligaments (Ti75Ta25). Not only do the changes in morphology mirror experimental observations at longer time scales (Figure 2), but a detailed analysis reveals that lateral partitioning during the initial stages of morphological instability occurs by spinodal decomposition confined within the solid–liquid interfacial layer. Upon melting, this layer becomes enriched in Ta that is immiscible in the Cu melt, driving the formation of Ta-rich and Cu-rich interfacial domains.Reference Geslin, McCue, Gaskey, Erlebacher and Karma9 Depending on the Ta content, this lateral partitioning will lead to topologically connected (Ti75Ta25) or disconnected (Ti95Ta5) Ta-rich domains.
Phase-field simulations of liquid metal dealloying in 2D and 3D at 1775 K for different parent alloy compositions.Reference Geslin, McCue, Gaskey, Erlebacher and Karma9 (a) A sequence of point-in-time snapshots of the solid–liquid interface during the formation of the characteristic “topologically connected” dealloyed structure for a Ti75Ta25 alloy. (b) Dependence of the dealloyed morphology on the parent alloy composition, with increasing Ta content, from disconnected droplets (Ti95Ta5) to disconnected and aligned filaments (Ti85Ta15) to topologically connected ligaments (Ti75Ta25); the color bar corresponds to the Ta concentration, where 100% Ta is red and 0% Ta is blue. The change in morphology can be understood by examining the spatial distribution of Ta at the solid interface at the very early stage of morphological instability. The solid–liquid interface is represented in transparent light blue and the red surface represents the 50 at.% Ta iso-concentration. The solid–liquid interface appears brown when the interface is enriched in Ta due to color addition of light blue and red.
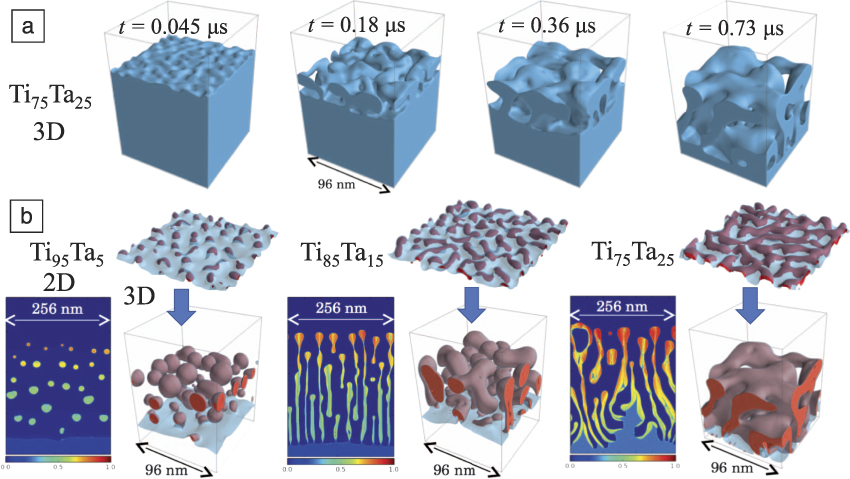
The phase-field simulations also reveal a striking analogy between LMD and eutectic solidification, which is well known to generate lamellar or rod structures.Reference Jackson and Hunt79,Reference Dantzig and Rappaz80 During eutectic growth of a binary AB alloy, the growth velocity, V, is dependent on the diffusion of the element A (rejected by B-rich solid phase) through the liquid to the adjacent A-rich phase, and vice versa for the B element, enabling coupled growth of both phases. A similar mechanism is revealed by the two-dimensional simulation for a Ti85Ta15 alloy in Figure 5b, where the Ta-rich solid lamellae reject Ti atoms that diffuse along the interface to the adjacent Ti-Cu liquid channels, which simultaneously reject Ta atoms that diffuse to the Ta-rich solid lamellae, allowing both the solid phase and liquid channel to “grow” cooperatively into the TaTi solid alloy. Because diffusive mass transport of the dealloyed element from the interface is relatively slow in LMD compared to the dissolved species in ECD, V decreases as  $\~1/\sqrt t$ in LMD. Diffusion-coupled growth in turn fixes the product of the ligament diameter λ and growth velocity, λ2V,Reference Sieradzki6–Reference Geslin, McCue, Gaskey, Erlebacher and Karma9 causing λ to increase as ∼t 1/4 with dealloying depth from ∼10 nm on the 10–6 s time scale of phase-field simulations to ∼1 µm on the 102 s time scale of experiments.
Conclusions
On a superficial level, both the LMD and ECD dealloying techniques require different experimental methodologies. Their primary difference lies in rate-limiting behavior—in ECD, the dealloying rate is controlled by detachment kinetics of the dissolving component (interface limited), whereas in LMD the rate is controlled by diffusion of the dissolving component in the molten metal. However, on a fundamental level, LMD and ECD are really quite similar. Both control microstructure morphology via the relative magnitude of the interfacial diffusion and dissolution rates.
Thinking broadly, we can construct a morphology map with interfacial diffusion and dissolution rates serving as the axes. Owing to their different rate-limiting behaviors, LMD and ECD occupy unique regions, but briefly overlap at processing extremes—LMD becomes comparable to ECD at low homologous temperatures, and ECD becomes comparable to LMD at high dissolution rates. We consider it an open question whether one might engineer an ECD system such that the ratio of surface diffusion rate and alloy dissolution rate is sufficiently reduced to produce a lamellar structure, and conversely, if one can produce an LMD system where this ratio is sufficiently increased to produce a topologically connected structure at low concentration of the immiscible alloy element. Furthermore, in principle, these rate-limiting behaviors can be switched. We expect LMD to become interface limited under forced-convection conditions (e.g., vigorously stirring the metal bath) and we expect ECD to become diffusion limited in small electrolyte volumes.
Having just defined this kinetic design space, it should be emphasized that we do not exhaustively know all the factors controlling interfacial diffusion and dissolution, and these fundamental issues still require study. The effects of grain size and crystallography on the dissolution rate, or what effect crystallinity has on surface diffusion pathways are known for only a limited number of systems. Additionally, cases where dealloying is diffusion limited in the solid have received little attention. A small number of studies have shown that bulk diffusion limitations can lead to morphologies that have not been seen in either LMD or ECD, such as void dendrites and Kirkendall voiding.Reference Chen and Sieradzki81 We expect future work to build out this kinetic morphology map, and further extend the utility of dealloying as a method of controlling nanoscale materials structures with ultrahigh interfacial areas.
Acknowledgments
J.E. acknowledges support from the National Science Foundation DMR Program under Grant DMR-1402726. A.K. acknowledges support from Grant DEFG02–07ER46400 from the US Department of Energy, Office of Basic Energy Sciences. We thank B. Gaskey for technical contributions to this work.

Ian McCue is a postdoctoral researcher at Texas A&M University. He received his PhD degree in materials science and engineering from Johns Hopkins University (JHU) in 2015. He then held a dual postdoctoral appointment at JHU and Arizona State University. His current research focuses on utilizing self-organization to develop new nanostructured metallic materials, and characterizing their mechanical behavior. He received a Materials Research Society Silver Graduate Student Award in 2014. McCue can be reached by phone at 215-805-6235 or by email at imccue1@tamu.edu.

Alain Karma has been a professor of physics and an arts and sciences distinguished professor at Northeastern University since 1988. He also heads the Center for Interdisciplinary Research on Complex Systems. He received his PhD degree in physics from the University of California, Santa Barbara, in 1985. He was a Weingart Fellow in theoretical physics at the California Institute of Technology. His research focuses on the development of phase-field models of interface dynamics for a broad range of materials science applications, including alloy solidification, dealloying, grain-boundary migration, nanocrystalline growth, and fracture. His awards include the Condorcet Chair from École Normale Supérieure (2004); Northeastern University Klein Lectureship (2006); American Physical Society Fellow (2007); The Minerals, Metals and Materials Society Bruce Chalmers Award (2008); and the Institute of Materials, Minerals and Mining John Hunt Medal (2016). Karma can be reached by phone at 617-373-2929 or by email at a.karma@neu.edu.

Jonah Erlebacher is a professor and chair of the Department of Materials Science and Engineering at Johns Hopkins University (JHU), with a secondary appointment in the Department of Chemical and Biomolecular Engineering. He received his PhD degree from Harvard University in 1999 in applied physics, and joined the faculty at JHU in 2000. His current research focuses on materials synthesis and discovery, especially for energy-related technologies. Erlebacher can be reached by phone at 410-516-6077 or by email at jonah.erlebacher@jhu.edu.