I. INTRODUCTION
Copper and nickel as well as their oxides have a natural affinity to each other. This is seen not only in the joint abundance of the two elements in ores but also in a number of well established technical applications of their alloys. In 1906, a patent was granted to Monell Reference Monell1 for the invention of a copper-nickel alloy with extreme corrosion resistance. This alloy is produced still today, interestingly, in the direct course from the copper and nickel containing ores rather than from pure metals. It is an important alloy that can withstand even fluor, fluoride, and hydrofluoric acid containing environments. A second, also very important application is the production of Konstantan (constantan). This is a trade name of the German company ThyssenKrupp VDM GmbH that consists of 55% Cu, 44% Ni, and 1% Mn, showing a relatively high electrical resistance that is almost temperature independent. Reference Laughton and Warne2 While most of the metal oxides are insulators or n-type semiconductors, CuO and NiO are p-type semiconductors. Reference Schultze, Hassel, Bard, Stratmann and Frankel3 Although the band gap of NiO (3.5 eV) is almost twice as large as that of CuO (1.7 eV), its absolute position is the same. This makes combinations of their oxides highly interesting for photochemical applications. Reference Hashimoto, Yamasaki, Meguro, Sasaki, Katagiri, Izumiya, Kumagai, Habazaki, Akiyama and Asami4,Reference Miyauchi, Nakajima, Watanabe and Hashimoto5
Thin film oxide preparation using reactive sputtering represents an important method used in the current developments of many low- and large-scale applications. The advantage of obtaining an oxide film using a metallic target was already exploited more than 10 years ago in some of the first studies of the reactive formation of NiO by DC sputtering. Reference Hotovy, Huran, Janik and Kobzev6 At that time, it was clearly proven that using a reactive route via an O plasma, a cubic NiO thin film is formed, which has tuneable electrical resistivity as a function of the O content. Reference Hotovy, Buc, Hascik and Nennewitz7 Later on, the relationship between the preferential orientation of the NiO films and their electrical properties was described. Reference Chen and Yang8 Nonstoichiometric NiO thin films can also be formed during reactive sputtering due to the presence of interstitial O atoms, causing an expansion of the lattice constant. Reference Yang, Lai and Chen9 Recently, the effect of the partial O pressure used during the reactive sputtering of NiO was investigated, and the possibility of a preferential [111] or [200] growth while maintaining p-type semiconducting properties was evidenced. Reference Karpinski, Ferrec, Richard-Plouet, Cattin, Djouadi, Brohan and Jouan10 NiO-based resistive switching structures are fervently investigated due to their applications in electronics (e.g., resistive switching random access memories), where the oxidation kinetics, Reference Courtade, Turquat, Muller, Lisoni, Goux, Wouters, Goguenheim, Roussel and Ortega11 nanostructure, Reference Otsuka, Furuya, Takeda, Shimizu, Shingubara, Watanabe, Takano and Takase12 or the underlying electrode material Reference Lee, Kang, Benayad, Lee, Ahn, Kim, Stefanovic, Park and Yoo13 represent key factors for the final device performance. NiO films are, due to their chemical stability and electrical properties, promising materials for gas sensing and are used as precursors for porous NiO nanotubes. Reference Song, Gao and Mathur14
Another metal largely used for oxide formation by a reactive sputter process is Cu. Several oxidation states can be identified in such oxide films CuO and Cu2O being the most commonly encountered ones. Reference Nancheva, Docheva and Misheva15 Optically transparent monophasic Cu2O thin films were obtained using high pressure gas sputtering while completely avoiding the formation of CuO. Reference Chandra, Taneja and Ayyub16 By varying the reactive sputtering pressure, the obtained Cu2O thin films can be polycrystalline having both (111) and (200) orientations. Lowering the pressure creates favourable conditions for single crystalline (111) film formation. Reference Sivasankar Reddy, Uthanna and Sreedhara Reddy17 Different microstructures and morphologies are possible to be obtained for the cuprous oxides during the DC reactive sputtering process usually presenting rough surfaces, Reference Sivasankar Reddy, Venkata Rao, Uthanna and Sreedhara Reddy18 which may show photocatalytic reactivity under visible light. Reference Zhu, Zhang, Li, Pan, Wang and Huang19 The possibility of using Cu2O for solar cell applications was also exploited due to its abundance and low fabrication cost. An increase in the whole density of Cu2O was found upon including N as a constituent gas for the plasma. Reference Hara, Kondo, Komoda, Ikeda, Shinohara, Tanaka, Kondoa and Domen20,Reference Akimoto, Ishizuka, Yanagita, Nawa, Paul and Sakurai21 Similar to NiO, Cu2O is also studied as a candidate material for resistive switching-based devices. Reference Yang and Rhee22
In a former work, it was demonstrated that the use of an alloy as a sputter target for the preparation of a thin film leads to a change in the composition. It was proven that Cu is enriched on the surface. Reference Miteva, Karpuzov, Ivanov and Angelova23 Self-sustained co-sputtering of Cu and Ni was also demonstrated with promising applications in thin film resistors. Reference Posadowski24 The presence of low amounts of Cu in NiO (upon doping during the sputtering process) was recently found to have interesting applications in optoelectronic devices due to the enhanced electrical conductivity of the transparent NiO. Reference Yang, Shi, Feng, Pu, Li, Zhou and Zhang25 Low amounts of Ni being present in cuprous oxide thin films are also highly interesting for photovoltaic power generation; a suppression of the reduction process of CuO to Cu2O being attributed to the presence of Ni. Reference Kikuchi, Tonooka and Kusano26
In the present work, a Cu–Ni oxide thin film combinatorial library produced by reactive sputtering from a Cu–Ni sectioned cathode is investigated.
II. EXPERIMENTAL
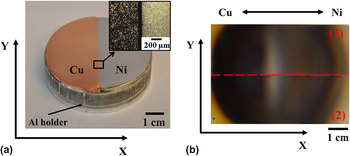
A commercial DC mini sputtering system (Hummer II from Technics, Alexandria, VA) was used for the deposition of Cu–Ni thin film oxides. The maximum available DC power was 60 W for a maximum voltage of 1.2 kV. A base pressure of 10 Pa was ensured by a built-in pumping system. To achieve a compositional spread, a two-component sectioned cathode was fabricated. Pure Cu (>99.999 %, Alfa Aesar, Karlsruhe, Baden-Württemberg, Germany) and Ni (>99.98 %, Alfa Aesar) plates were machined separately to a semicircular geometry to provide identical exposed areas. The Cu plate had a thickness of 2 mm, whereas the Ni plate was only 1-mm thick. Both surfaces were ground using SiC grinding papers with grain sizes down to 4000. For cleaning purposes, the Cu and Ni half disks were sonicated first in acetone and then in ethanol for 15 min each time. Both produced half disks were fixed on an Al disk holder using highly conductive Ag suspension to ensure electrical and thermal conductivity between the holder and sectioned targets. For having both polished Cu and Ni surfaces in the same geometrical plane, additionally an Al plate with the same semicircular shape was placed beneath the Ni half disk compensating the target's thickness difference. By carefully polishing the flat edges of both half cathodes, an intimate lateral contact between Cu and Ni targets was ensured minimizing the initial gap. This resulted in minimization of contaminant species coming from the fixing suspension and/or underlying Al holder. In the zoomed area detailed in Fig. 1(a), a 60-µm distance between the Cu and Ni targets can be measured as observed by optical microscopy done after a precleaning sputtering step of the target. Pressing and drying at 50 °C for 2 h provided good mechanical adhesion of the half disks on the holder. Extra care was taken when joining both Cu and Ni half cathodes while fixing them on the Al holder, so that no Ag paste leaked out from the interface in the vicinity of the section. Finally, a circular two-component sectioned target with a flat surface and a total diameter of 50 mm was obtained. A photograph of the two-component sectioned cathode taken immediately after preparation is presented in Fig. 1(a).
(a) Two-component sectioned metallic Cu–Ni target with a zoomed view for indicating the close vicinity of the metals. The two metallic plates are fixed on an Al holder. (b) Photograph of the film deposited on two glass substrates labeled (1) and (2).

For the sputtering process using the Cu–Ni sectioned cathode, a target–substrate distance of 29 mm was applied. To form the desired mixture of Cu and Ni oxides, a reactive atmosphere containing a mixture of argon and oxygen was used. The oxygen partial pressure during deposition was 0.6 Pa. More details about the reactive sputtering from sectioned cathodes were recently reported during the study of a Cu–Zn oxide material library. Reference Burgstaller, Mardare and Hassel27 The overall sputtering time was 190 min. Due to the diameter of the sectioned cathode, the Cu–Ni oxide compositional spread was deposited on two borosilicate glass substrates (Marienfeld microscope slides, 26 × 76 mm2). Before deposition, the substrates were cleaned by sonication in ethanol for 10 min followed by drying in N2 flow. The samples were placed on the anode beside each other with their long axis perpendicular to the target section plane. An advantage of this approach is that two samples were simultaneously produced having the same history and identical compositional spread. An optical photograph of both samples is shown in part (b) of Fig. 1. The boundary separating both substrates is highlighted, and the samples are marked as (1) and (2). The presence of a Cu–Ni gradient along the x-axis is observable on both samples as a continuous color change from the left to the right side.
To determine the local thickness of the film along the Cu–Ni oxide combinatorial library, an X-Strata 980-A scanning x-ray fluorescence spectrometer (XRF) from Oxford Instruments (High Wycombe, Bucks, UK) was used. The microstructure of the oxide films was investigated using a field emission Zeiss Gemini 1540 XB scanning electron microscope (SEM; Jena Thuringia, Germany) operating with 5 kV accelerating voltage and in-lens detection at a working distance of 4 mm. To investigate the composition of selected spots on the substrate, scanning energy dispersive x-ray spectroscopy (EDX) with a 16 mm working distance and 20 kV accelerating voltage was used. The EDX spectra were analyzed using the INCA software from Oxford Instruments.
The crystallographic properties of the Cu–Ni oxide thin films were investigated by grazing incidence scanning x-ray diffraction (GIXRD, Philips X'Pert Pro PW 3040/60, Almelo, Overijssel, Netherlands) with an incidence angle of 0.7°. To perform compositional analysis of the Cu–Ni oxide combinatorial spread, x-ray photoelectron spectroscopy (XPS, Thermo Fisher-Theta probe) was used. Information about the surface potential along the Cu–Ni oxide thin film was acquired using a scanning Kelvin probe (SKP, tip diameter of 300 µm) operating in a closed environment under controlled humidity and temperature conditions.
The chemical stability of the Cu–Ni oxide thin film library was investigated using a V-shaped scanning droplet cell microscope (VS-SDCM) with a downstream analysis of the electrolyte using continuous atomic absorption spectroscopy (CAAS) (HITACHI Z-8230 Polarized Zeeman Atomic Absorption Spectrophotometer with background correction, Krefeld, North Rhine-Westphalia, Germany). Reference Voith, Luckeneder and Hassel28 All reagents used for CAAS were of analytical grade. The VS-SDCM was placed on selected spots on the sample surface. Dissolution experiments were carried out with a constant electrolyte flow (0.1 M HCl) of 2.4 mL/min followed by downstream analytics of the outgoing electrolyte. Reference Voith, Luckeneder and Hassel28 The analogue voltage output signal generated at the photomultiplier tube was digitized by a 18-bit Labjack U6 Pro A/D-converter with a resolution of 0.15 mV. Graphical representation of the concentration transients (concentration over time graphs) were calculated by computing the digitized data provided by the A/D-converter in a self developed LabVIEW data acquisition program. Standard solutions for calibration of the CAAS were produced by diluting a stock solution of copper (1000 mg/L). Atomization of the standard solutions as well as the flowing electrolyte was done in an air-acetylene flame (15.0 L/min air, 2.1 L/min acetylene). The wave length of the copper hollow cathode lamp was 324.8 nm. The AAS was calibrated by measuring blank and standard solutions. Resulting calibration curves were fitted by linear regression.
III. RESULTS AND DISCUSSION
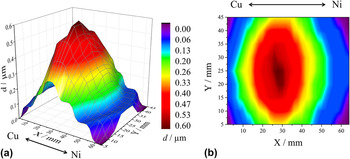
Thin film deposition from vapor phase generally results in the formation of a thickness gradient along the sample (as referenced to the source position) according to the cosine law. This is valid also for the case of DC sputtering when using a disk cathode. Reference Wasa and Hayakawa29 When sputtering more than one species from the same cathode (e.g., sectioned cathode geometry), each of the materials will produce its own thickness distribution and a vapor phase mixture of both species will always be present. The individual thickness gradients corresponding to each material are usually different, depending on a complex combination of factors, e.g., sputtering yield, target crystallography, etc. In Fig. 2, the measured thickness profile using scanning XRF of both substrates placed near each other [as shown in Fig. 1(b)] is presented. The use of two substrates is convenient since it offers the possibility of using each sample for various separate investigations, both being identical (but mirrored) and having identical history. The part (a) of Fig. 2 presents the 3D plot of the thickness profile, whereas the color coded XY projection of the profile surface is shown in the part (b). The XRF scan was done over the entire area of both substrates, and the absence of a thin film at the edges is found from the thickness profile. The characteristic rounding of the film edges due to the cathodes circular geometry (see Fig. 1) is observed here as well. A thickness evolution along the substrates (x-axis) is clearly observable having a distinct maximum close to the middle of the samples. Starting from the edges, both Cu and Ni oxide gradients are similar, a slightly sharper gradient on the Cu side suggests a larger exponent of the cosine law in the case of the Cu half-target. The highest film thickness in the compositional spread of Cu–Ni oxide reaches 600 nm. Even though the substrates and cathode were centered, in the inherent co-sputtering geometry of the sectioned cathode, the mixture of the sputtered species is expected to produce a shift of the maximum thickness profile peak toward the material with the higher sputter yield. This can be seen in Fig. 2 for the Cu–Ni sectioned cathode used. The mentioned peak shift toward the Cu side is clearly observable due to the larger sputtering yield of Cu as compared to Ni. Reference Ohring30
(a) 3D scanning XRF analysis map of the Cu–Ni thin film oxide material library showing the film thickness d in dependence of the position on the substrate and (b) color coded XY projection of the thickness profile surface. In Fig. 2(b), the shift of the maximum thickness toward the Cu rich side of the substrate can be seen.

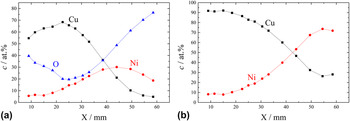
The elemental thickness gradients formed during the reactive sputtering process have led to a compositional gradient along the substrates defining a Cu–Ni oxide thin film library. To investigate the compositional spread on the substrates, an EDX line scan of the compositional spread close to the center of the joint substrates was performed. In Fig. 3(a), the Cu, Ni, and O concentrations are presented with respect to the position along the x-axis. The gradual compositional change can be directly related to the target geometry. Along the entire library, the Cu concentration varies between its extreme values of 68 and 5 at.%, whereas the Ni content has extremes at 6 and 32 at.%. Starting from the Cu-rich side on the left edge of the library, first a small increase of both Cu and Ni concentrations is detected. This is concomitant with a decrease in the O content from 40 to 20 at.%, where a minimum is attained at the position corresponding to the maximum amount of Cu (68 at.%). The variation of the O amount suggests a stoichiometric modification of the Cu and/or Ni oxides in this compositional range. The location of the maximum Cu and minimum O concentrations coincides with the position of the maximum film thickness previously discussed in Fig. 2(b). This suggests that the oxide film stoichiometry can also be influenced by the overall thickness. From the position of the maximum Cu amount, the Ni concentration continues to increase at the expense of Cu as a result of decreasing the distance to the Ni half-target. At the same time, the O amount continuously increases until a maximum of almost 80 at.% is measured at the end of the scan in the Ni-rich side. Given the decreasing thickness of the films at the edges of the library (see Fig. 2), this extreme O amount can be explained by a larger measurement error due to the tear-shaped volume from which the characteristic x-rays are emitted reaching the borosilicate glass of the substrates also containing O. Overall, the use of the O spectra may be arguable due to the variable thickness of the Cu–Ni oxide library, and therefore, the next results will be discussed using the ratio between the metallic components only. To quantify only the metallic compositional spread, the O curve may be excluded from the EDX spectra presented in Fig. 3(a). In this case, upon recalculation (using the EDX dedicated INCA software), a Ni composition variation between 8 and 72 at.% is computed together with a complementary Cu variation in the part (b) of Fig. 3. An overall metallic compositional spread of 63 at.% was therefore determined. This is the equivalent of a compositional resolution of approximately 1.2 at.%/mm.
EDX line scan analysis showing (a) the Cu, Ni, and O concentrations and (b) the recalculated Cu and Ni concentrations with respect to the position along the x-axis.

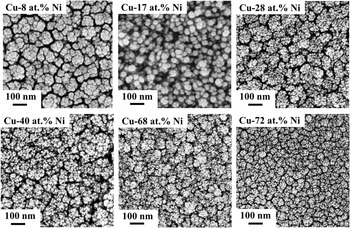
The microstructure of the Cu–Ni oxide thin film library was locally investigated by SEM on selected positions on the surface of the sample. In Fig. 4, SEM images of several relevant locations across the combinatorial library are shown. For each analyzed spot, the composition is given in the corresponding SEM image. Starting at low Ni concentrations (e.g., Cu–8 at.% Ni), a porous structure containing clusters of about 100 nm in size is formed. These clusters are the result of thin film formation processes typical for sputtering. Reference Thornton31 Additionally, it may be observed that these clusters are consisting of accumulations of smaller particles, which suggests an in-depth columnar structure, which is clearly seen through the increased Ni content, and which leads to a drastic change in the surface morphology of the Cu–Ni oxide compositional spread. The structure tends to become more open while forming distinct round clusters and/or singular grains on the surface with homogeneous grain sizes of approximately 50 nm. A distinct structural zone containing similar morphological features can be defined. This structural zone is defined by compositions ranging from approximately Cu–14 at.% Ni to Cu–19 at.% Ni, where the observed surface features are similar to the ones presented in Fig. 4 for 17 at.% Ni. A good correlation exists between the surface location of this compositional zone and both, the position of the Cu peak presented in Fig. 3(a) and the position of the film thickness maximum presented in Fig. 2(b). This may indicate that a modification of the mixed oxide stoichiometries can be directly related to a structural transformation of the Cu–Ni oxide library. This type of transformations can be encountered in fully miscible alloy systems (e.g., Cu–Ni, Al–Fe, etc.) and can indicate the presence of a percolation threshold, where one element starts forming a three-dimensional network within the matrix of another. Reference Mardare, Yadav, Wieck, Stratmann and Hassel32 With the increase of the Ni amount above 19 at.%, the overall appearance of the surface resembles the initially seen low Ni content regions as shown in the SEM recorded at Cu–28 at.% Ni. Clusters formed from multiple small grains are again visible, this time with smaller domain boundaries. Increasing the Ni content up to 72 at.% will not change this type of structure, but the grain size continuously decreases while conserving the round-shaped surface structure. A certain porosity level remains throughout the library while the domain boundaries become smaller and the surface looks more compact as is sequentially seen at 40, 68, and 72 at.% Ni.
SEM surface image of the Cu–Ni oxide library on selected positions along the sample. The figure shows the evolution of the grain size as well as a defined structural zone around Cu–17 at.% Ni.

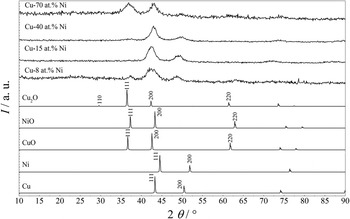
The crystallographic properties of the Cu–Ni oxide thin film compositional spread were investigated using GIXRD at selected locations along the substrates. Due to the grazing incidence technique, the irradiated spot length was 5 mm resulting in a compositional resolution of approximately 4 at.%. Results obtained at four different compositions are shown in Fig. 5 together with the patterns taken from XRD cards of the most relevant oxides and both used metals. Two Cu oxides (Cu2O and CuO) were found to best match the XRD measurements together with the NiO, which is the most stabile oxidized form of Ni. The interpretation of all XRD data is particularly difficult due to the close proximity of all oxide peaks. Nevertheless, since all oxides and metals are in a cubic phase, it can be safely assumed that along the Cu–Ni oxide library, only a cubic phase will be present. A clear indication for this assumption may be spotted in Fig. 5 in the spacing between the two main peaks which is almost constant. Three different locations of the measured x-ray diffractograms can be separately discussed. The presence of diffraction peaks at 2θ angles between 36 and 38° can be first observed for both high and low Ni concentrations (Cu–70 at.% Ni and Cu–8 at.% Ni, respectively). In this angle range, Cu2O, CuO, and NiO peaks can be identified, all being diffracted from (111) planes. This suggests that during the Cu–Ni oxide mixing in the reactive sputtering process, the (111) peak is present only for extreme Cu–Ni compositions close to the edges of the library. A second relevant diffraction peak is detected between 40 and 45° 2θ angles. Here, both Cu oxides and the Ni oxide have a (200) orientation, and a clear peak assignment as a function of the composition is difficult. Moreover, an overlapping between the metallic Ni and Cu (111) and the broad measured peak is present. This suggests that metallic phases may be mixed with the oxidized ones in the Cu–Ni oxide compositional spread possibly due to an incomplete reaction with O during the deposition process. Such an effect can be attributed to different O affinities of Cu and Ni. A further increase of the 2θ angle allows observing a third diffraction position between 47 and 51°. Here, all measured XRD patterns show the presence of a peak which is slightly shifted toward higher angles with the increase of the Ni content within the library. This type of smooth peak shifting usually suggests a gradual change between two different lattice parameters within the same symmetry (cubic in this case) as was previously perceived for a number of other thin film libraries produced by co-sputtering. Reference Mardare, Ludwig, Savan, Wieck and Hassel33–Reference Mardare, Ludwig, Savan, Wieck and Hassel35 Since only the metallic (200) peaks are close to this position, it can be assumed that the third measured XRD peak describes a metallic phase belonging to Cu–Ni mixtures. This idea is also supported by the peak positions corresponding to the highest and lowest Ni contents, which are approximately matching the Ni (200) and Cu (200) peaks, respectively.
GIXRD patterns measured for selected positions on the surface of the Cu–Ni thin film library and reference x-ray diffractograms.

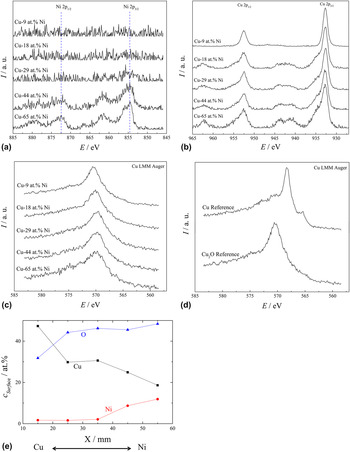
In an attempt to identify the chemical species present on the surface, XPS surface scans were performed along the Cu–Ni oxide compositional spread. All XPS spectra measured for the Ni clearly showed the presence of Ni2+ on the surface of the library, no indications of other oxidation states or metallic Ni being found; the spectra are shown in Fig. 6(a). For Ni concentrations down to approximately 40 at.%, NiO was detected on the surface, while decreasing the Ni amount in the library resulted in detection of very low Ni amounts close to the detection limit of the instrument. This may suggest a surface enrichment of Cu species for compositions with less than 40 at.% Ni. The analysis of the Cu spectra is much more demanding due to the extremely small chemical shift present between various oxidation states (below 1 eV). For this reason, separate CuO, Cu2O, and Cu samples were analyzed, and their spectra were used as reference when deciding upon the oxidation states of Cu. In part (b) of Fig. 6, five representative XPS spectra measured along the entire Cu–Ni oxide compositional spread are shown as measured for a binding energy range relevant for analyzing Cu species. The presence of the 2p 1/2 and 2p 3/2 doublet is clearly observable for all spectra, and their energetic position is indicated in the figure. Apart from this, at Ni concentrations above 18 at.%, a pair of satellite peaks are noticed centered approximately at 943 and 963 eV. According to the XPS reference spectra, these satellites are typical to the Cu2+ oxide, their presence not being found for either Cu1+ or metallic Cu. This fact is convenient since a distinction between the oxidation states of Cu can therefore be concluded without using the position of the main 2p peaks, which is very difficult in this case. At high Ni contents (e.g., Cu–65 at.% Ni), the presence of CuO on the surface is strongly evidenced by the presence of the satellite peaks, while high Ni concentrations below 18 at.% resulted in their total disappearance. Since metallic Cu and Cu2O are impossible to be separated from the XPS spectra alone, LMM Auger spectra were additionally measured. These results are summarized in Fig. 6(c) as measured at the same compositions previously analyzed by XPS. In part (d) of Fig. 6, reference spectra measured on pure Cu and Cu2O are plotted. The main peak for Cu+ is observable around 571 eV, whereas for Cu0 it is seen at 568 eV. The presence of an additional peak at approximately 565 eV for metallic Cu is observable differentiating between Cu0 and Cu+. In Fig. 6(c), the Auger spectra measured along the compositional spread under study clearly indicate the presence of Cu+ on the surface due to the main peak found around 571 eV and the absence of the metallic shoulder peak in all cases.
(a) XPS surface spectra of Ni for selected compositions along the Cu–Ni thin film library. (b) XPS surface spectra of Cu for selected compositions along the Cu–Ni thin film library. The spectra show the presence of satellites for higher Ni contents indicating an enrichment of Cu2+ in the film. (c) The LMM Auger spectra of Cu for selected positions along the Cu–Ni thin film library an (d) Cu0 and Cu+ reference spectra showing a shoulder for the metallic Cu around 565 eV. (e) The corresponding Cu, Ni, and O concentrations on the surface measured by XPS.

Since no metallic Cu was identified on the surface of the Cu–Ni oxide library, it can be concluded that, below 18 at.% Ni, the surface mainly contains Cu2O. This composition matches the previously defined structural zone using SEM imaging (Fig. 3). It seems that this also represents the threshold for the surface composition change from a mixture of CuO and NiO to Cu2O.
To quantify the amount of oxides present on the surface, the Ni and Cu XPS spectra were integrated, and the chemical compositions corresponding to each investigated spot were calculated. In Fig. 6(e), the amount of Cu, Ni, and O found on the surface is mapped along the entire library. The Cu–Ni gradient is indicated in the figure. The spot with the highest amount of Ni investigated (X = 15 mm) corresponding to the XPS spectra of Cu–65 at.% Ni presented in Fig. 6(b) shows almost 50 at.% O. This suggests that, for high Ni contents, the surface of the library consists of a mixture between NiO and CuO. The fact that the Ni content decreased to approximately 40 at.% may mean that the surface composition changes gradually toward a mixture of NiO and Cu2O, which is also supported by the decrease in O content. Eventually, the previously suggested presence of Cu2O on the surface for Cu–9 at.% Ni is quantified and confirmed by almost 30 at.% of O found. This, in turn, confirms that no NiO is present on the surface of the Cu–Ni oxide compositional spread at low Ni concentrations. A tendency of Cu to diffuse toward the surface even at high Ni concentrations (above 40 at.%) is suggested by the curves presented in Fig. 6(e), where it may be observed that the amount of Cu is higher than the amount of Ni.
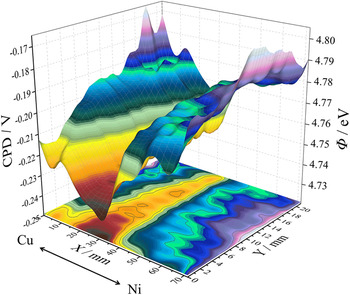
Due to the semiconducting properties of both Cu and Ni oxides, a surface potential map of the Cu–Ni oxide compositional spread was made using SKP. Due to the relative character of the measurements of surface potential, a dry redox couple Ag/AgCl reference electrode was used for calibrating the system. Reference Atanasoski, Huang, Albani and Orani36 The mapping of the local work functions corresponding to each analyzed point in the library was calculated based on the contact potential difference using the known work function of the reference electrode. Reference Hansen and Hansen37 In Fig. 7, the contact potential difference together with the work function mapping of the Cu–Ni oxide compositional spread is shown in a 3D plot as measured on one substrate only. This provides complete information about the entire library due to the symmetry and identical history between both samples, as previously discussed. A gradual decrease of the work function from the sample edges toward the center is detected. A region with a minimum work function of approximately 4.73 eV (minimal CPD of approximately −0.24 V) was found. The compositional zone corresponding to this region matches the transitional structural zone previously defined and discussed in the SEM analysis from Fig. 3. Moreover, the evolution of the work function across the Cu–Ni oxide library follows the same trend as the thickness profile described in Fig. 2. This represents an additional proof that the thickness of the thin films can affect the final properties of the library. Hints on the presence of Cu–Ni metallic phases were found in the XRD. These findings are supported by the work function mapping since lower values found in the center of the library could be associated with a certain degree of metallization. Different from the aspect of the 3D thickness profiling (Fig. 2), the work function decreases rapidly not only along the substrate (x-axis) but also shows a decay in the direction parallel to the section plane of the cathode (y-axis) from the edge of the film toward the center. This may suggest that a decreased O reactivity occurred in a small circular region at the position of the highest combined Cu/Ni deposition rate, which would be consistent with the special sputtering geometry of the sectioned cathode, as described in Fig. 1.
3D plot of the work function mapping of the Cu–Ni oxide compositional spread on one glass substrate using a scanning Kelvin probe. For a distinct compositional zone (around 25–30 mm on the x-axis), a drop in the work function is measured.

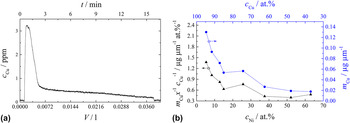
In a last experimental step, the chemical stability of the Cu–Ni thin film oxides has been investigated using 0.1 M HCl solution. For this purpose, dissolution experiments at selected positions along the Cu–Ni oxide compositional spread surface were performed using a V-shaped scanning droplet cell. Information about the Cu concentration in the downstream was provided by an attached AAS spectrometer continuously recording the obtained data. In Fig. 8(a), a typical dissolution curve is presented as recorded for Cu–13 at.% Ni. A sharp increase of the Cu concentration during the first 30 s after electrolyte contact is noticed describing the beginning of the dissolution process. After approximately another minute, a decay in the measured signal can be seen defining the main dissolution peak. At this point, most of the Cu oxides would probably be already dissolved. The fact that at the end of the main peak the signal level is higher than the initial background suggests that a Cu dissolution still takes place. During the next 13 min, a slower Cu release can still be observable, and this time consuming process can be correlated with the surface microstructure of the Cu–Ni oxide library described in Fig. 4. Most likely, after a main strong Cu dissolution from the film surface, Cu is still released from the depths of the film from the grain/domain boundaries as suggested by the previously mentioned porous microstructure. Apart from this, another possible reason for a slower Cu dissolution is the presence of more chemically stabile Cu-containing phases (e.g., metallic Cu). All dissolution curves measured at various locations along the library show the same characteristics, with a fast dissolution peak followed by a slow Cu release. To discuss the Cu amount dissolved as a function of Cu–Ni composition, each dissolution curve was integrated over volume and the corresponding mass of Cu was calculated. In Fig. 8(b), a mapping of the amount of Cu dissolved in the electrolyte is presented as normalized to the local film thickness using the thickness mapping discussed in Fig. 2. With the increase of Ni concentration within the Cu–Ni oxide library, a decrease in the Cu amount was found. Such decrease can be solely due to the lowered amount of Cu available when increasing the Ni concentration. However, simply calculating the ratio between the Cu composition (at.%) and the dissolved normalized Cu mass at each location would allow a quantification of the Ni influence on the Cu dissolution process. This information is also presented in the part (b) of Fig. 8. The decaying character of the thickness normalized mass plot as reported to the Cu concentration suggests that the increasing amount of Ni leads to a lowered amount of dissolved Cu. The structural zone is visible in this plot also where a lower data point appears at around Cu–15 at.% Ni. The presence of Ni within the Cu–Ni library enhances the corrosion resistance of Cu.
(a) A typical AAS dissolution curve for Cu in 0.1 M HCl and (b) normalized Cu mass for distinct positions along the sample with respect to the Cu–Ni concentration gradient.

IV. CONCLUSIONS
In the present work, a Cu–Ni oxide thin film compositional spread reactively co-sputtered from a Cu–Ni sectioned cathode was investigated. Local analysis of the film thickness using XRF showed a nonuniform profile with a maximum shifted toward the Cu side of the target due to the higher Cu sputtering yield. The compositional map of the library provided by EDX scanning showed a total compositional spread of 63 at.%. Crystallographic analysis done using GIXRD revealed the presence of CuO, Cu2O, NiO as well as a mixture of metallic Cu–Ni, meaning alloys of different compositions. Microstructure analysis via SEM indicated the presence of a distinct structural zone between oxides with metal ratios of Cu–14 at.% Ni and Cu–19 at.% Ni, where the porosity of the library surface is increased and smaller grain clusters are observable. The defined compositional zone correlates well with the region of the maximum film thickness and with the region of a minimum work function as measured by SKP. The chemical stability of the library was investigated using AAS coupled to a miniaturized electrochemical flow cell for Cu dissolution experiments in HCl solution. The presence of Ni was found to increase the corrosion resistance of the Cu–Ni oxides.
ACKNOWLEDGMENTS
The authors gratefully acknowledge assistance in XPS measurements by Jiri Duchoslav (ZONA).