Introduction
Modern agriculture is heading towards higher efficiency in order to be able to meet the increased world food demand (Tilman, Cassman, Matson, Naylor, & Polasky, Reference Tilman, Cassman, Matson, Naylor and Polasky2002). Higher efficiency is achieved through, among other methods, optimising field operations. Optimising the route followed by agricultural machinery in the field makes route planning an important technique to optimise field operations, as it decreases operational costs as well as environmental impacts (Bochtis & Sørensen, Reference Bochtis and Sørensen2009; Edwards et al., Reference Edwards, Hinge, Skou-Nielsen, Villa-Henriksen, Sørensen and Green2017). Route planning is furthermore becoming very relevant, now that autonomous vehicles are starting to be introduced into the agricultural industry (Bechar & Vigneault, Reference Bechar and Vigneault2016). Since route planners must be able to plan operations in real situations, they need to be tested in all kind of fields, including very irregular shaped boundaries and fields with obstacles or prohibited areas.
Due to geographical and topographical features, as well as man-made structures and political boundaries, field boundaries are diverse and hard to commonly define. The European Union Common Agricultural Policy requires that all field boundaries in the union are registered (EU Regulations 809, 2014), which provides a large dataset for researchers to utilise. However, testing a route planner on such a large dataset would require a large computational time. Therefore, a representative set of fields is necessary to robustly test the route planner.
Creating a subset of fields by choosing randomly from the field database may result in a non-representative sample of the diversity of fields, and can therefore result in unobserved behaviours of the route planning algorithm, specifically in the most extreme cases. Using a stratification strategy, where data are classified and separated into strata based on specific features, the diversity of a dataset can be maintained by selecting proportionately, but within upper and lower limits, from each stratum.
Field geometric features are already being used for different applications in agriculture. In the sector of precision agriculture, geometric features of a field are employed to evaluate the profitability of using automatic section control in spraying and sowing operations (Larson, Velandia, Buschermohle, & Westlund, Reference Larson, Velandia, Buschermohle and Westlund2016; Zandonadi, Luck, Stombaugh, & Shearer, Reference Zandonadi, Luck, Stombaugh and Shearer2013). It is necessary to know the potential overlap reduction in a field for evaluating the benefits of introducing automatic section control techniques in a farm, as these can depend on the field size and shape characteristics, as well as on implement features, such as working width. Field geometric features can therefore help determine the profitability of investing in automatic section control technologies for each specific case and farmer. Geometric features of fields are similarly used for evaluating operational efficiency and estimating costs for agricultural contractors, along with decision making in farm-land trading and in merging fields (Oksanen, Reference Oksanen2013). Furthermore, field geometric features are also used for estimating field efficiency in land consolidation projects, in order to group small and irregular shapes into shapes with improved efficiency (Gonzalez, Alvarez, & Crecente, Reference Gonzalez, Alvarez and Crecente2004).
Oksanen (Reference Oksanen2013) used the southern Finnish field database, with over 65,000 fields, to classify the set into simple categories and analyse the field geometric features statistically, concluding that approximately 75% of the fields did not belong to simple shapes. The study also analysed the relationship between the geometric features and field operational efficiency, concluding that it is possible to rapidly estimate field operational efficiency with the use of these features.
In the case presented in this article, the geometric features of a field are used to divide the fields into strata from which they are sampled proportionally, including at least one from each stratum, with the purpose of obtaining a more representative set of fields. The intention of the article is to present a stratification method to create a statistically representative set of Danish agricultural field shapes to robustly test route planning algorithms. The method is hypothesised to represent more variation of the fields than by randomly selecting a similar number of fields.
Materials and methods
According to the database of Danish agricultural fields (NaturErhvervstyrelsen, 2016) there are 603,218 fields in Denmark. A stratification strategy was used to classify and capture the great variation in the Danish fields. In order to create the desired set of fields, a number of different considerations are needed: firstly, the number of fields to use in the test, secondly, the criteria for separating the fields, and thirdly, the method for selecting the fields.
To estimate the total number of fields that it is possible to work with, a number of factors are taken into consideration. These include the processing power available, the allocated time for a test, and what is required to be tested. In the case of the route planner tested (Edwards et al., in press), it was found that 200 to 250 was an appropriate number of fields.
The different criteria to separate the fields were chosen with the intention of representing the whole spectrum of field shapes and types that were present in the Danish agricultural fields dataset. Four different geometric features were considered. The first feature was the size of the field. The second feature was the compactness of the field. The third feature was the complexity of the field. And lastly, the number of the obstacles was also considered. The size of a field was chosen to account for the principal factor in how long the optimisation takes. The second and third factors, i.e. compactness and complexity, were chosen to represent changes in the shape of the fields, thus they were chosen to represent as many different factors as possible, and also to account for the widest range of shapes possible. The last factor, i.e. the number of obstacles, was chosen because it directly affects the computational time, and it implies a different calculation in the route planning algorithm, making it consequently a factor that could not be ignored.
Compactness is generally defined as the ratio between the squared perimeter and the area for a two-dimensional object. For the purpose in this study, the compactness (Eq. (1)) was defined as the ratio of the area (A) to the squared perimeter (P).
 $$compactness{\,\equals\,}A\,/\,P^{2} $$
Two-dimensional complexity can be estimated in different ways according to the purpose of the study. For this study, complexity (Eq. (2)) has been defined as the number of vertices (V) with an inner angle larger than 180 degrees divided by the total number of vertices (N) represented in the field.
 $$complexity{\,\equals\,} {\raise0.7ex\hbox{${\sum_{i{\,\equals\,}1}^N 1_{{(V_{i} \,\gt\,180^{\circ})}} }$} \!\mathord{\left/ {\vphantom {{\sum_{i{\equals}1}^N 1_{{(V_{i} \,\gt\,180^{\circ})}} } N}}\right.\kern-\nulldelimiterspace}\!\lower0.7ex\hbox{$N$}}$$
Once the different features were defined, the fields were separated into three strata, for each of the four features. Thus by combining these, 81 different strata were created without having any overlap between each other.
The strata were chosen in the following fashion. For the size, compactness and complexity a value was calculated for each field. These values were then ranked, and each stratum was created by separating the fields based on their ranks. For the feature obstacles the three strata were made as following: no obstacles, one obstacle and more than one obstacle.
Finally, the representative subset is created by randomly sampling from each of the strata proportionally to the number of fields in that stratum, such that the total number of fields would be between the appropriate number of fields regarding the processing power available, the allocated time for a test, and what is required to be tested, i.e. between 200 and 250 fields. Moreover, a condition to the set creation was added that ensured that at least one field must be sampled from each stratum. In this way, a more diverse subset of fields is obtained than by randomly choosing the same number of fields from the complete set, whilst still retaining some of the statistical significances of randomisation.
Results
The stratification strategy provided a representative set of 217 fields out of the complete set of 603,218 Danish fields, with 81 strata defined.
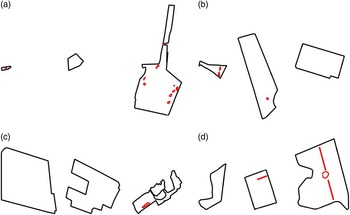
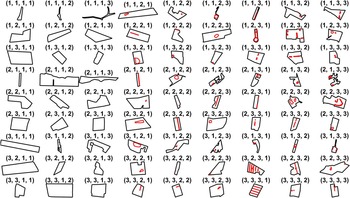
An example for each of the four features, i.e. size, compactness, complexity and number of obstacles, with the three strata represented is illustrated in Figure 1. The combination of the four features with three strata each produces in total 81 strata, which an example of each can be found in Figure 2.
Geometric features: size (a), compactness (b), complexity (c) and obstacles (d), with three strata levels each.

Example of fields of the 81 strata represented in the set, where 1 indicates low values, 2 middle values and 3 high values, for size, compactness, number of obstacles and complexity, respectively according to the position of the numbers.

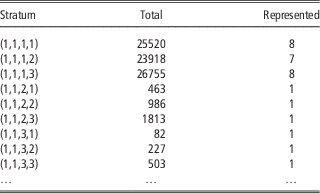
Due to space constraints, Table 1 only shows the results for the first line in Figure 2 to exemplify the results of the stratification strategy for each of the geometric features and strata. The table shows the number of fields represented in the first nine strata, showing the total number of fields and the represented number of fields in the stratum. The convolution of strata with largest amount of fields were very compact fields with low complexity and no obstacles; this group had 40,797 fields which were then presented by 13 fields in the subset. The convolution of strata with the smallest number of fields were small, very complex fields, with low compactness and more than one obstacle; this group only had 79 fields which were represented by one field in the subset.
Total and represented fields for each stratum

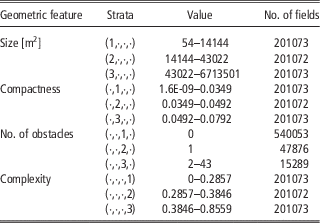
Table 2 shows the number of fields included in each of the three strata for each geometric feature chosen. The range of values for the fields in each stratum are also listed.
Geometric features and strata: values and number of fields in each subset

Discussion
The stratification strategy guaranteed a very diverse dataset that proved to be very useful for robustly testing the infield route optimisation algorithm. The strategy reduced the set of 603,218 fields into 217 representative fields that were possible to process with the power and time available. The stratification strategy presented a set that provided a larger number of bugs during the algorithm testing, compared to the set obtained by regular random sampling, which indicates the method improved the representativeness and was advantageous for the purpose of route planning testing and validation.
The resulting set of fields represents the large variation between fields when studied visually (Figure 2), although there are still variations that the chosen geometric features do not capture. To represent these, additional features could be added, thus adding more strata to the set, or the geometric features could as well be divided into more than three levels. However, this approach would require more fields to be included in the set; hence, despite the fact of increasing the representativeness, it would also increase the computational time to use the set. Therefore, only four geometric features where used for the study.
An alternative representative set would be created if four different features were used instead of the four chosen for this study, since by doing this it would approximately give the same number of fields in the set. Choosing a different geometric feature would require more precise knowledge on how the fields can be classified into different strata, and in the case of this study, how this new classification interacts with the infield route optimising algorithm. Rectangularity could be a plausible alternative geometric feature, used by other studies to describe field diversity (Oksanen, Reference Oksanen2013; Zandonadi et al., Reference Zandonadi, Luck, Stombaugh and Shearer2013), and standardly calculated as the ratio of the area of the region to the area of its minimum bounding rectangle (Rosin, Reference Rosin2003). Rectangularity has been considered to be covered by two of the already chosen features, i.e. compactness and complexity. Moreover, rectangularity alone does not provide the necessary information required to represent the diversity of fields to robustly test the route planner.
The geometric features used in the article were chosen for their calculation characteristics, which have been observed to cause possible problems in the route planning algorithm. Field size is directly related to the calculation time of the algorithm; number of obstacles can suppose important challenges for the calculations; compactness is related to the headland generation and complexity with the field boundaries, which can cause problems in the route generation. These features have therefore been prioritised over other relevant features, as the computational time and power limited to a maximum of four features to be handled. Nonetheless, it was found that the complexity feature caused some unexpected problems for representing relevant challenges for the route planner. For example, as it can be seen in Figure 2, fields with labels (1,2,1,1), (1,2,1,2) and (1,2,1,3) should be ordered by increasing complexity, which is neither clear visually nor it does represent higher challenge for the route planner. This can be caused by vertices that are not clearly visible, but that have an inner angle slightly wider than 180 degrees, increasing consequently the level of complexity, as it was measured in the study. A solution to avoid this problem would be to add a polygon simplification algorithm to the field generation, thus removing the problematic vertices from the polygon; another solution would be to include a weight on the vertices depending on the length of the lines they connect.
Based on the mathematical property, which says that by choosing proportional sampling it is ensured that any statistics calculated from the set will have an equal or lower variance than a random sampling from the complete set, it was ensured that the created set was more representative than the one created by random sampling (Asmussen & Glynn, Reference Asmussen and Glynn2007). Though proportional sampling was used to guarantee a reduction in variation of potential statistics; it is nevertheless not the best existing sampling strategy. There are other ways of sampling which lead to the lowest possible variance, but these require knowledge about the variance in the groups to be sampled from, which again defeats the purpose of only using a small number of fields, and is also dependent on the specific statistic calculated, thus it might lead to an optimum for a single statistic but not for all interesting statistics.
Another issue is the rounding of the number of fields in the strata, plus requiring the condition that at least one field from each stratum should be represented. This implies that the study presented here is not using perfect proportional sampling, but only an approximation. This fact could be argued to affect the guarantee of reduction in variance, which would in fact be true. However, proportional sampling was still chosen for its properties, as it presented a simple way of choosing the number of fields for the strata, with the information available at the time of sampling. And in addition, it also retained some very good properties about the potential reduction of variance. Furthermore, proportional sampling with the mentioned condition was used as it retained more extreme cases of fields than random sampling, which represents many average fields. It is therefore justified the requirement of having at least one field from each strata. This representation of extreme cases is actually helpful as it allowed the route planner to be tested on more diverse fields rather than by using random selection of fields, and ensure a more robust test procedure.
The division of the geometric features into four strata permitted to represent a number of fields, which otherwise would probably not have been considered. For example, the feature number of obstacles was manually divided into no obstacles, one obstacle and more than one obstacle, allowing testing of the route planner on fields with several obstacles, which only represent 2.5% of the fields in the dataset, and which otherwise may not had been represented in randomly sampled subset (Table 2).
Lastly, the set cannot be validated with a statistical method, because the purpose of the method used is to test how well the potentially troublesome fields are represented. It would require the testing of large quantity of fields, with its consequently very high computational time, to use random sampling instead.
The use of the stratification strategy can be extended to any project where it is necessary to test representative sets of big amounts of data, with a reduced time or power capacities. Likewise, geometric features are well suited to strata creation, and are both applicable to make representative field datasets and to target a set with some desired characteristics. Additionally, if the processing power available increases, a new set can be made with added precision just by adding more strata and then sampling again.
Conclusion
The results of the study indicate the use of stratification strategy as a satisfactory method to represent the variety of fields of a large database, with the goal of robustly testing an infield route planner. Four geometric features, each divided into three strata, provided enough information to create a representative set of the diversity of fields in the dataset. The number of geometric features and strata used were limited by the minimum appropriate number of fields for the processing power available and the allocated time for testing. The method created a set of 217 fields out of 603,218 fields from the Danish field database used for testing the route planner. The strategy allowed testing on more extreme field cases and on the variety of fields, than by randomly sampling from the whole set.
It can therefore be concluded that the stratification strategy with proportional sampling is suitable for working with reduced representative sets of large databases.