Assessing farm animal welfare has become a well-researched field of study (Blokhuis et al., Reference Blokhuis, Jones, Miele, Veissier, Blokhuis, Miele, Veissier and Jones2013; Miele et al., Reference Miele, Blokhuis, Bennett, Bock, Blokhuis, Miele, Veissier and Jones2013). Consumers have become more conscious about what is happening on farms, and most of them show concern about this, even if they do not act as if this were so when they are behaving as consumers (Grunert, Reference Grunert2006; Verbeke et al., Reference Verbeke, Perez-Cueto, de Barcellos, Krystallis and Grunert2010). Efforts to reduce poor welfare are of interest to the general public as well as producers and academics. Solutions to welfare problems on-farm are, therefore, important for farmers.
Welfare assessment is one way for a farmer to understand the bottlenecks preventing high quality husbandry in his/her farm and how to overcome them. Assessing welfare effectively is not achieved by the consideration of one single measure, but by looking at different aspects that affect animals’ wellbeing in their environment (Fraser, Reference Fraser1995). Much research considers a single measure and how this affects the animals’ welfare. In the current trial it was decided to focus on cows’ activity, because this reflects cows’ health and, therefore, production and can be considered to be related to welfare (Ladewig and Smidt, Reference Ladewig and Smidt1989; Müller et al., Reference Müller, Ladewig, Thielscher and Smidt1989; O'Driscoll et al., Reference O'Driscoll, Boyle and Hanlon2008).
Monitoring dairy cow behaviour has become increasingly important and it is relatively common to monitor health and welfare on an individual basis (Nielsen, Reference Nielsen2013). Available techniques include the Rumiwatch system to monitor feeding, ruminating and activity, Ice Tag Sensors to monitor cows activity, SCR Heatime, Cow Scout and Smartbow for heat detection and health monitoring and Pro Calve that gives pre and post calving distress alerts.
One of the bases for the improvement of the quality of animal husbandry is a complete knowledge of behavioural activity (Brzozowska et al., Reference Brzozowska, Łukaszewicz, Sender, Kolasińska and Oprządek2014). The level of daily activity of cows has proven to be indicative of physiological and health status and gives indirect feedback about their comfort and welfare (Tolkamp et al., Reference Tolkamp, Haskell, Langford, Roberts and Morgan2010). Their locomotive behaviour may be affected by fresh feed delivery, return from milking, group size, stocking density and housing system. Steensels et al. (Reference Steensels, Bahr, Berckmans, Halachmi, Antler and Maltz2012) state: ‘Changes in behaviours such as activity and resting, can reflect disturbance in a herd, and be related to decreased productivity of the livestock’. A complication in analysing dairy cow activity is that cows are social animals and often synchronize their behaviour (Færevik, et al., Reference Færevik, Tjentland, Løvik, Andersen and Bøe2008; Stoye et al., Reference Stoye, Porter and Stamp Dawkins2012) though cows at a lower stocking density, or in smaller groups, display more behavioural synchrony than cows in a larger groups (King et al., Reference King, Crossley and DeVries2016).
When cows have the possibility to graze, they walk for about 4 km per day and lie down about 9–12 h (Broom and Fraser, Reference Broom and Fraser2007), and these behavioural preferences should be borne in mind when considering the daily activities of housed cows. When indoors, the opportunity for these activities is likely to be restricted. Changing the feed, and feed source, or changing feeding groups can compromise the cows’ preferred spectrum of daily activity. It has recently been reported that when cows change groups, usually for feeding reasons, their welfare can be compromised (Pavlenko et al., Reference Pavlenko, Lidfors, Arney, Kaart and Aland2017). Therefore, we investigated the hypothesis that changing the feeding bin for dairy cows affects their behaviour.
Materials and methods
Study farm and its management
The study was carried out on the experimental dairy farm of the Estonian University of Life Sciences farm in South- Estonia. The farm houses around 250 cows, including dry cows and youngstock, under a zero grazed system. Lactating cows are housed in a single building and youngstock and dried cows are housed in an adjacent building. The farm includes both a milking parlour and a DeLaval milking robot; half of the lactating cows are milked in the milking parlour and the other half are milked by the milking robot. This study was carried out with cows in the first group of parlour-milked cows. The cows were loose housed with cubicles covered with rubber mattress bedding. A mixture of peat and sawdust was laid on the mattresses every day. Cows were fed, from 30 feeding bins, a total mixed ration ad libitum that consisted of a grass and clover silage and a concentrate feed of barley and rapeseed cake, which was fed in proportions according to milk yield. The feeding bins were accessible by cows through automatic recognition of transponders around their necks. The bin automatically recorded the weight of feed removed per visit, and the time and duration of each feeding act by each cow. Access to water was available all of the time. There were three feeding groups based on milk yield, and each group's feed was delivered from 10 bins. Each cow had access to any of the appropriate 10 feed bins with the same ration. The groups were not physically separated, but groups fed different diets within the singly-housed herd. The feeding groups were: high (first group), medium (second group) and low (third group). The last group consisted of cows who were in preparation for drying off.
Study plan
The experiment was designed to investigate if changing feeding source affects dairy cows’ activity, which might indicate risk to cows’ welfare. Ten lactating cows, three primiparous and seven multiparous, were selected based on those that were planned to imminently change their diet, either from first to the second group or from the second to the third group. Ice Tag activity monitors (IceRobotics, EH30 9TF, UK) were attached to each of the cows’ right hind legs, and motion index, standing, lying, steps and lying bouts data were downloaded to a laptop by Ice Manager every week. Health data were collected, but the sample cows did not have any health problems identified during the time they were monitored.
Cows were monitored for 14 d before and 14 d after diet and group change. Feeding group change meant that the cows had to find new bins to feed from to access their feed. One cow was moved after 14 d of monitoring straight to the dried off area. This cow, and four others that had been monitored previously, were also monitored in the dried off housing area for 5–14 d. Due to technical problems, the number of steps for one cow who went straight to the dried off area were not registered. For statistical analyses it was decided to use her data only for analyses of the dried off area effect.
Statistical analyses
The statistics selected and the style of presentation of the results were chosen to take account of the possibility of behavioural synchronicity between sample cows. From the collected data the mean daily values from minute-based observations were calculated. The lying and standing times registered in seconds were converted to proportions per minute. Daily mean motion index, number of steps (per minute) and proportion of lying and standing before and after ration change and in the dry period were compared with a general linear mixed model. The right skewed distributed number of lying bouts per minute were analysed with a generalized linear mixed model with logarithm link function. Both models took into account fixed effects of time period and parity and random effect of cows. The Satterthwaite approximation for the denominator degrees of freedom was applied. The results are expressed as least square means with standard errors and the differences are considered statistically significant at P ≤ 0.05.
For each variable two separate analyses were made: (1) consideration of nine cows with data before and after ration change, and (2) considering five cows (four cows in number of steps analysis) with data also from the dry period.
For modelling MIXED and GLIMMIX with SAS 9.4 were used. The figures to describe the behaviour of single cow at different time periods were constructed with R 3.2.3.
Results
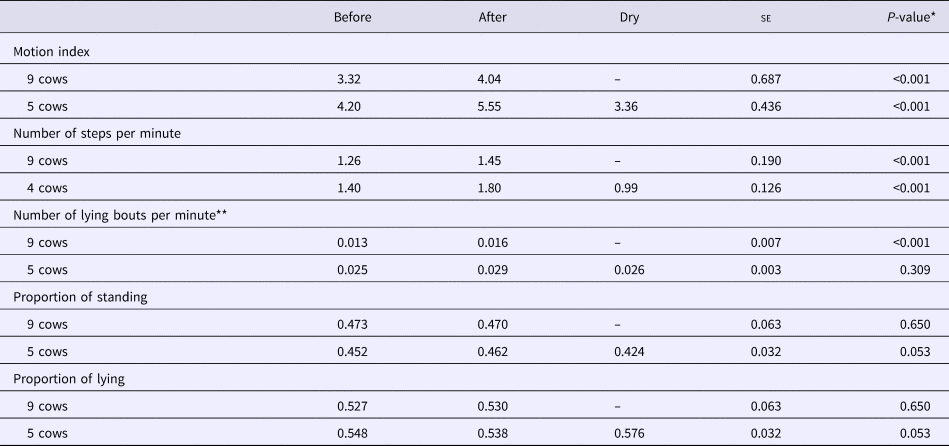
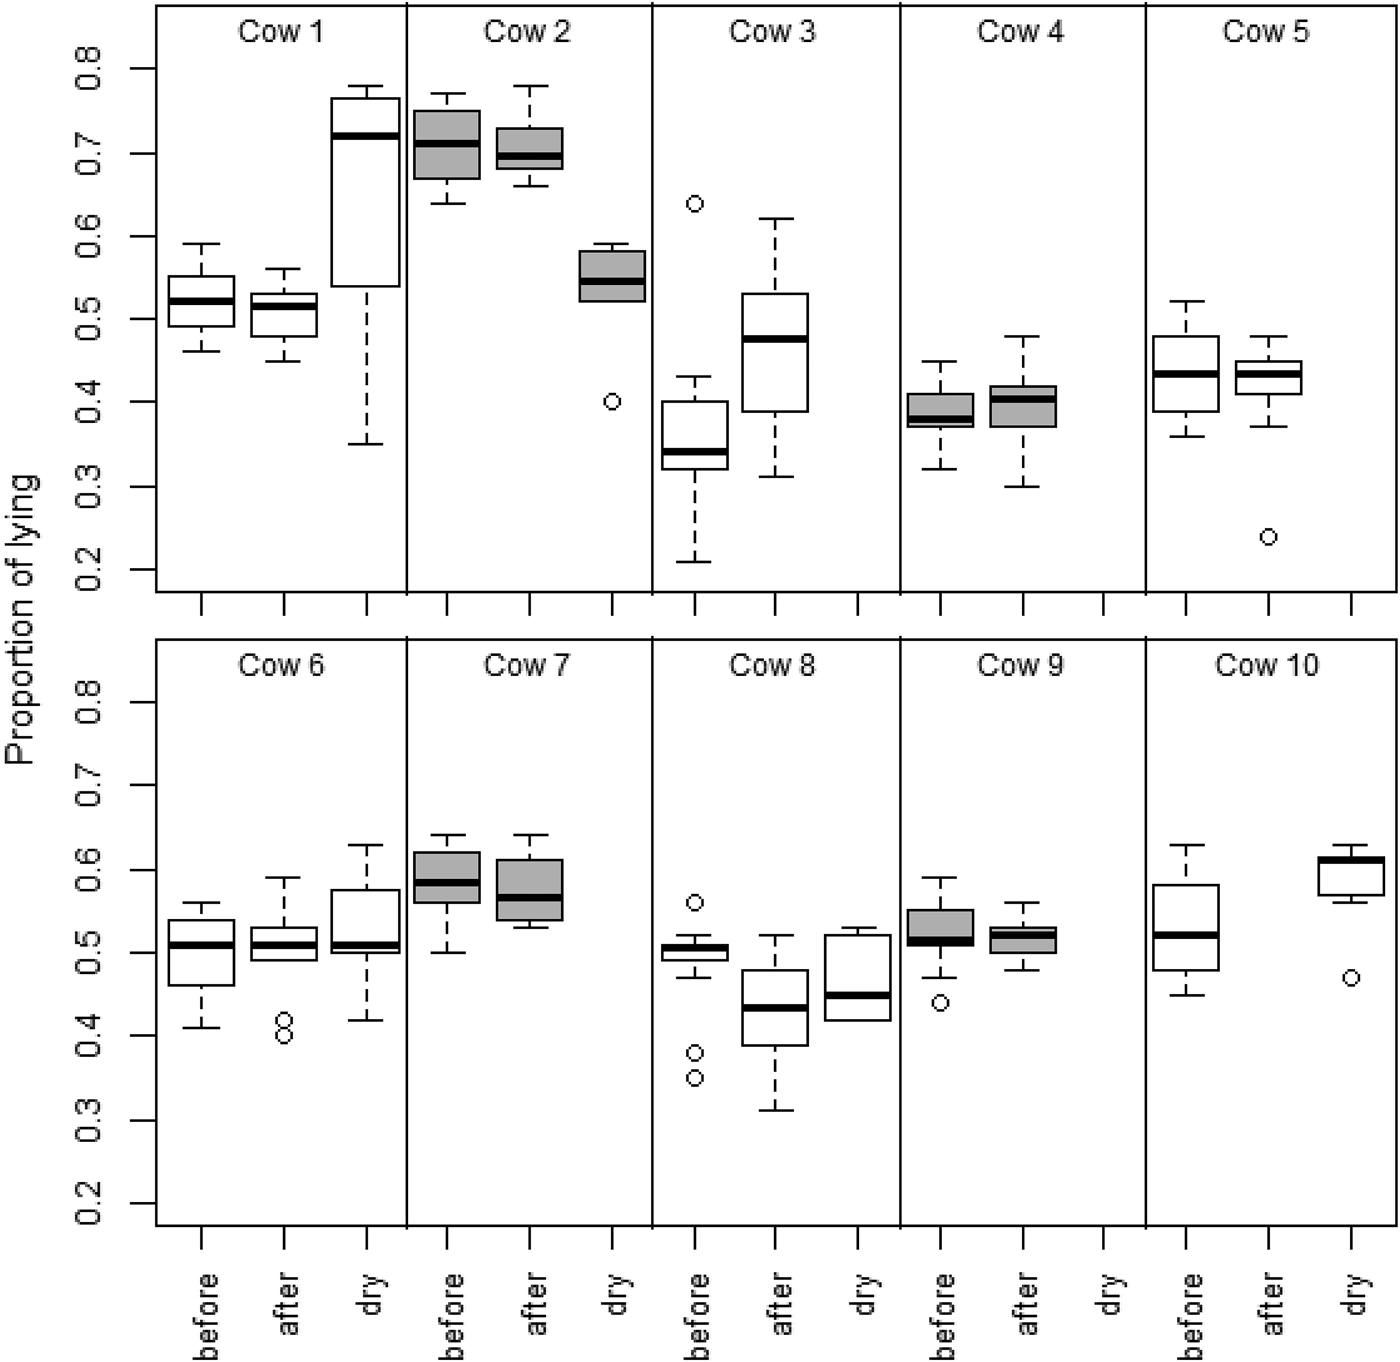
Comparing the behaviour of nine cows 14 d before and 14 d after ration change revealed significant increases in motion indices, number of steps taken per minute and number of lying bouts per minute (all P < 0.001, Table 1). Primiparous cows reacted more strongly to feeding bin change, which was characterized by significantly higher changes in motion indices and steps taken per minute compared with multiparous cows (both P < 0.001). If among multiparous cows the motion index value increased by 0.36 (standard error se = 0.181) and the number of steps taken per minute increased by 0.08 (se = 0.054), then among primiparous cows motion index and steps taken per minute increased four-five times higher, being 1.44 (se = 0.256) and 0.43 (se = 0.076) respectively. There was no single observed change in lying and standing – some cows tended to lay more and stand less after ration change, while some cows behaved the opposite and some cows did not change their lying and standing behaviour (Fig. 2). There was no mean change in standing and lying times after feed bin change (P = 0.650, Table 1).
Least square means with standard errors (se) of different behavioural characteristics before and after ration change and in the dry period

*according to the general linear mixed model considering fixed effects of time and parity, random effect of cow, and using the Satterthwaite approximation for the denominator degrees of freedom.
**generalized linear mixed model with logarithm link function, least square means are back transformed using the link option in SAS procedure GLIMMIX.
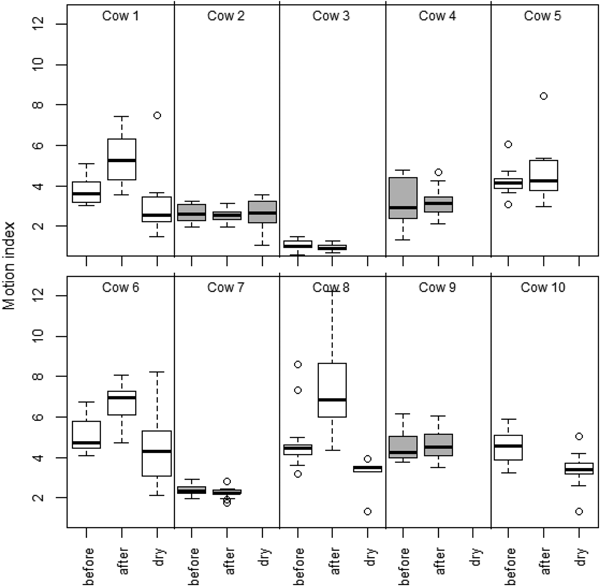
Comparing the behaviour of five cows followed during the dry period showed significant differences in motion indices and numbers of steps taken per minute (P < 0.001). The direction of change after cows went to the dried off area remained the same – the motion indices and numbers of steps increased. The mean values of motion indices and numbers of steps taken per minute were lower in the dry period compared to those before and after feeding bin change (Table 1, Fig. 1). No statistically significant differences in mean numbers of lying bouts were found. In the dry cow pen, cows stood less and lay more, but these changes varied between cows (Fig. 2), and the overall time effect was not statistically significant.
Daily mean motion index values of cows 14 d before and 14 d after ration change and at the beginning of the dry period.

Daily mean lying time proportions of cows 14 d before and 14 d after ration change and at the beginning of the dry period.

Steps
The results show that the greatest difference between the two groups was the number of steps cows made before and after feeding bin change, 1.26 and 1.45 steps per minute respectively, although this was not significant. Overall, the frequency of the number of steps per minute was significantly higher after feeding bin change (Table 1). All five cows who had activity monitors attached when they were transferred to the area where the dried off cows were kept, walked less when dried off (before drying off 1.40%, after 1.80 steps per minute; P < 0.001). The step count data of one cow was not included because the ice tag did not monitor the number of steps correctly. All first lactation cows had an increase in step count following change of feeding bins. The greatest individual differences between the day before and the day after feeding bin change were 2982 and 1402 steps (both differences P < 0.001).
Motion index
Overall motion index increased on changing feed bins (before 3.32% and after 4.04%; P < 0.001). Five cows who were observed in dried cows pen increased motion index from 4.20 before to 5.55 after transition to the dried off housing (P < 0.001).
Standing time
Overall standing time did not significantly change after feeding bin change (before 0.473% and after 0.470%; P = 0.650). The standing durations before and after feeding bin change were not significantly different. Overall the time spent for standing after feeding bin change decreased for four cows and increased for five cows.
Lying time and bouts
Overall lying time increased (before 0.527% and after 0.530%; P < 0.001) after feeding bin change. There were no significant difference for lying time by days and ration. Number of lying bouts per minute increased from 0.013 to 0.016 (P < 0.001) after feeding bin change. Cows who went to the dry cows pen did not have a significantly changed number of recorded lying bouts. There was no significant difference for lying bouts for days by ration.
Discussion
Grouping of cows is a normal practise in the dairy industry for feed management reasons. After feeding bin change, and after moving to the dried off pen, it took 3–5 d for the cows’ behaviour to return to the pre-change values. This is in line with work reported by Kondo et al. (Reference Kondo, Kawakami, Kohama and Nishino1984) and Hasegawa et al. (Reference Hasegawa, Nishiwaki, Sugawara and Ito1997), who found that it took 5–15 d for social behaviour and locomotion activity to return to normal after regrouping, or after the introduction of a new animal into a group. It was interesting to see that although data values normalized it was evident that the motion indices, number of steps taken per minute and lying bouts per minute were higher than previous values at the 7th, 8th or even at the 17th day after feeding bin change; this from Ice-tag data that was collected after the end of the trial at 14 d post change. It would have been interesting to have video recorded the sample cows to explore the reasons behind these increases. Primiparous cows who had never experienced feeding bin change reacted more strongly than multiparous cows. This could be the reason of novelty, which is a strong stressor (Grandin, Reference Grandin1997).
Von Keyserlingk et al. (Reference Von Keyserlingk, Olenick and Weary2008) monitored cows in mid-lactation before and after they were placed into a new social group. They found that after the change cows reduced their time spent feeding, time spent lying down, and time spent allo-grooming. In this study lying bouts data from activity monitors were not statistical different in response to the feed bin changes. When changing feeding bins, the behaviour of the sample cows differed within groups. While this might possibly have been the result of the small sample size, it may have been related to different motivation to feed between the cows in the different yield groups.
Cows are diurnal and synchronize their behaviour with their close neighbours (Boyland et al., Reference Boyland, Mlynski, James, Brent and Croft2016). After the automatic feeder has delivered feed, or when they return from milking, most cows feed. Cows whose ration has just been changed may experience more frustration, because they are not able to get access to their feed from the same bins as previously (the bin that they expect to be able to access). Those cows who are not so determined to push other cows away or find another bin may return to the lying area, with their motivation to feed unsatisfied. Others, who are more determined to get access to their ‘old’ feeding bin may try to push other cows away (Soonberg and Arney, Reference Soonberg and Arney2014) or by trial and error find the right bin to which they have access.
In the dried off area there was not enough room for all cows in the pen to feed at the same time. This can be expected to have been a cause of frustration, particularly for submissive cows. Bewley et al. (Reference Bewley, Boyce, Hockin, Munksgaard, Eicher, Einstein and Schultz2010) and Løvendahl and Munksgaard (Reference Løvendahl and Munksgaard2016) have found that at the end of lactation lying times increase. Lying bouts (but not times) decreased in the Løvendahl and Munksgaard (Reference Løvendahl and Munksgaard2016) study and also in ours, but an increase in lying time was observed only for two cows out of the five who were removed to the dried off pen.
Although the sample size was small this study suggests that changing the feeding site in a group has an effect on the activity of cows with possible consequences on their welfare. There is evidence, therefore, to support the underlying hypothesis that changing the feeding bin for dairy cows affects their behaviour.
Acknowledgement
This research was supported by institutional research funding IUT8-1 of the Estonian Ministry of Education and Research.