Introduction
The columbite supergroup, recently approved by the Commission on New Minerals, Nomenclature and Classification of the International Mineralogical Association (IMA-CNMNC; Memorandum 108-SM22 of 20.06.2022; Chukanov et al., Reference Chukanov, Pasero, Aksenov, Britvin, Zubkova, Yike and Witzke2023a) includes five mineral groups (ixiolite, wolframite, samarskite, columbite and wodginite) and one ungrouped species (lithiotantite). All minerals belonging to the columbite supergroup have the stoichiometry MxO2x and are topologically related to columbite. Their crystal structures are based on the hexagonal close packing of anions (or close to it) and zig-zag chains of edge-sharing M-centred polyhedra. In ixiolite-group minerals (space group Pbcn, Z = 4), all cations are disordered and occupy a single M site. These minerals have the smallest unit cell volume whereas representatives of other groups belonging to the columbite supergroup are characterised by different schemes of cation ordering, which results in changes of symmetry and/or multiplication of unit-cell dimensions.
The new mineral species nioboixiolite-(Fe3+), described in this paper, is named in accordance with the current nomenclature of columbite-supergroup minerals (Chukanov et al., Reference Chukanov, Pasero, Aksenov, Britvin, Zubkova, Yike and Witzke2023a). The mineral, its name and symbol (Nbix-Fe3+) have been approved by the IMA-CNMNC (IMA No. 2024-057). The type specimen is deposited in the collections of the Fersman Mineralogical Museum of the Russian Academy of Sciences, Moscow, Russia with the registration number 6169/1.
Experimental methods and data processing
The Raman spectrum of nioboixiolite-(Fe3+) has been obtained from a polished section using an EnSpectr R532 spectrometer based on an OLYMPUS CX 41 microscope coupled with a diode laser (λ = 532 nm) at room temperature (Moscow State University, Faculty of Geology, Dept. of Mineralogy). Incident laser radiation was linearly polarised. The spectra were recorded in the range from 100 to 4000 cm–1 with a diffraction grating (1800 gr mm–1) and spectral resolution of ∼4–6 cm–1 (Raman Analyzer Specification). The Rayleigh line was corrected with a cutting-edge low pass filter. Scattered radiation was recorded with a Linear CCD Array detector with 3648 pixels and pixel size 8 μm × 200 μm. The output power of the laser beam was ∼16 mW. The diameter of the laser spot on the sample was 15 μm. The back-scattered Raman signal was collected with a 40× objective; entrance aperture 20 μm wide slit; signal acquisition time for a single scan of the spectral range was 1 s, and the signal was accumulated over 50 scans. Crystalline silicon was used as a standard.
Chemical analyses (4 points) were carried out on a polished section using an Oxford INCA Wave 700 electron microprobe operating in WDS mode with 20 kV, 20 nA and a 1 μm beam diameter. Acquisition time was 40 s. The SEM microscope is equipped with detectors of secondary and back-scattered electrons based on YAG. The following standards were used: diopside for Mg, albite for Al and pure elements for the other components.
For the determination of the oxidation state of iron in nioboixiolite-(Fe3+), a method based on X-ray spectroscopy was used. Recently, X-ray spectroscopic methods have been used as an alternative method for determining the oxidation state of Fe (Kupriyanova et al., Reference Kupriyanova, Filippov and Lyamina2003; Mukhanova et al., Reference Mukhanova, Kupriyanova and Morgunova2008; Chubarov et al., Reference Chubarov, Finkelshtein and Amirzhanov2009; Finkelshtein and Chubarov, Reference Finkelshtein and Chubarov2010; Murashko et al., Reference Murashko, Chukanov, Mukhanova, Vapnik, Britvin, Krivovichev, Polekhovsky and Ivakin2011; Chukanov et al., Reference Chukanov, Mukhanova, Rastsvetaeva, Belakovskiy, Möckel, Karimova, Britvin and Krivovichev2011a, Reference Chukanov, Rastsvetaeva, Britvin, Virus, Belakovskiy, Pekov, Aksenov and Ternes2011b), and have been applied in this study. The methodology is based on the ratio of intensities of different K-lines of X-ray spectra of an element. In this work we used the ratio of the intensities I of the FeKβ5 and FeKβ1 lines to determine the value δ = [I(FeKβ5)/I(FeKβ5)].
The X-ray spectra of the FeKβ5 and FeKβ1 lines were obtained at the D.S. Korzhinskii Institute of Experimental Mineralogy using a scanning electron microscope Tescan Vega XMU equipped with an INCA wave 700 X-ray spectrometer (Oxford INCA Wave 700). Spectra were obtained over 1 minute in WDS mode with 20 kV, 100 nA and a beam diameter of 3.5 mm. A LiF crystal was used as an analyser.
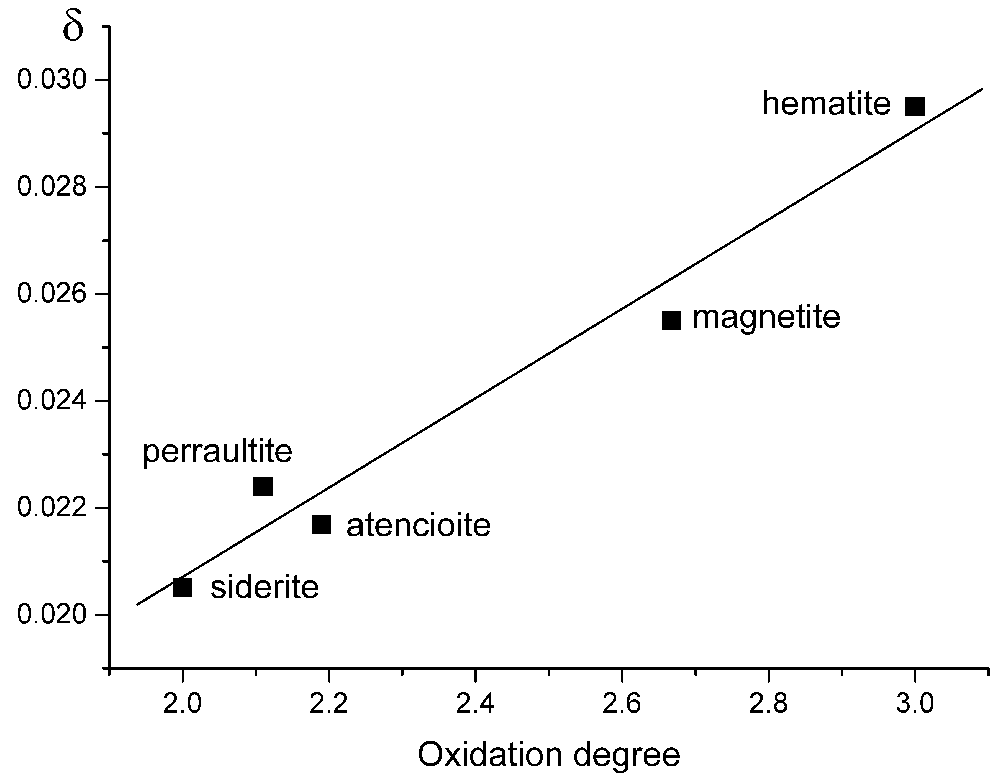
X-ray spectra of standards were obtained directly before the collection of data on nioboixiolite-(Fe), the δ value obtained was correlated with δ values obtained from hematite (Fe2O3), magnetite (Fe3O4) and siderite (FeCO3), as well as Fe3+-bearing atencioite (ideally Ca2Fe2+3Mg2Be4(PO4)6(OH)4·6H2O, Chukanov et al., Reference Chukanov, Rastsvetaeva, Möckel, Zadov and Levitskaya2006), and Fe-bearing perraultite ((Ba,K)2CaNa(Mn,Fe2+,Fe3+)8Ti4(Si2O7)4O4(F,OH,O)6, Rastsvetaeva et al., Reference Rastsvetaeva, Еskova, Dusmatov, Chukanov and Schneider2008), in which the Fe2+:Fe3+ ratio was determined by means of Mössbauer spectroscopy, as shown in Fig. 1. Its linear approximation corresponds to the equation η = 120.5×[I(FeKβ5)/I(FeKβ5)] – 0.4609. The estimated error of the determination of δ from this correlation is ±0.08.
Correlation between oxidation degree of iron in minerals and the ratio of intensities of the FeKβ5 and FeKβ1 lines in X-ray spectra.

Reflectance values for nioboixiolite-(Fe3+) have been measured in air using an MSF-R (LOMO, St. Petersburg, Russia) microspectrophotometer. Silicon was used as a standard. The photometric aperture diameter was 0.3 mm, monochromator exit slit size 0.1 mm and spectral interval 6 nm.
Powder X-ray diffraction data were collected using a Rigaku R-AXIS Rapid II diffractometer (image plate), CoKα, 40 kV, 15 mA, rotating anode with the microfocus optics, Debye-Scherrer geometry, r = 127.4 mm and exposure 15 min. The raw powder XRD data were collected using the program suite designed by Britvin et al. (Reference Britvin, Dolivo-Dobrovolsky and Krzhizhanovskaya2017). Calculated intensities were obtained by means of STOE WinXPOW v. 2.08 program suite based on the atomic coordinates and unit-cell parameters.
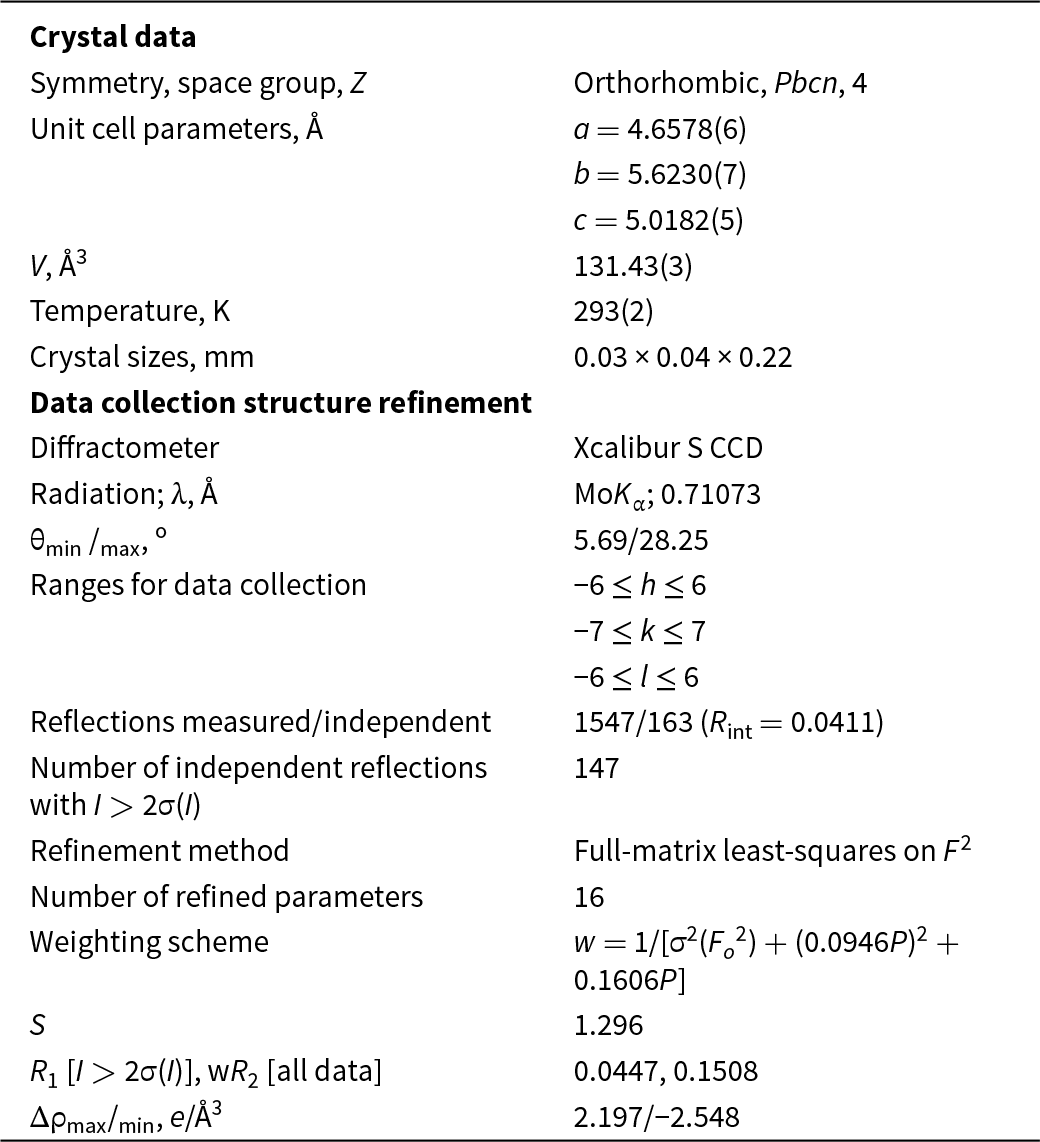
The crystal structure has been determined using single-crystal X-ray diffraction data and published elsewhere (Zubkova et al., Reference Zubkova, Chukanov, Pekov, Ternes, Schüller and Pushcharovskii2021). Crystal data, data collection information and structure refinement details are given in Table 1. Experimental data were processed using the software package CrysAlisPro v. 1.171.39.46 (Rigaku, 2018). The crystal structure was determined by direct methods and refined using the set of programs SHELX (Sheldrick, Reference Sheldrick2015).
Crystal data, data collection information and crystal structure refinement details for nioboixiolite-(Fe3+)

Results
Occurrence, general appearance and physical properties
The new mineral occurs in cavernous nosean sanidinite of the Laach Lake (Laacher See) volcano, Eifel region, Rhineland-Palatinate, Germany. The studied specimen was collected in the ‘In den Dellen’ (Zieglowski) pumice quarry, 1.5 km NE of the town of Mendig (50°23’40’’ N, 7°17’12’’ E).
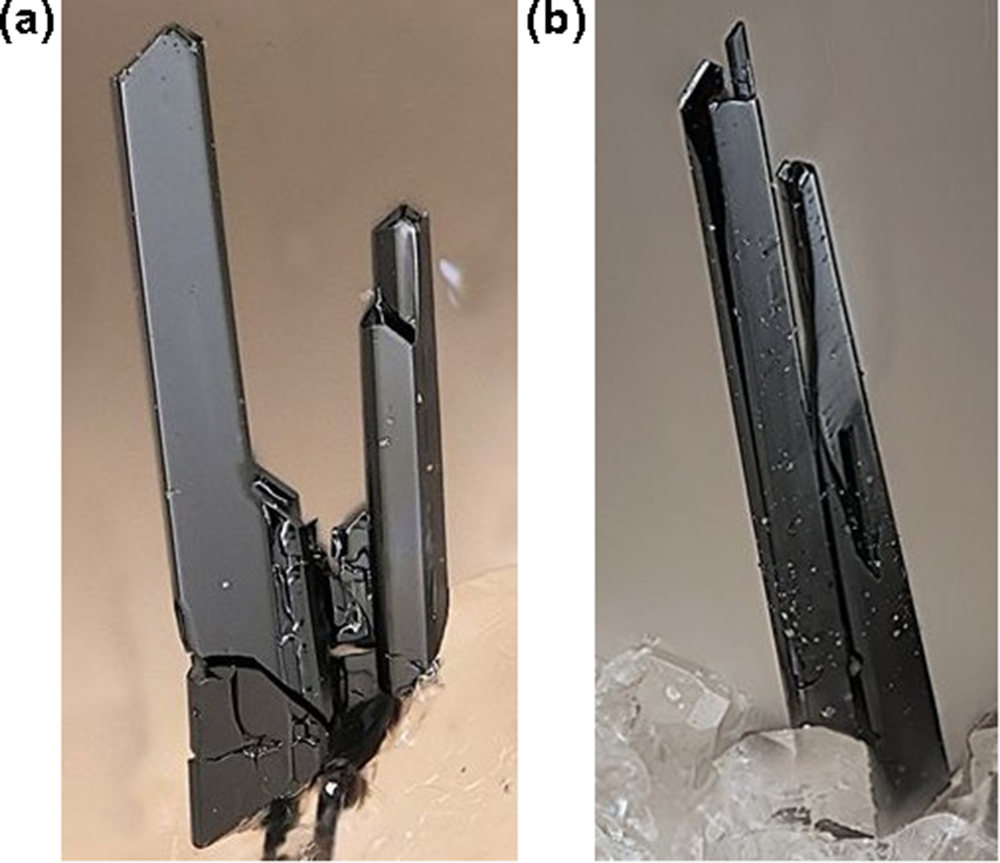
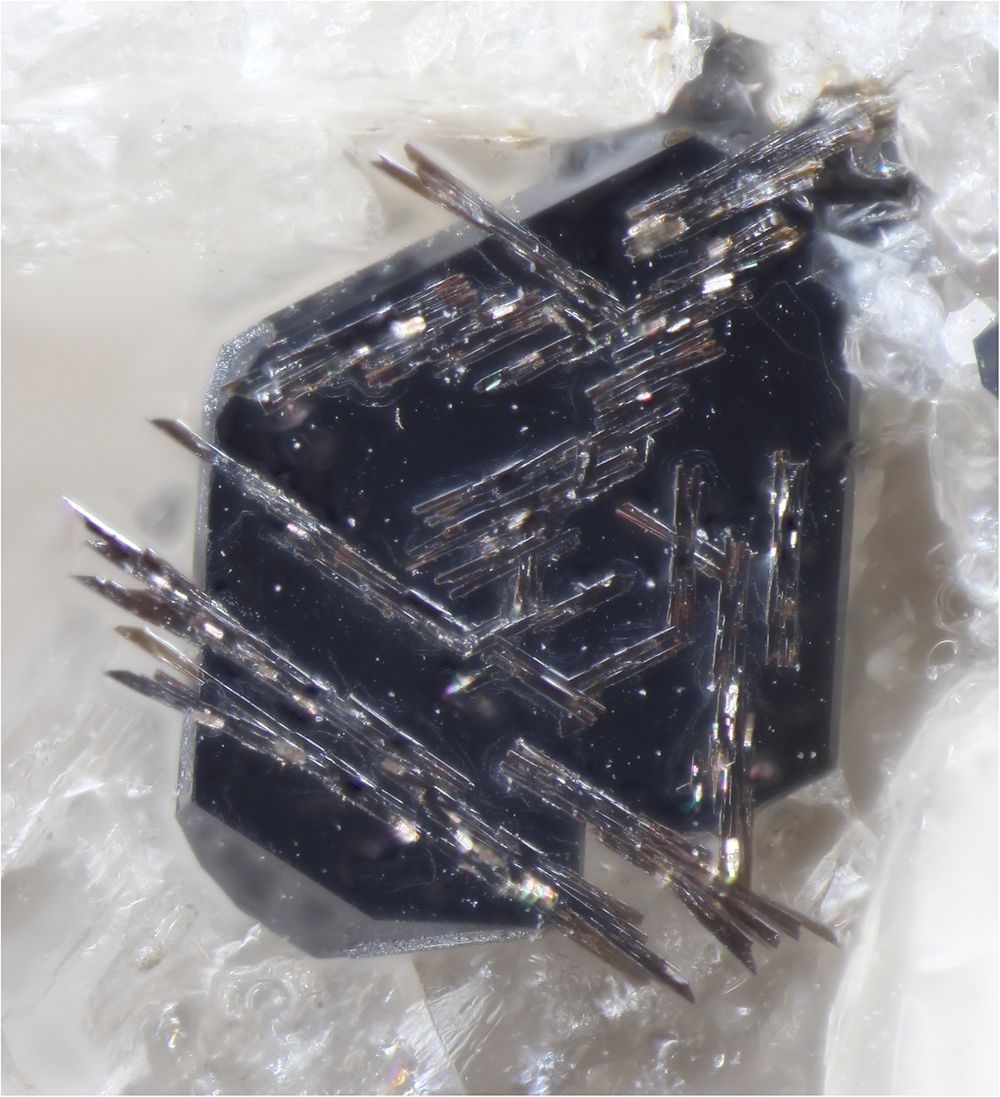
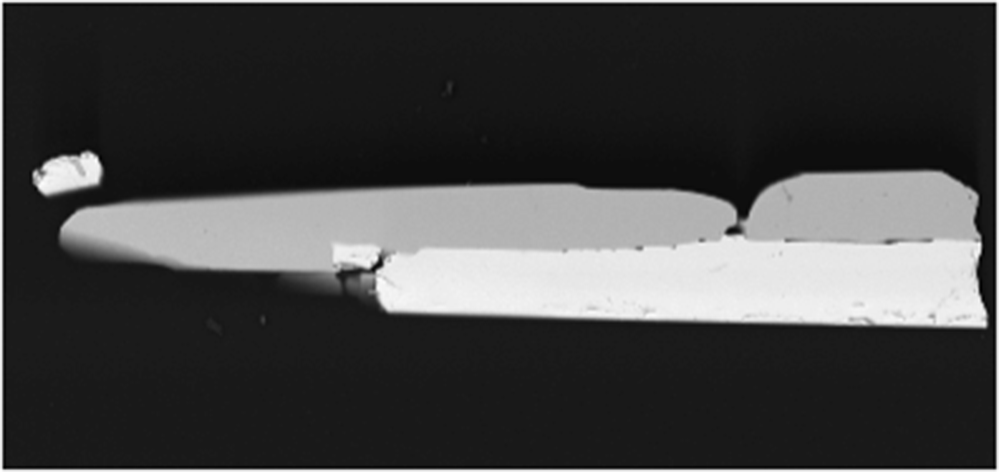
Associated minerals are sanidine, K-bearing albite, nosean, biotite, Nb-rich ilmenite, Ti-rich magnetite, hercynite, corundum, samarskite-(Y), ekebergite and columbite-(Fe). Crystals of nioboixiolite-(Fe3+) and the above-listed associated oxide minerals occur on the walls of cavities of the host rock. Magnetite forms epitaxy on hercynite with a sharp border between the two spinel-group minerals. Nioboixiolite-(Fe3+) forms long prismatic to acicular crystals up to 0.03 × 0.06 × 1 mm elongated along the c axis and typically flattened on (100) (Fig. 2) and their epitaxial intergrowths with ilmenite (Fig. 3) as well as intermediate members of the samarskite–ekebergite series (Fig. 4). The main crystal forms are {100} and {010}. The subordinate (terminal) forms are {011} and {001}. Twinning is not observed.
Crystals of nioboixiolite-(Fe3+) on sanidinite. FOV widths: 0.3 mm (a) and 0.5 mm (b). Photos by V. Betz.

Epitaxy of acicular crystals of nioboixiolite-(Fe3+) on a crystal of Nb-rich ilmenite overgrowing colourless sanidine. FOV width: 0.7 mm.

Epitaxial overgrowth of nioboixiolite-(Fe3+) (darker crystal) on a zoned crystal consisting of two samarskite-series minerals, with samarskite-(Y) (inner) and ekebergite (outer) zones. SEM (BSE) image of a polished section. FOV width: 0.5 mm.

The colour and streak of nioboixiolite-(Fe3+) are black and the lustre is submetallic. Nioboixiolite-(Fe3+) is brittle. The mean hardness determined by micro-indentation (load 50 g) is 499 kg mm–2 (range 433–560, n = 3) which corresponds to a Mohs’ hardness of 5. The density of the new mineral could not be measured because of the absence of heavy liquids with D > 5 g cm–3 and scarcity of pure material to use a volumetric method. The density calculated using the empirical formula and unit-cell volume refined from single-crystal XRD data is equal to 5.033 g·cm–3.
Raman spectroscopy
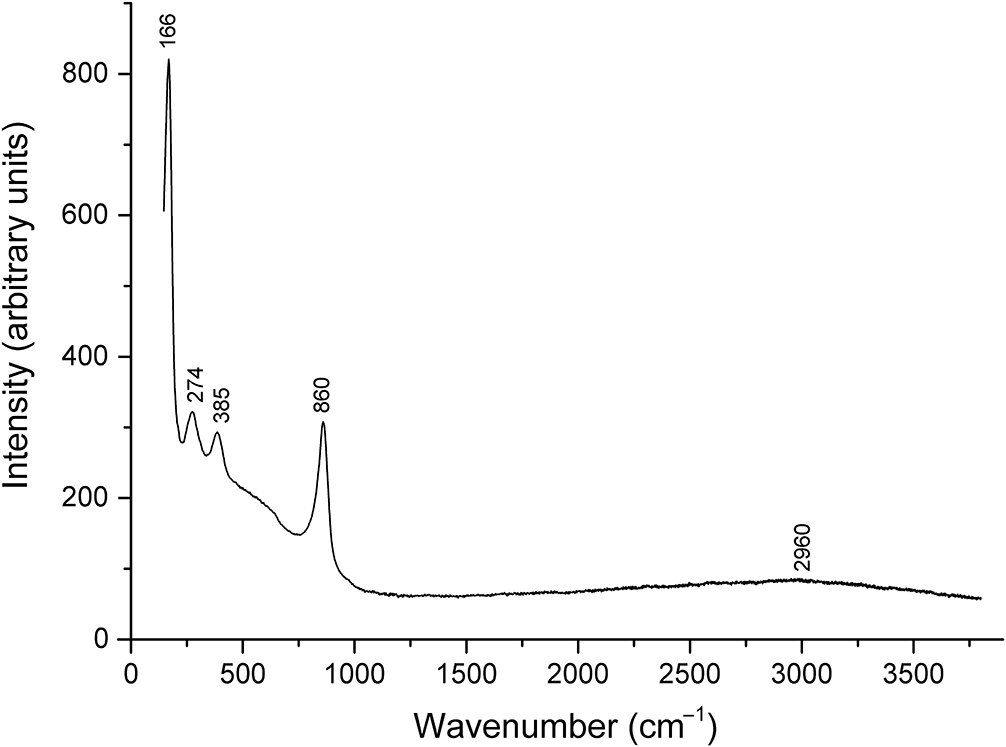
The Raman spectrum of nioboixiolite-(Fe3+) is given in Fig. 5. Taking into account force characteristics of cations, the bands at 860 and 385 cm–1 can be assigned to stretching vibrations of (Nb,Ti)–O–(Nb,Ti) and (Nb,Ti)–O–Mn2+, respectively. The broad shoulder in the range of 500–600 cm–1 may correspond to overlapping bands of stretching vibrations of (Nb,Ti)–O–M3+ and M3+–O–M3+ (M = Fe, Al and Cr). The bands at 166 and 274 cm–1 are assigned tentatively to bending vibrations and a mixed mode involving both stretching and bending internal coordinates, respectively.
The Raman spectrum of nioboixiolite-(Fe3+).

The hump with the maximum at ∼ 2960 cm–1 is due to luminescence from Fe3+. No other bands are observed in the Raman spectrum of nioboixiolite-(Fe3+) above 900 cm–1 which indicates the absence of H-, B- and C-bearing groups.
Optical properties
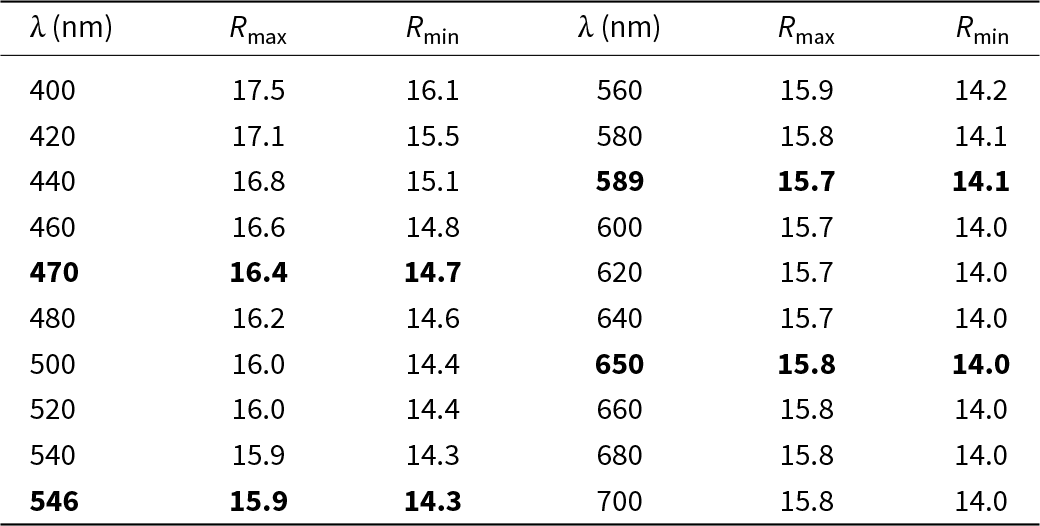
In reflected light, nioboixiolite-(Fe3+) is grey. Bireflectance is weak, ∆R = 1.6% (589 nm). Pleochroism is not observed. Anisotropy is distinct, from light grey to grey. Internal reflections are strong, bright-orange.
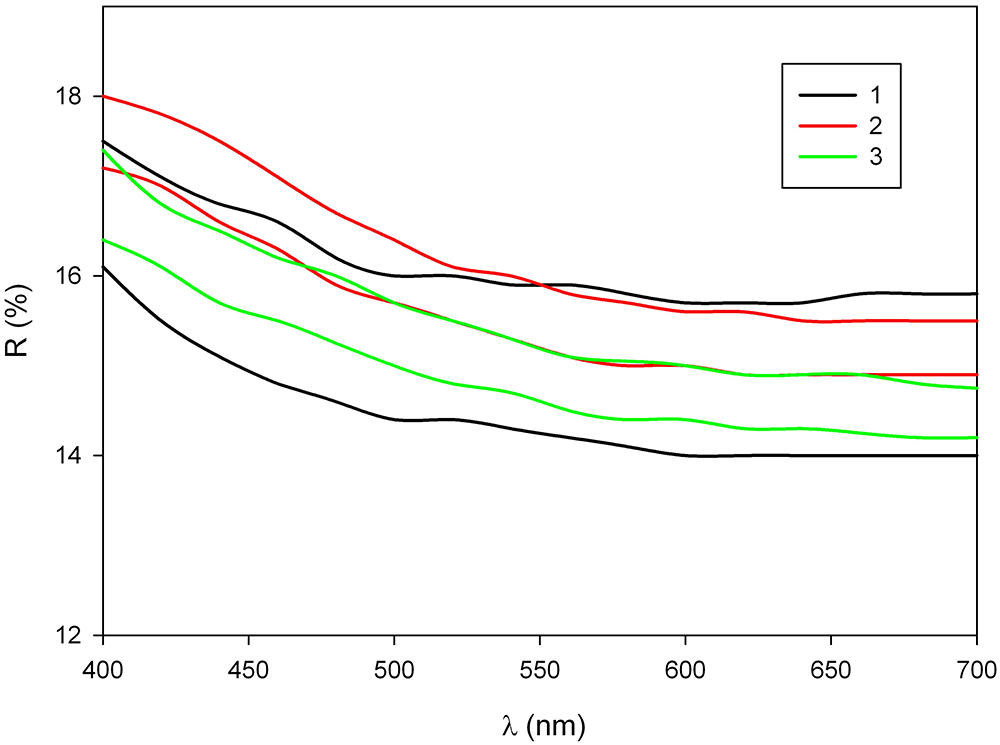
The reflectance values (R max/R min) are given in the Table 2 and plotted in Fig. 6 in comparison with the published data for other members of the ixiolite group within the columbite supergroup.
Reflectance data of nioboixiolite-(Fe3+)

Note: The Commission on Ore Mineralogy (COM) standard wavelengths are given in bold.
The reflectance curves (R max and R min values) for nioboixiolite-(Fe3+) (1; this work), compared with published data for nioboixiolite-(Mn2+) from the Sosedka vein, Malkhan pegmatite field, Russia (2; after Chukanov et al., Reference Chukanov, Pekov, Zubkova, Yapaskurt, Shelukhina, Britvin and Pushcharovsky2023b) and ixiolite-(Mn2+) from Wodgina, Pilbara, Australia (3; after Criddle and Stanley, Reference Criddle and Stanley1993).

Chemical data
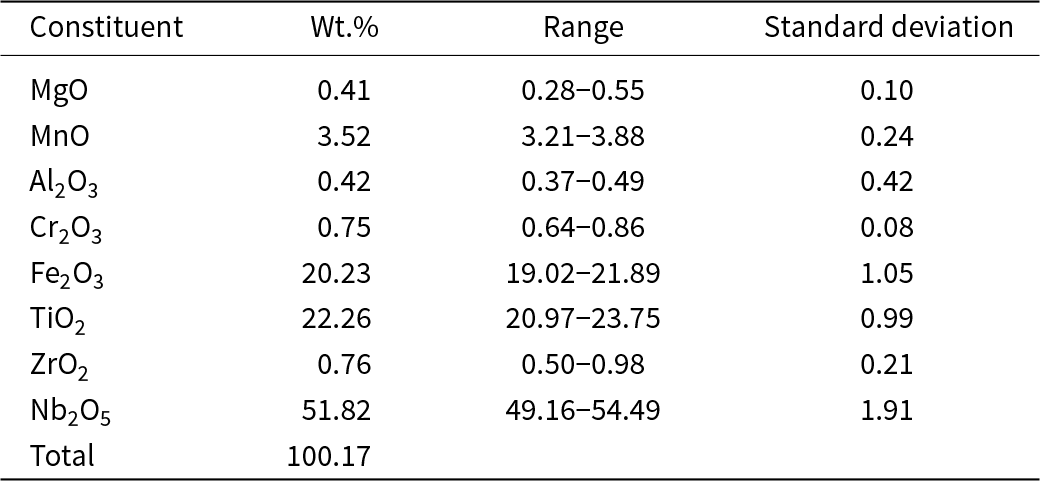
The analytical data are given in Table 3. H2O was not measured because no bands corresponding to OH-bearing groups were observed in the Raman spectrum. The crystal structure data confirmed the absence of OH groups. The contents of elements with atomic numbers higher than that of carbon are below detection limits.
Chemical data for nioboixiolite-(Fe3+)

For nioboixiolite-(Fe3+), the I(FeKβ5)/I(FeKβ5) ratio is equal to 0.02906 which corresponds to the oxidation degree of iron, η = 3.03 ± 0.08. Thus, all iron in nioboixiolite-(Fe3+) is trivalent.
The empirical formula calculated on 8 O atoms (Z = 1) is: [(Mg0.04Mn2+0.20)Σ0.24(Al0.03Cr0.04Fe3+1.01)Σ1.08(Ti1.11Zr0.02)Σ1.13Nb1.55]O8. In this formula, calculated with only Fe3+ and only Mn2+, the empirically obtained sum of cations is equal to 4.00. This is in a good agreement with trivalent state of iron determined from the X-ray spectrum.
In the empirical formula, the arrangement [(M3+2M5+2)O2–8] (54%) is the dominant one, followed by arrangement [M4+ 4O2–8] (28%) and arrangement [(M2+4/3M5+8/3)O2–8] (18%) (see Bosi et al., Reference Bosi, Hatert, Hålenius, Pasero, Miyawaki and Mills2019a, Reference Bosi, Biagioni and Oberti2019b). Thus, the ideal, end-member formula of nioboixiolite-(Fe3+) is (Nb0.5Fe3+0.5)O2 (Z = 4).
X-ray diffraction and crystal structure
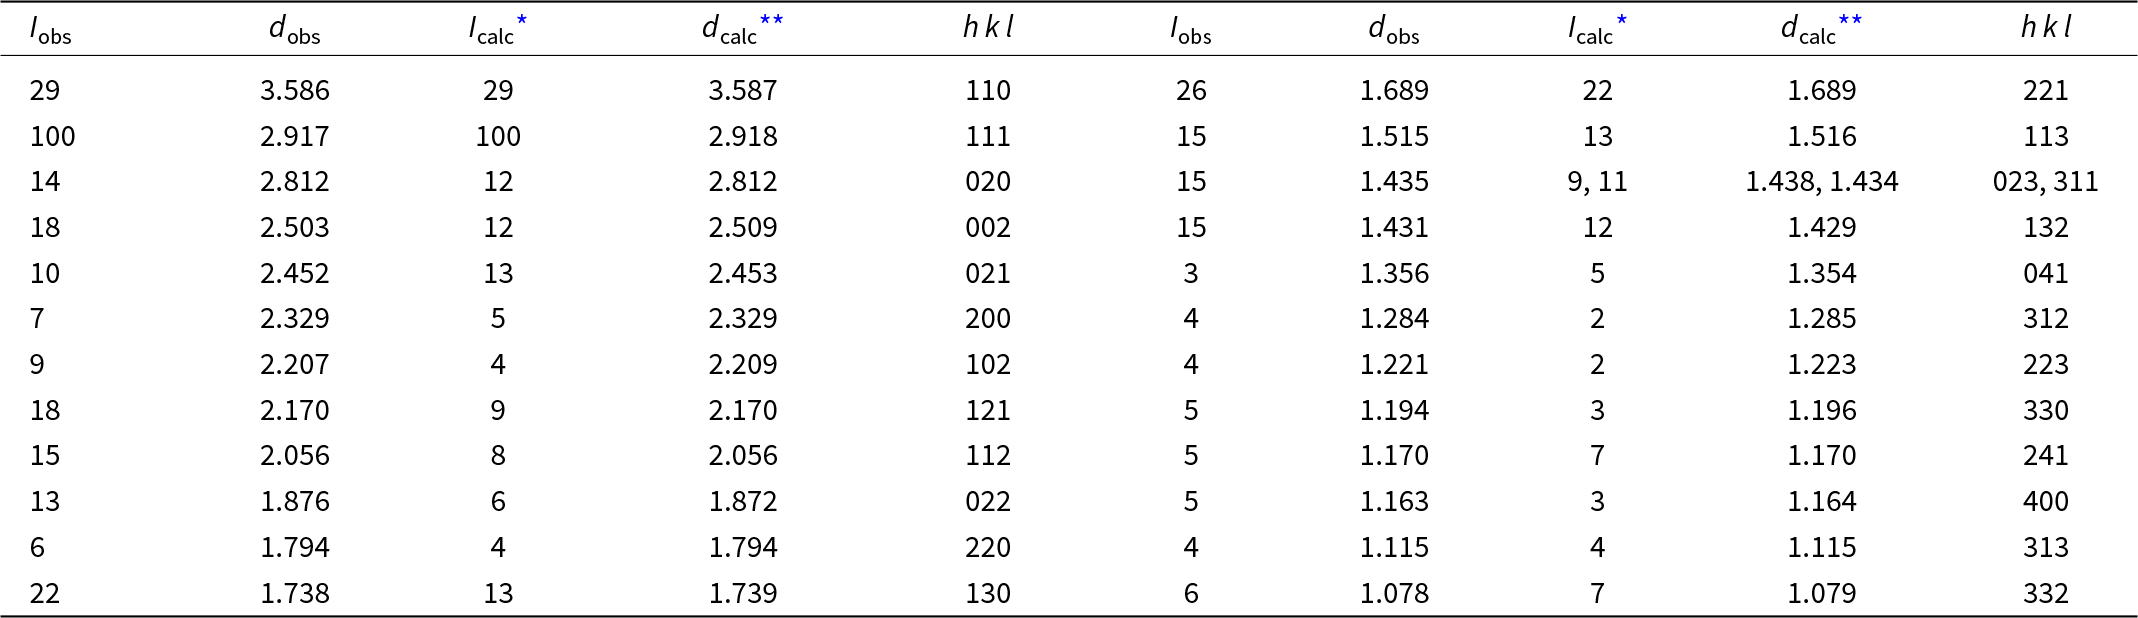
Powder X-ray diffraction data of nioboixiolite-(Fe3+) are given in Table 4. The orthorhombic unit-cell parameters refined from the powder data are: a = 4.652(1), b = 5.625(1), c =5.015(1) Å and V = 131.2(1) Å3.
Powder X-ray diffraction data (d in Å) of nioboixiolite-(Fe3+)

* For the calculated pattern, only reflections with intensities ≥1 are given.
** For the unit-cell parameters obtained from single-crystal data.
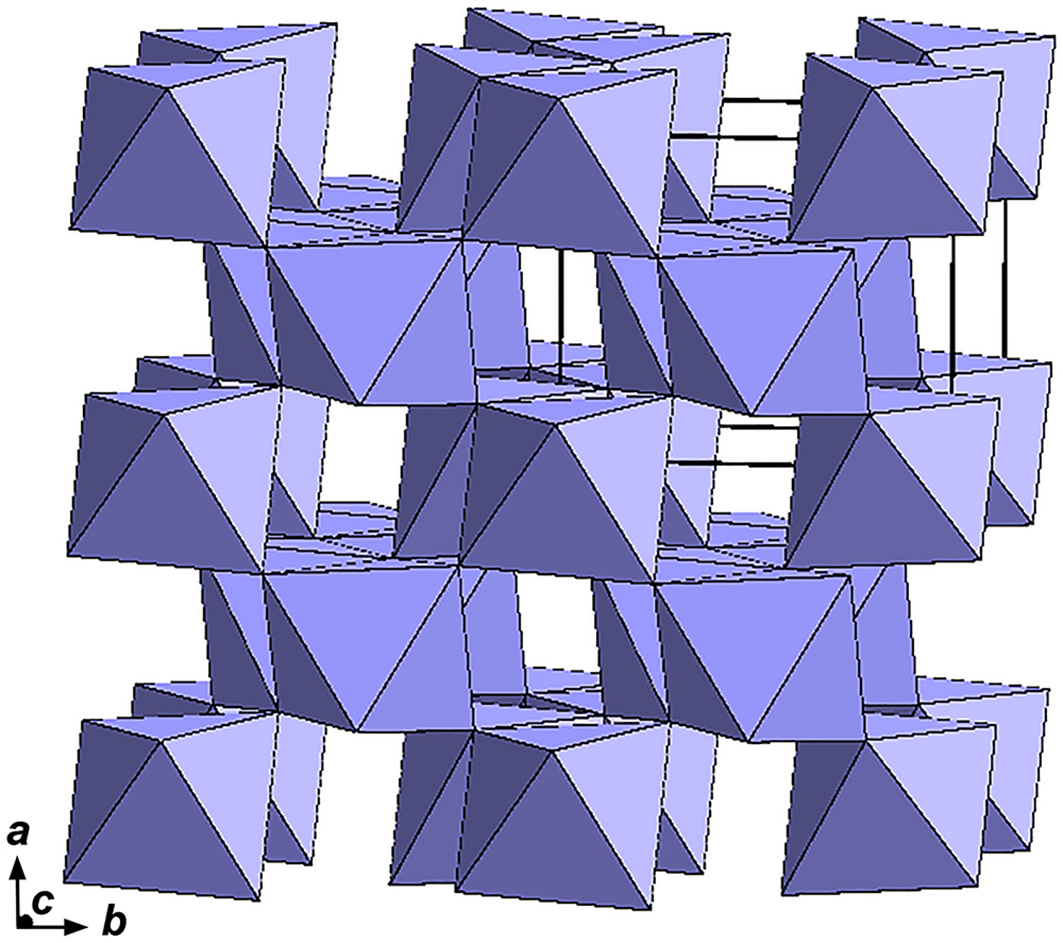
The crystal structure of nioboixiolite-(Fe3+) (Fig. 7) is the same as the structures of other ixiolite-group minerals. It is based upon zigzag-like chains of edge-shared MO6 octahedra running along the c axis. Along the a axis, the chains are connected via common vertices of octahedra. All cations in the structure of nioboixiolite-(Fe3+) are disordered and occur at the single M site whose occupancy was refined for Nb vs. Ti. The MO6 octahedron is distorted, with two short M–O distances [1.863(4) Å], two medium ones [1.988(4) Å] and two elongate bonds [2.207(4) Å] with average <M–O≥ 2.019 Å. Atom fractional coordinates, equivalent-isotropic displacement parameters and bond valence sums are presented in Table 5.
Fractional coordinates, equivalent-isotropic displacement parameters (U eq, in Å2) of atoms and bond valence sums (BVS) in the structure of nioboixiolite-(Fe3+)

* BVS were calculated using the parameters from Gagné and Hawthorne (Reference Gagné and F.C2015) for the M site with the occupancy Nb0.5Fe3+0.5.
The crystal structure of nioboixiolite-(Fe3+). The unit cell is outlined. The figure was drawn using Diamond Version 3.2k. (https://www.crystalimpact.de/diamond).

The refined number of electrons at the M site is 30.4, which is very close to 30.6 calculated from the empirical formula (the deviation is within experimental uncertainty).
Discussion
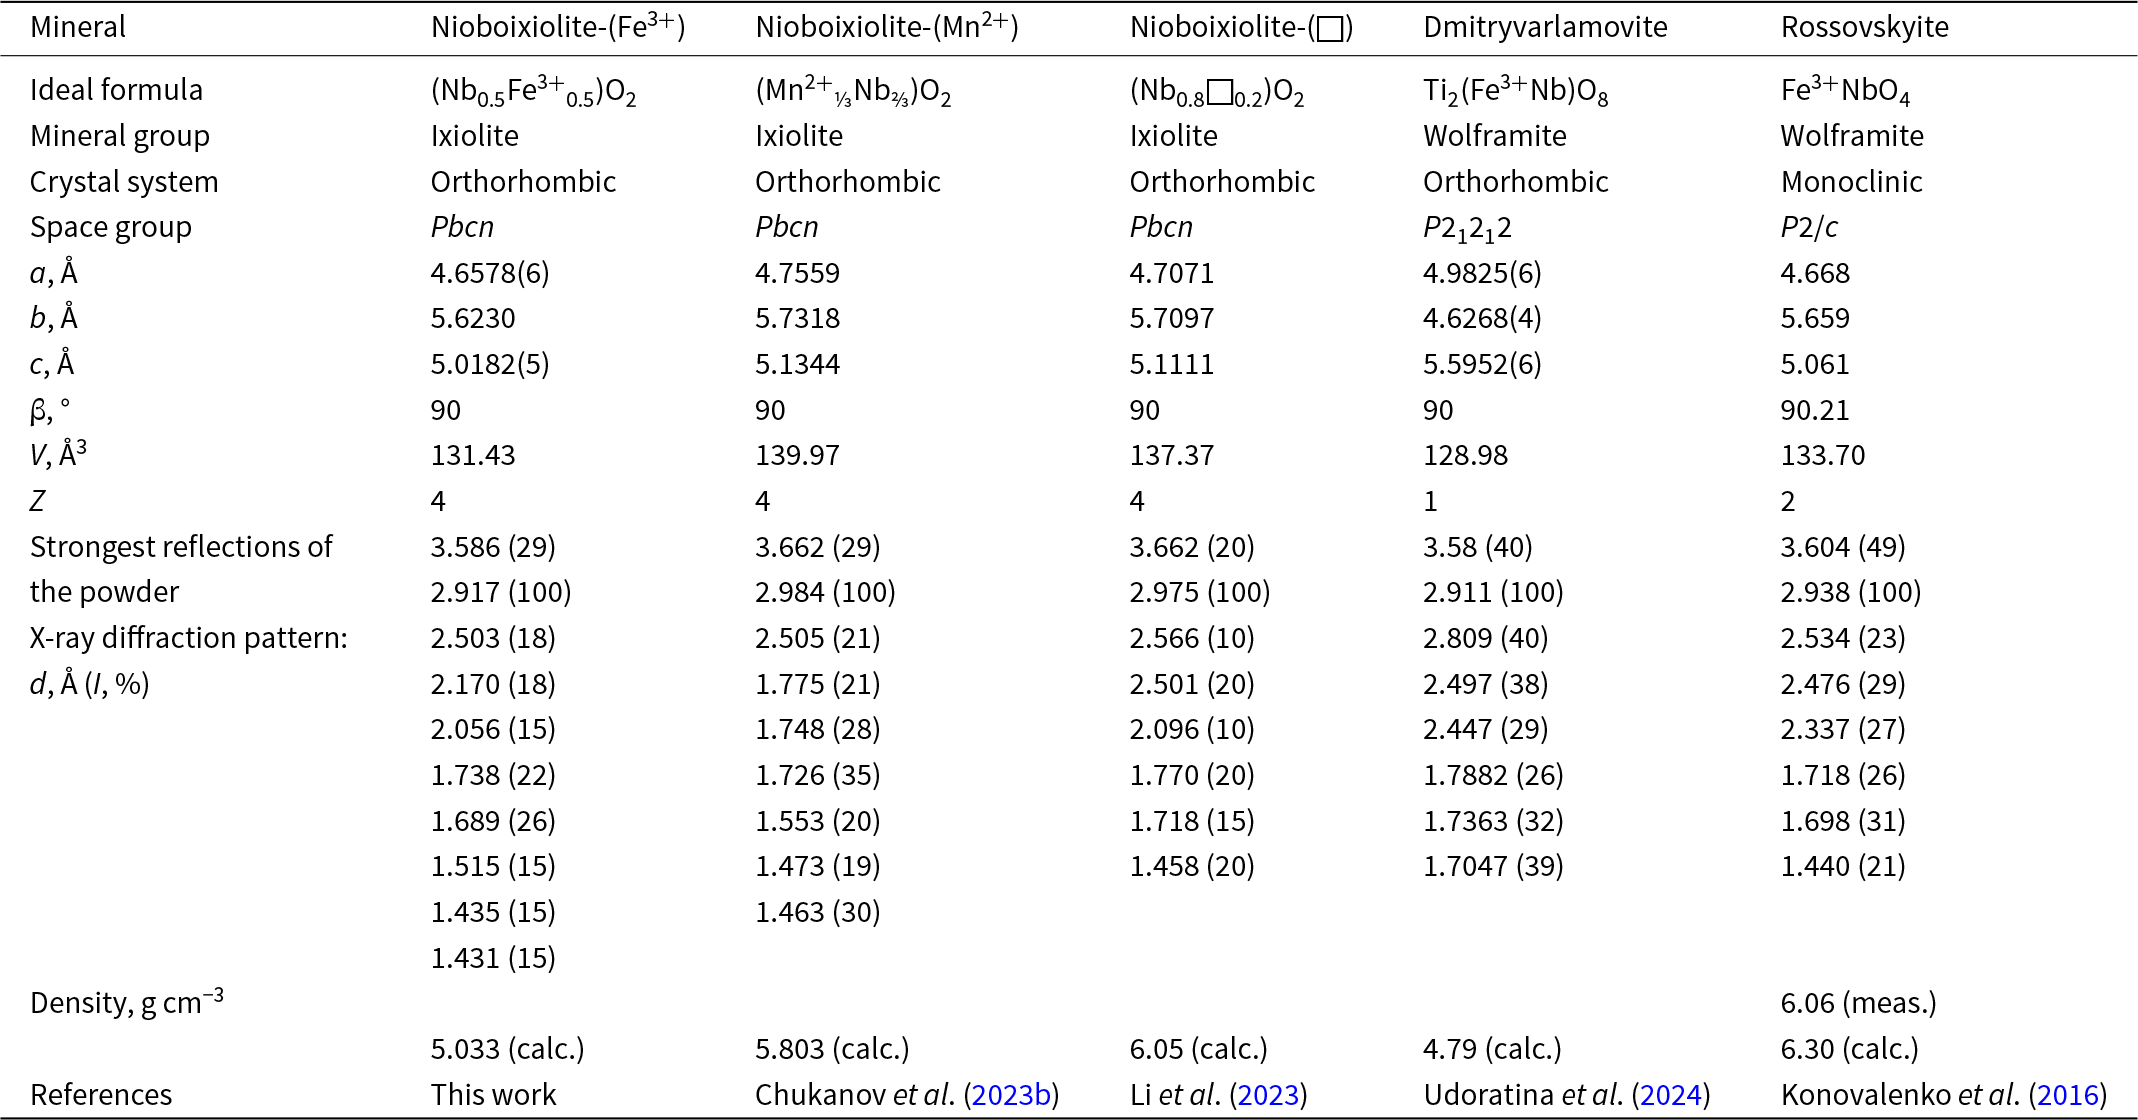
Comparative data for nioboixiolite-(Fe3+) and chemically related columbite-supergroup minerals are given in Table 6. Nioboixiolite-(Fe3+) is dimorphous with rossovskyite, ideally Fe3+NbO4, a mineral belonging to the wolframite group. The crystal structure of rossovskyite is a derivative of the ixiolite-type structure characterised by the ordering of the cations with lowering of the symmetry to monoclinic, space group P2/c. It can be represented as a sequence of two kinds of structurally identical, but chemically different, octahedral layers of parallel zig-zag chains alternating along the a axis (Konovalenko et al., Reference Konovalenko, Ananyev, Chukanov, Rastsvetaeva, Aksenov, Baeva, Gainov, Vagizov, Lopatin and Nebera2016).
Comparative data for nioboixiolite-(Fe3+) and related columbite-supergroup minerals

A characteristic feature of the mineral studied in this work is the absence of tantalum in its composition, despite the fact that tantalum minerals of the ixiolite group are generally much more common than niobium members of this group. Apparently, the absence of tantalum in nioboixiolite-(Fe3+) is due to two reasons. On the one hand, niobium has a stronger affinity for structures with highly distorted octahedra than tantalum. On the other hand, the absence of tantalum in nioboixiolite-(Fe3+) may be partly due to geochemical factors.
Most occurrences of ixiolite-group minerals, both Ta- and Nb-dominant, are related to granites and their derivatives. In general, feldspathoid rocks are characterised by extremely high Nb:Ta ratio (Parker and Fleischer, Reference Parker and Fleischer1968) and tantalum-rich minerals are very rare in this formation. In particular, all Nb-bearing accessory minerals of this rock are significantly depleted in tantalum in comparison with acidic igneous rocks and related pegmatites. In this reference, it is important to note that nosean syenite of the Laach Lake volcano is considered as a rock which is cogenetic with the phonolitic host magma and crystallised at temperatures below 700°C (Schmitt et al., Reference Schmitt, Wetzel, Cooper, Zou and Wörner2010).
Epitaxial intergrowths of nioboixiolite-(Fe3+) with ilmenite and minerals of the samarskite-(Y)–ekebergite series are due to the topological similarity of chains of octahedra in their structures and, as a consequence, the near-commensurability of the parameters of their unit cells: for nioboixiolite-(Fe3+), a ≈ 4.66 and c ≈ 5.02 Å; for samarskite-(Y), a/2 ≈ 4.90 and c ≈ 5.21 Å; and for ilmenite, c/3 ≈ 4.69 and a ≈ 5.08 Å.
Supplementary material
The supplementary material for this article can be found at https://doi.org/10.1180/mgm.2025.15.
Acknowledgements
The authors are grateful to O. Siidra, M. Rumsey and an anonymous reviewer for valuable comments. The study was carried-out in accordance with the state tasks of Russian Federation, registration, numbers 124013100858-3 (chemical analysis, reflectance spectroscopy, identification of associated minerals and preparation of the manuscript) and 121061600049-4 (Raman spectroscopy and single-crystal XRD analysis). The powder XRD pattern was obtained at the Research Centre for X-ray Diffraction Studies of St Petersburg University in accordance with the State Task of the Russian Federation No. AAAA-A19-119091190094.
Competing interests
The authors declare none.